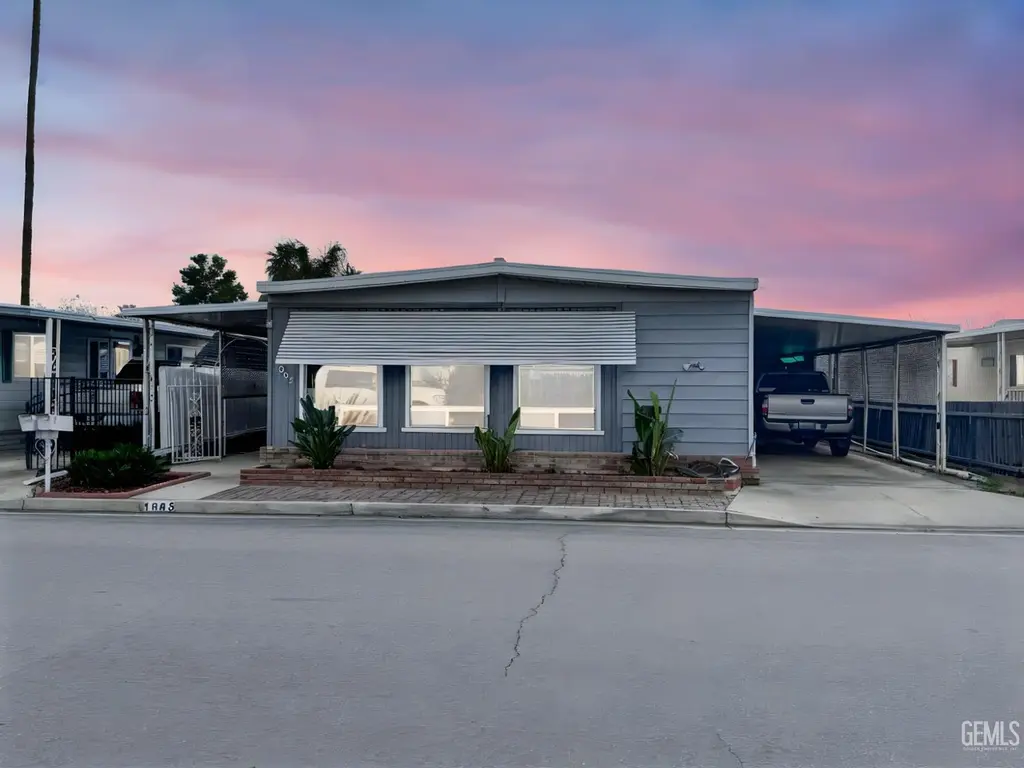
1005 Crown Ave · Bakersfield, CA
Flood risk 1/10 · Minimal
- FEMA flood zone
- X
- Chance of flooding over 30 yrs
- 0.0%
- Est. flood insurance / yr
- $507 – $1,088
Fire risk 6/10 · Moderate
- Est. fire insurance / yr
- $659 – $1,223
Heat risk 8/10 · Major
- Hot days now (above 105°F)
- 7 days/yr
- Hot days in 30 yrs
- 17 days/yr
Wind risk 1/10 · Minimal
- Chance of severe wind over 30 yrs
- —
Air-quality risk 10/10 · Severe
- Unhealthy air days now
- 39 days/yr
- Unhealthy air days in 30 yrs
- 45 days/yr
Risk factors via First Street. Map © Google.
Why this score? — see what drove the C+ grade
The composite is a weighted blend of 9 inputs, each scored 0–100. Each bar is that input's sub-score; the figure is the points it added to the 100-point composite (weight × sub-score).
- Cash flow +30.0/30.0
- 1% rule +10.0/10.0
- DSCR +10.0/10.0
- Schools +3.4/10.0
- Livability +2.9/5.0
- Condition / age +2.5/5.0
- ARV discount +1.8/15.0
- Rent growth +1.2/5.0
- Appreciation +0.0/10.0
$89,000
🖨 Deal sheet 📄 Offer letter ✓ Due diligence
Listing remarks MLS
Stunning 2-Bedroom, 2-Bath Double-Wide Home in Royal Palms - A Must-See! Step into the lifestyle you've been dreaming of with this gorgeous double-wide home located in the prestigious Royal Palms Senior Community. Thoughtfully upgraded with modern conveniences and surrounded by beautiful landscaping, this home offers the perfect blend of comfort, security, and charm. Newer Flooring throughout. Storage Shed and close proximity to pool. Call your favorite realtor and schedule your apt today.
Key facts
- Double-wide home
- Storage shed
- 4,500 sq ft lot
Tags
Neighborhood map
What this means for you Summary
Snapshot
- This is a 3-bed/2.0-bath manufactured listed at $89k.
Deal economics
- At list price, monthly cash flow is $711 ($9k/yr) — positive.
- The deal already cash-flows at list — no discount required.
- Meets the 1% rule at list price ($2k rent vs $89k).
- Recommended offer: $81k (9.0% below list) — sets the bar for market timing.
- Cap rate 15.9% vs local median 3.6% in Bakersfield — top-decile yield for the area; either an underpriced asset or a hidden risk that comps aren't pricing in. Stress-test before assuming the spread holds.
Location & tenants
- Location reads 58/100 on livability (#716 in CA) — a working-class tenant base; expect higher turnover. Strengths: housing A+; Watch: health & safety D, schools D-, crime F.
- Kern High (urban): math 21% / reading 51% proficiency, ranked #860 of 1,400 in CA (top 61%) — families likely to look elsewhere, expect single-tenant / working-renter base with shorter leases.
- Market conditions: Rents falling (-5.1%/yr); 70 active listings in the ZIP; 28 comparable units currently listed for rent nearby; rentals leasing fast (median 3d on market — plan ~1-2 weeks tenant-placement turnaround); lower-income renter base — watch delinquency; 3,244 units permitted in Kern County in 2024 (73 in 5+ unit buildings).
- This rent runs 44% of the median local income ($44k/yr) — at the standard rent-burdened threshold; future hikes will face affordability resistance.
Forward outlook
- Local home prices are declining (-3.0%/yr); year-one equity from $615 of loan paydown is wiped out by about $3k of value loss. Plan a longer hold.
- Kern County population projected at +17% by 2050 — long-run rental-demand tailwind backs the buy-and-hold thesis.
- At projected returns (-3.0% appreciation + 0.0% rent growth), your $25k cash investment doubles in ~4 years — after that, you're playing with house money.
Negotiation context
- It's been on market 98 days — a 9% lower offer ($81k) is reasonable based on typical stale-listing flexibility.
Risks & watch-outs
- Climate carrying-cost: major wildfire risk; extreme-heat days projected 7→17/yr by 2055 (HVAC capex compounding) — expect insurance premiums to compound above CPI over the hold.
Questions for the listing agent
- It's been on market 98 days. Have you received any prior offers? Is the seller open to a 9% concession, seller financing, or rate buy-down credit?
- Built in 1972 — when were the roof, HVAC, electrical panel, plumbing, and water heater last replaced?
- Why hasn't it sold? Are there any deal-killer items the seller is aware of (foundation, flood, title, zoning, code violations)?
- Is there a deadline driving the sale (1031 exchange, divorce, estate, relocation)? That informs how much negotiation room exists.
- Schools are D-rated, which usually means shorter tenancies and higher turnover. Who's the typical renter profile here, and what's been the actual vacancy rate?
- Crime grade is F in this area — have there been break-ins, vandalism, or insurance claims at this property in the last 3 years? What carrier currently insures it and at what premium?
- What's the average days-on-market for RENTAL listings here right now (not sales)? A rising rental-DOM trend means longer vacancies and softer asking-rent achievability than the comps imply.
- What's the recent tenant-quality profile in this submarket — average credit score on applications, eviction rate, late-payment / NSF rate, and stable-employment percentage? A property-management company in the area should have these aggregated.
- How much new for-sale + rental construction is in the pipeline within 1–3 miles? Heavy new supply typically softens prices + rents 12–24 months out; constrained supply supports both.
Investment metrics
- 1% rule
- 1.81% ✓
- Cap rate
- 15.89%
- Cash-on-cash
- 34.26%
- DSCR
- 2.52
- GRM
- 4.6
CMA / ARV
- ARV (median comp)
- $79,045
- List price
- $89,000
- Delta
- 16.39%
- Verdict
- OVERPRICED
- Comps
- 20 within 1.0 mi
Show comp detail 12 sales within ~0.75 mi
| Address | Dist | Beds/Ba | Sqft | Sold | Price | $/sf | Match |
|---|---|---|---|---|---|---|---|
| 701 Underwood Ct | 0.24mi | 3/2.0 | 1,440 (0%) | 4mo | $85,000 | $59 | 86 |
| 4401 Prince St | 0.15mi | 2/1.8 (-1) | 1,440 (0%) | 8mo | $54,000 | $38 | 81 |
| 4204 Prince St | 0.13mi | 2/2.0 (-1) | 1,368 (-5%) | 1mo | $80,000 | $58 | 80 |
| 1012 Coconut Way | 0.16mi | 2/2.0 (-1) | 1,440 (0%) | 11mo | $75,000 | $52 | 79 |
| 609 42nd St | 0.27mi | 2/2.0 (-1) | 1,440 (0%) | 8mo | $37,500 | $26 | 76 |
| 4217 Kingman Ln | 0.11mi | 2/2.0 (-1) | 1,392 (-3%) | 13mo | $89,000 | $64 | 73 |
| 612 44th St | 0.26mi | 3/2.0 | 1,336 (-7%) | 6mo | $95,000 | $71 | 71 |
| 4212 King Arthur Ct | 0.10mi | 2/2.0 (-1) | 1,344 (-7%) | 17mo | $74,000 | $55 | 65 |
| 4605 Q St | 0.29mi | 2/2.0 (-1) | 1,536 (+7%) | 6mo | $85,000 | $55 | 65 |
| 504 44TH St | 0.34mi | 2/2.0 (-1) | 1,440 (0%) | 18mo | $82,000 | $57 | 64 |
| 4504 Q St | 0.30mi | 2/1.5 (-1) | 1,440 (0%) | 20mo | $60,000 | $42 | 62 |
| 4300 Prince St | 0.15mi | 2/2.0 (-1) | 1,248 (-13%) | 7mo | $45,000 | $36 | 60 |
Match score weights: distance 35% · size 25% · config 20% · recency 20%. Top-matched comps best support the ARV.
Projected returns pro-forma
-3.0% appreciation · 0.0% rent growth · sell at horizon
- IRR
- 26.3%
- Equity multiple
- 2.05×
- Total profit
- $26,154
- Equity at exit
- $13,270
- IRR
- 32.2%
- Equity multiple
- 3.52×
- Total profit
- $62,812
- Equity at exit
- $7,695
Cash invested: $24,920 (down + closing). Projections, not guarantees.
Landlord ↔ Tenant lean methodology
- Overall (STATE)
- 18 Strongly Tenant-Friendly
- State California
- 18 Strongly Tenant-Friendly · D+13
- County
- — inherits STATE
- City
- — inherits STATE
ZIP-level market 93301
- Home prices YoY
- -9.4%
- Rents YoY
- -5.1%
- Active inventory
- 70
- Price-to-rent
- 4.6×
Monthly cashflow live
- Estimated rent
- $1,614 high interval (Pro) →
- Mortgage (P&I)
- −$467
- Tax from tax record
- −$60 /mo · $720/yr
- Insurance
- −$37
- HOA
- −$0
- Vacancy / Maint / Mgmt
- −$339
- Net cashflow
- $711
Break-even live
UW: 25.0% down · 7.5% · 30yr · 1.5% tax · 5.0% vac · 8.0% maint · 8.0% mgmt
Financing live
Cash to close
- Down payment
- $22,250
- Closing costs
- $2,670
- Reserves months
- —
- Total cash needed
- —
Loan-product check · same deal, 3 products live
Conventional
25% down · 7.5% · 30yr
- Down + closing
- —
- Monthly P&I
- —
- Monthly cashflow
- —
- DSCR
- —
- Eligible?
- —
Personal DTI + credit; lowest rate.
DSCR
20% down · 8.5% · 30yr
- Down + closing
- —
- Monthly P&I
- —
- Monthly cashflow
- —
- DSCR
- —
- Eligible?
- —
No personal income docs; deal must DSCR.
Hard money
10% down · 12.0% · 12mo
- Down + closing
- —
- Monthly P&I
- —
- Monthly cashflow
- —
- DSCR
- —
- Eligible?
- —
Short-term bridge; refi at stabilization.
Rent comps 28 comps
| Address | Beds | Baths | Sqft | Rent | $/sqft | DOM | Units | Dist |
|---|---|---|---|---|---|---|---|---|
| 1201 40th St Bakersfield, CA | 2.0–3.0 | 1.0–2.0 | 870 | $1,219 | $1.40 | 2d | 1 | 0.17mi |
| 3700 Q St Bakersfield, CA | 3.0 | 2.0 | 1088 | $1,600 | $1.47 | 3d | 1 | 0.42mi |
| 4504 Tierra Verde St Unit C Bakersfield, CA | 2.0 | 1.5 | 925 | $1,595 | $1.72 | 2d | 1 | 0.58mi |
| 223 McCord Ave Bakersfield, CA | 3.0 | 2.0 | 1536 | $1,795 | $1.17 | 2d | 1 | 0.82mi |
| 1951 Golden State Ave Bakersfield, CA | 1.0–3.0 | 1.0–2.5 | 1017 | $1,695 | $1.67 | 2d | 2 | 0.83mi |
| 715 30th St Bakersfield, CA | 3.0 | 1.0 | 1000 | $1,500 | $1.50 | 21d | 1 | 0.86mi |
| 3333 El Encanto Ct Bakersfield, CA | 2.0 | 2.0 | 990 | $1,595 | $1.61 | 14d | 1 | 0.86mi |
| 3333 El Encanto Ct Bakersfield, CA | 2.0 | 1.5 | 990 | $1,495 | $1.51 | 2d | 1 | 0.86mi |
| 448 S Oildale Dr Bakersfield, CA | 3.0 | 2.0 | 1080 | $1,500 | $1.39 | 2d | 1 | 0.88mi |
| 617 30th St Apt B Bakersfield, CA | 2.0 | 1.0 | 918 | $1,225 | $1.33 | 10d | 1 | 0.88mi |
| 130 El Cerrito Dr Bakersfield, CA | 3.0 | 2.0 | 1767 | $2,750 | $1.56 | 44d | 1 | 0.91mi |
| 327 McCord Ave Unit 6 Bakersfield, CA | 3.0 | 1.0 | 1000 | $1,500 | $1.50 | 2d | 1 | 0.93mi |
| 516 28th St Unit 4 Bakersfield, CA | 2.0 | 1.0 | 900 | $1,075 | $1.19 | 2d | 1 | 0.95mi |
| 2520 Loma Linda Dr Bakersfield, CA | 3.0 | 2.0 | 1200 | $2,075 | $1.73 | 10d | 1 | 0.95mi |
| 631 28th St Unit 3 Bakersfield, CA | 2.0 | 1.0 | 1040 | $1,075 | $1.03 | 21d | 1 | 0.97mi |
| 631 28th St Unit 5 Bakersfield, CA | 2.0 | 1.0 | 1040 | $1,075 | $1.03 | 2d | 1 | 0.97mi |
| 115 Irene St Bakersfield, CA | 3.0 | 1.0 | 1620 | $1,900 | $1.17 | 2d | 1 | 0.98mi |
| 222 Moneta Ave Unit 222 Bakersfield, CA | 3.0 | 2.0 | 1040 | $1,700 | $1.63 | 2d | 1 | 1.00mi |
| 106 E Warren Ave Bakersfield, CA | 3.0 | 2.0 | 1169 | $1,400 | $1.20 | 10d | 1 | 1.06mi |
| 114 Flower St Bakersfield, CA | 3.0 | 1.5 | 1771 | $2,000 | $1.13 | 2d | 1 | 1.10mi |
| 627 Hood Dr Bakersfield, CA | 3.0 | 1.0 | 1140 | $1,795 | $1.57 | 2d | 1 | 1.11mi |
| 222 Harding Ave Unit B Bakersfield, CA | 3.0 | 2.0 | 1100 | $1,750 | $1.59 | 2d | 1 | 1.11mi |
| 213 Oildale Dr Unit A Bakersfield, CA | 2.0 | 2.0 | 928 | $1,195 | $1.29 | 2d | 1 | 1.12mi |
| 217 Jefferson St Bakersfield, CA | 3.0 | 2.0 | 980 | $1,550 | $1.58 | 21d | 1 | 1.13mi |
| 627 Beardsley Ave Bakersfield, CA | 3.0 | 1.0 | 967 | $1,575 | $1.63 | 44d | 1 | 1.16mi |
| 415 Jeffrey St Bakersfield, CA | 2.0 | 1.0 | 1000 | $1,400 | $1.40 | 2d | 1 | 1.34mi |
| 419 Washington Ave Unit 417 Bakersfield, CA | 3.0 | 2.0 | 975 | $1,500 | $1.54 | 2d | 1 | 1.44mi |
| 525 Jeffrey St Bakersfield, CA | 2.0 | 1.0 | 1700 | $1,700 | $1.00 | 2d | 1 | 1.46mi |
Listing history 16 events
-
2026-06-18days on market $89,000 Active 98 DOM
-
2026-06-17days on market $89,000 Active 97 DOM
-
2026-06-16pricedays on market $89,000 Active 96 DOM
-
2026-06-15days on market $92,000 Active 95 DOM
-
2026-06-14days on market $92,000 Active 93 DOM
-
2026-06-10days on market $92,000 Active 90 DOM
-
2026-06-09days on market $92,000 Active 89 DOM
-
2026-06-08days on market $92,000 Active 88 DOM
-
2026-06-07days on market $92,000 Active 87 DOM
-
2026-06-05days on market $92,000 Active 84 DOM
-
2026-06-03days on market $92,000 Active 83 DOM
-
2026-06-03days on market $92,000 Active 82 DOM
-
2026-06-01days on market $92,000 Active 81 DOM
-
2026-05-31days on market $92,000 Active 80 DOM
-
2026-04-28price $92,000 494-char remark
Show marketing remark (494 chars)
Stunning 2-Bedroom, 2-Bath Double-Wide Home in Royal Palms - A Must-See! Step into the lifestyle you've been dreaming of with this gorgeous double-wide home located in the prestigious Royal Palms Senior Community. Thoughtfully upgraded with modern conveniences and surrounded by beautiful landscaping, this home offers the perfect blend of comfort, security, and charm. Newer Flooring throughout. Storage Shed and close proximity to pool. Call your favorite realtor and schedule your apt today.
-
2026-03-12$99,000 Active 494-char remark
Show marketing remark (494 chars)
Stunning 2-Bedroom, 2-Bath Double-Wide Home in Royal Palms - A Must-See! Step into the lifestyle you've been dreaming of with this gorgeous double-wide home located in the prestigious Royal Palms Senior Community. Thoughtfully upgraded with modern conveniences and surrounded by beautiful landscaping, this home offers the perfect blend of comfort, security, and charm. Newer Flooring throughout. Storage Shed and close proximity to pool. Call your favorite realtor and schedule your apt today.
ⓘ Source: listings_history table (triggers on properties + properties_extension) + one-shot
backfill from property_details.listing_events for pre-trigger history.
Tax reassessment forecast CA · Resets to sale price
- Current annual tax
- $720 · $60/mo
- Projected year-2 tax
- $720 · $60/mo
- Expected delta
- $0/yr ($0/mo · 0.0%)
ⓘ Screening estimate from a state-policy table — verify with the county assessor before closing.
Climate risk First Street
- Flood 1/10 Low FEMA zone X · 0% chance over 30 yrs
- Wildfire 6/10 Major
- Heat 8/10 Severe 7 d/yr ≥105°F today · 17 d/yr by 30 yrs out
- Wind 1/10 Low
- Air quality 10/10 Extreme 39 unhealthy d/yr today · 45 by 30 yrs out
Nearby sold comps map
Loading sold comps map…
Walkable amenities ~0.75 mi
Loading nearby amenities…
Taxation est. · year 1
- Rental income
- $19,372
- − Mortgage interest
- −$4,985
- − Property taxes
- −$720
- − Insurance
- −$445
- − Repairs & maintenance
- −$1,550
- − Management
- −$1,550
- − Depreciation
- −$2,589
- Taxable income
- $7,533
- Est. tax owed @ 24.0%
- −$1,808
- After-tax cash flow
- $6,730/yr
For passive investors: Depreciation is non-cash, so a rental often shows a tax loss while cash-flowing — sheltering income. Rental losses are passive: they offset passive income freely, and up to $25,000/yr can offset ordinary (W-2) income if you actively participate and your MAGI is under $100k (phasing out to $0 by $150k); unused losses carry forward. On sale, claimed depreciation is recaptured at up to 25%, and gains may owe capital-gains tax (a 1031 exchange can defer both). Figures are a year-1 estimate at your 24.0% rate — not tax advice; consult a CPA.
Schools (NCES district)
- District
- Kern High
- NCES district ID
- 0619540
- Math proficiency
- 21% ▬ 0.00%
- Reading proficiency
- 51% ▲ 2.00%
- Median HH income
- $49,686
- Composite
- 33.68/100
- National rank
- #10443
- State rank
- #860 of 1400 in CA
Livability — Bakersfield
- Score
- 58/100
- State rank
- #716
- US rank
- #21355
Category grades
Schools grade is shown separately in the Schools card above.
Census & demographics
- Census place
- Bakersfield, CA
- County
- Kern County · 710,371 people
- City population
- 499,124
- Metro
- Bakersfield, CA
- Population (ZIP)
- 13,620
- Household income
- $43,561
- Rent vs Own
- Severe rent burden
- 1296.0
Population outlook (Kern County) Hauer SSP2
- Today (2025)
- 947,286 people
- By 2030
- 978,984 · +3.3%
- By 2040
- 1,045,018 · +10.3%
- By 2050
- 1,105,232 · +16.7%
- By 2075
- 1,229,538 · +29.8%
- By 2100
- 1,238,059 · +30.7%
Race, ethnicity, and origin ACS 2023
- Neighborhood character
- Diverse neighborhood (Simpson 0.63)
- Race & ethnicity
- Hispanic / Latino 45% White 41% Two or more races 16% Black 5% Native American 2% Asian 2%
- Hispanic origin (detail)
- Mexican 37% Puerto Rican 5%
- Common ancestry
- Slovak 2% Scotch-Irish 2% Subsaharan African 2%
- Foreign-born
- 10% · Canada, South Korea
- Languages at home
- 68% English-only · Spanish 29% Russian/Polish/Slavic 2%
Political lean MEDSL · Kern
- 2024 margin
- Strong R (+21.1) · D 38.2% · R 59.3% · Other 2.5%
- 2008→2024 swing
- -3.3pp toward R · 2008: -17.8pp · 2024: -21.1pp
- All cycles
- 2024: R+21.1 2020: R+10.2 2016: R+15.0 2012: R+20.9 2008: R+17.8
Not yet ingested
- Civics
- —
Market trends
- HPI YoY
- ▼ -38.38%
- Current HPI
- 370.1318
- Rent YoY
- ▼ -5.12%
- Metro
- Bakersfield, CA
- State GDP YoY
- ▲ 3.21%
- F500 in state
- 116
Industry mix (Fortune 500 HQ in CA)
| Industry | F500 HQs | Revenue |
|---|---|---|
| Technology | 27 | $1,492B |
|
||
| Financial Services | 3 | $174B |
|
||
| Retail | 3 | $44B |
|
||
| Insurance | 3 | $26B |
|
||
| Media / Entertainment | 2 | $115B |
|
||
| Pharmaceuticals / Biotech | 2 | $62B |
|
||
Price history
-7.1% since first listed2 events — show timeline
- 2026-04-28 Price Changed $92,000 GEMLS
- 2026-03-12 Listed $99,000 GEMLS
Property tax history
+16.1%/yrLatest (2025): $720 · +290.3% YoY. Source: county tax records.
Cash-flow waterfall
monthlySold comps — $/sqft
last 12 mo · ≤1 miLoading sold comps…