5270 Mallard Rd · Middleburg, FL
Flood risk 1/10 · Minimal
- FEMA flood zone
- X (unshaded)
- Chance of flooding over 30 yrs
- 0.0%
- Est. flood insurance / yr
- $507 – $1,088
Fire risk 7/10 · Major
- Est. fire insurance / yr
- $947 – $1,759
Heat risk 8/10 · Major
- Hot days now (above 109°F)
- 7 days/yr
- Hot days in 30 yrs
- 19 days/yr
Wind risk 9/10 · Severe
- Chance of severe wind over 30 yrs
- 99.0%
Air-quality risk 2/10 · Minimal
- Unhealthy air days now
- 2 days/yr
- Unhealthy air days in 30 yrs
- 2 days/yr
Risk factors via First Street. Map © Google.
Why this score? — see what drove the D grade
The composite is a weighted blend of 9 inputs, each scored 0–100. Each bar is that input's sub-score; the figure is the points it added to the 100-point composite (weight × sub-score).
- Cash flow +13.8/30.0
- ARV discount +6.2/15.0
- Schools +5.1/10.0
- DSCR +4.2/10.0
- Rent growth +3.3/5.0
- Livability +3.2/5.0
- 1% rule +2.7/10.0
- Condition / age +2.5/5.0
- Appreciation +0.0/10.0
$255,000
🖨 Deal sheet (PDF) 📄 Offer letter ✓ Due diligence
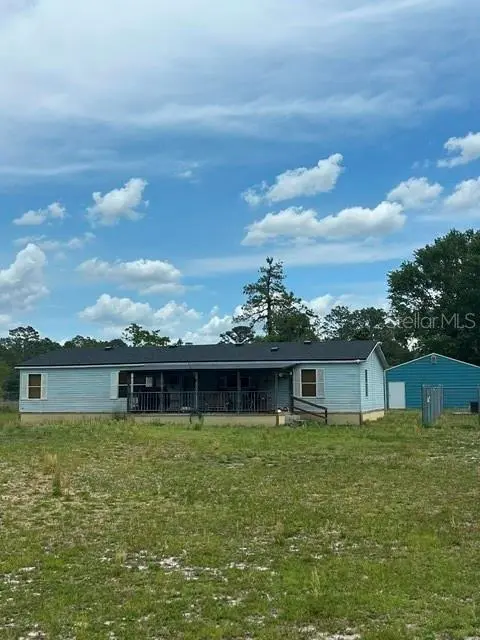
Listing remarks
Great country retreat on over 1 acre! This 3-bedroom, 2 bath home with a newer roof and A/C offers an open floor plan with a cozy fireplace , eat in kitchen and split bedroom layout for added privacy. Enjoy the covered front porch and a large 50x12 screened in back porch, perfect for hanging out with the family entertaining, around the pool table or simply relaxing. A great value at this price which includes a 30x36 workshop with electricity and large doors, ideal for vehicles, boat storage, or hobbies. Additional 10x20 outbuilding and spacious pump house provides tons of extra storage. This property has plenty of space, functionality, and country charm.
Key facts
- Covered front porch
- Outbuilding
- Newer roof
Tags
Property features AI
Finance
- Other: Total acreage approximately 1.25 acres
- HOA & community: No association
Exterior
- Parking: 2-car garage; 30 x 36 garage space; Boat parking; RV access/parking; Oversized parking; Off-street parking
- Utilities: Well water; Septic tank; Electricity connected; One well; One septic
- Home design: Manufactured home (double wide); One story (two levels); Faces east; Homestead property
- Construction: Vinyl siding; Shingle roof; Crawlspace foundation; Built as double wide manufactured home
- Exterior features: Storage; Workshop; Chain link fencing; Cleared lot; Asphalt road access
Interior
- Kitchen: Range; Electric water heater
- Bedrooms: 3 bedrooms
- Flooring: Carpet; Laminate
- Bathrooms: 2 full bathrooms
- Heating & cooling: Heat pump; Central air
- Interior features: Ceiling fans; Living room / dining room combo; Vaulted ceilings; Decorative living room fireplace; Aluminum window frames; Storage rooms
- Laundry & utility: Washer hookup; Electric dryer hookup
Neighborhood map
What this means for you Summary
Snapshot
- This is a 3-bed/2.0-bath manufactured listed at $255k.
Deal economics
- At list price, monthly cash flow is $24 ($292/yr) — positive.
- The deal already cash-flows at list — no discount required.
- To meet the 1% rule (rent ≥ 1% of price), the offer needs to be $196k (23.1% below list).
- Recommended offer: $196k (23.1% below list) — sets the bar for 1% rule.
- Cap rate 6.4% vs local median 3.8% in Middleburg — top-decile yield for the area; either an underpriced asset or a hidden risk that comps aren't pricing in. Stress-test before assuming the spread holds.
Location & tenants
- Location reads 65/100 on livability (#657 in FL) — a middle-class / working-renter tenant base. Strengths: cost of living A+, housing A+; Watch: amenities F, commute F, health & safety F.
- Clay (suburban): math 58% / reading 59% proficiency, ranked #14 of 73 in FL (top 19%) — acceptable for families but not a draw, mixed tenant base, ~2y average lease.
- Zoned schools: Clay Hill Elementary School (math 57% / reading 47%, grade C-, #990 of 2,144 statewide, top 48%, 442 students, 100% FRL); Wilkinson Junior High School (math 54% / reading 49%, grade C, #232 of 571 statewide, top 41%, 752 students, 100% FRL); Middleburg High School (math 41% / reading 52%, grade D-, #216 of 667 statewide, top 33%, 1,852 students, 47% FRL) — zoned schools average 82% FRL vs 35% district-wide (47 pts higher); higher-poverty schools than district average — tighter screening recommended.
- Market conditions: Rents rising (+3.4%/yr); 610 active listings in the ZIP; solid renter incomes; 1,876 units permitted in Clay County in 2024 (14 in 5+ unit buildings).
Forward outlook
- Local home prices are declining (-3.0%/yr); year-one equity from $2k of loan paydown is wiped out by about $8k of value loss. Plan a longer hold.
- Clay County population projected at +19% by 2050 — long-run rental-demand tailwind backs the buy-and-hold thesis.
Negotiation context
- It's been on market 52 days — a 3% lower offer ($247k) is reasonable based on typical stale-listing flexibility.
- Current owner paid $20k; list at $255k implies a 1175% gain — meaningful room to come down on a strong offer.
Risks & watch-outs
- Climate carrying-cost: severe wind risk, 99% chance of damaging wind over 30y; major wildfire risk; extreme-heat days projected 7→19/yr by 2055 (HVAC capex compounding) — expect insurance premiums to compound above CPI over the hold.
Questions for the listing agent
- It's been on market 52 days. Have you received any prior offers? Is the seller open to a 23% concession, seller financing, or rate buy-down credit?
- Is there a deadline driving the sale (1031 exchange, divorce, estate, relocation)? That informs how much negotiation room exists.
- Schools are B-rated — typically a magnet for longer-tenancy family renters. What's the average tenant stay here, and is there a school-zone premium baked into asking?
- The area grade is low — what's the realistic commute time and amenity access for the typical tenant pool here? Any planned neighborhood developments (good or bad) we should know about?
- What's the average days-on-market for RENTAL listings here right now (not sales)? A rising rental-DOM trend means longer vacancies and softer asking-rent achievability than the comps imply.
- What's the recent tenant-quality profile in this submarket — average credit score on applications, eviction rate, late-payment / NSF rate, and stable-employment percentage? A property-management company in the area should have these aggregated.
- How much new for-sale + rental construction is in the pipeline within 1–3 miles? Heavy new supply typically softens prices + rents 12–24 months out; constrained supply supports both.
Investment metrics
- 1% rule
- 0.77% ✗
- Cap rate
- 6.41%
- Cash-on-cash
- 0.41%
- DSCR
- 1.02
- GRM
- 10.8
CMA / ARV
- ARV (on-the-fly)
- $247,860
- Comps found
- 6
Show comp detail 6 sales within ~0.75 mi
| Address | Dist | Beds/Ba | Sqft | Sold | Price | $/sf | Match |
|---|---|---|---|---|---|---|---|
| 5525 Squaw Ln | 0.45mi | 3/2.0 | 1,612 (-0%) | 15mo | $266,000 | $165 | 66 |
| 5394 Muscovy Rd | 0.33mi | 3/2.0 | 1,792 (+11%) | 2mo | $450,000 | $251 | 65 |
| 2009 Catherine Ln | 0.55mi | 4/2.5 (+1) | 1,560 (-4%) | 3mo | $80,000 | $51 | 59 |
| 5192 Mallard Rd | 0.30mi | 3/2.0 | 1,404 (-13%) | 8mo | $215,000 | $153 | 57 |
| 5571 Drake Loop Rd | 0.50mi | 3/2.0 | 1,758 (+8%) | 21mo | $255,000 | $145 | 44 |
| 2018 Catherine Ln | 0.60mi | 4/2.0 (+1) | 1,560 (-4%) | 21mo | $229,500 | $147 | 43 |
Match score weights: distance 35% · size 25% · config 20% · recency 20%. Top-matched comps best support the ARV.
Projected returns pro-forma
-3.0% appreciation · 3.35% rent growth · sell at horizon
- IRR
- -15.4%
- Equity multiple
- 0.45×
- Total profit
- $-39,193
- Equity at exit
- $38,021
- IRR
- -6.4%
- Equity multiple
- 0.58×
- Total profit
- $-29,738
- Equity at exit
- $22,048
Cash invested: $71,400 (down + closing). Projections, not guarantees.
Landlord ↔ Tenant lean methodology
- Overall (STATE)
- 87 Strongly Landlord-Friendly
- State Florida
- 87 Strongly Landlord-Friendly · R+3
- County
- — inherits STATE
- City
- — inherits STATE
ZIP-level market 32068
- Home prices YoY
- -27.5%
- Rents YoY
- 3.4%
- Active inventory
- 610
- Price-to-rent
- 10.8×
Monthly cashflow live
- Estimated rent
- $1,962 medium interval (Pro) →
- Mortgage (P&I)
- −$1,337
- Tax from tax record
- −$82 /mo · $983/yr
- Insurance
- −$106
- HOA
- −$0
- Vacancy / Maint / Mgmt
- −$412
- Net cashflow
- $24
Break-even live
Sensitivity live
| Price | -10% $169 | -5% $97 | +0% $24 | +5% $-48 | +10% $-120 |
|---|---|---|---|---|---|
| Rent | -10% $-131 | -5% $-53 | +0% $24 | +5% $102 | +10% $179 |
| Rate | -1.0pp $153 | -0.5pp $89 | base $24 | +0.5pp $-42 | +1.0pp $-109 |
UW: 25.0% down · 7.5% · 30yr · 1.5% tax · 5.0% vac · 8.0% maint · 8.0% mgmt
Financing live
Cash to close
- Down payment
- $63,750
- Closing costs
- $7,650
- Reserves months
- —
- Total cash needed
- —
Loan-product check · same deal, 3 products live
Conventional
25% down · 7.5% · 30yr
- Down + closing
- —
- Monthly P&I
- —
- Monthly cashflow
- —
- DSCR
- —
- Eligible?
- —
Personal DTI + credit; lowest rate.
DSCR
20% down · 8.5% · 30yr
- Down + closing
- —
- Monthly P&I
- —
- Monthly cashflow
- —
- DSCR
- —
- Eligible?
- —
No personal income docs; deal must DSCR.
Hard money
10% down · 12.0% · 12mo
- Down + closing
- —
- Monthly P&I
- —
- Monthly cashflow
- —
- DSCR
- —
- Eligible?
- —
Short-term bridge; refi at stabilization.
Listing history 16 events
-
2026-06-21days on market $255,000 Active 52 DOM
-
2026-06-18days on market $255,000 Active 49 DOM
-
2026-06-17days on market $255,000 Active 48 DOM
-
2026-06-16days on market $255,000 Active 47 DOM
-
2026-06-15days on market $255,000 Active 46 DOM
-
2026-06-13days on market $255,000 Active 44 DOM
-
2026-06-13days on market $255,000 Active 43 DOM
-
2026-06-09days on market $255,000 Active 40 DOM
-
2026-06-08pricedays on market $255,000 Active 39 DOM
-
2026-06-07days on market $279,900 Active 38 DOM
-
2026-06-03days on market $279,900 Active 34 DOM
-
2026-06-02days on market $279,900 Active 33 DOM
-
2026-06-01days on market $279,900 Active 32 DOM
-
2026-05-31days on market $279,900 Active 31 DOM
-
2026-04-30$279,900 Active
-
1995-05-19soldstatus $20,000
ⓘ Source: listings_history table (triggers on properties + properties_extension) + one-shot
backfill from property_details.listing_events for pre-trigger history.
Tax reassessment forecast FL · Resets to sale price
- Current annual tax
- $983 · $82/mo
- Projected year-2 tax
- $2,116 · $176/mo
- Expected delta
- +$1,133/yr (+$94/mo · 115.3%)
ⓘ Screening estimate from a state-policy table — verify with the county assessor before closing.
Climate risk First Street
- Flood 1/10 Low FEMA zone X (unshaded) · 0% chance over 30 yrs
- Wildfire 7/10 Severe
- Heat 8/10 Severe 7 d/yr ≥109°F today · 19 d/yr by 30 yrs out
- Wind 9/10 Extreme 99% chance of damaging wind over 30 yrs
- Air quality 2/10 Low 2 unhealthy d/yr today · 2 by 30 yrs out
Nearby sold comps map
Loading sold comps map…
Walkable amenities ~0.75 mi
Loading nearby amenities…
Taxation est. · year 1
- Rental income
- $23,541
- − Mortgage interest
- −$14,284
- − Property taxes
- −$983
- − Insurance
- −$1,275
- − Repairs & maintenance
- −$1,883
- − Management
- −$1,883
- − Depreciation
- −$7,418
- Taxable loss
- −$4,186
- Est. tax savings @ 24.0%
- +$1,005
- After-tax cash flow
- $1,297/yr
For passive investors: Depreciation is non-cash, so a rental often shows a tax loss while cash-flowing — sheltering income. Rental losses are passive: they offset passive income freely, and up to $25,000/yr can offset ordinary (W-2) income if you actively participate and your MAGI is under $100k (phasing out to $0 by $150k); unused losses carry forward. On sale, claimed depreciation is recaptured at up to 25%, and gains may owe capital-gains tax (a 1031 exchange can defer both). Figures are a year-1 estimate at your 24.0% rate — not tax advice; consult a CPA.
Schools (NCES district)
- District
- Clay
- NCES district ID
- 1200300
- Math proficiency
- 58% ▼ -8.00%
- Reading proficiency
- 59% ▼ -3.00%
- Median HH income
- $59,379
- Composite
- 50.73/100
- National rank
- #1815
- State rank
- #14 of 73 in FL
Livability — Middleburg
- Score
- 65/100
- State rank
- #657
- US rank
- #13174
Category grades
Schools grade is shown separately in the Schools card above.
Census & demographics
- County
- Clay County · 208,450 people
- City population
- 58,983
- Metro
- Jacksonville, FL
- Population (ZIP)
- 58,983
- Household income
- $84,431
- Rent vs Own
- Severe rent burden
- 975.0
Population outlook (Clay County) Hauer SSP2
- Today (2025)
- 230,495 people
- By 2030
- 242,427 · +5.2%
- By 2040
- 262,244 · +13.8%
- By 2050
- 275,148 · +19.4%
- By 2075
- 295,397 · +28.2%
- By 2100
- 287,592 · +24.8%
Race, ethnicity, and origin ACS 2023
- Neighborhood character
- Predominantly White (74%)
- Race & ethnicity
- White 74% Hispanic / Latino 13% Two or more races 10% Black 7%
- Hispanic origin (detail)
- Mexican 2% Puerto Rican 5%
- Common ancestry
- Slovak 2% Romanian 2% Lithuanian 2%
- Foreign-born
- 7% · Canada, Jamaica
- Languages at home
- 87% English-only · Spanish 9% Arabic 1% German/W. Germanic 1%
Political lean MEDSL · Clay
- 2024 margin
- Solid R (+39.3) · D 29.9% · R 69.2%
- 2008→2024 swing
- +3.6pp toward D · 2008: -42.8pp · 2024: -39.3pp
- All cycles
- 2024: R+39.3 2020: R+37.1 2016: R+44.3 2012: R+45.8 2008: R+42.8
Not yet ingested
- Civics
- —
Market trends
- HPI YoY
- ▼ -115.99%
- Current HPI
- 305.2531
- Rent YoY
- ▲ 3.35%
- Metro
- Jacksonville, FL
- State GDP YoY
- ▲ 3.28%
- F500 in state
- 36
Industry mix (Fortune 500 HQ in FL)
| Industry | F500 HQs | Revenue |
|---|---|---|
| Industrial Technology | 2 | $29B |
|
||
| Insurance | 2 | $17B |
|
||
| Retail | 1 | $60B |
|
||
| Technology Distribution | 1 | $58B |
|
||
| Homebuilding | 1 | $35B |
|
||
| Technology Manufacturing | 1 | $35B |
|
||
Price history
+1299.5% since first listed2 events — show timeline
- 2026-04-30 Listed $279,900 Stellar MLS as Distributed by MLS Grid
- 1995-05-19 Sold (Public Records) $20,000 Public Records
Property tax history
+2.1%/yrLatest (2025): $983 · -3.4% YoY. Source: county tax records.
Cash-flow waterfall
monthlySold comps — $/sqft
last 12 mo · ≤1 miLoading sold comps…