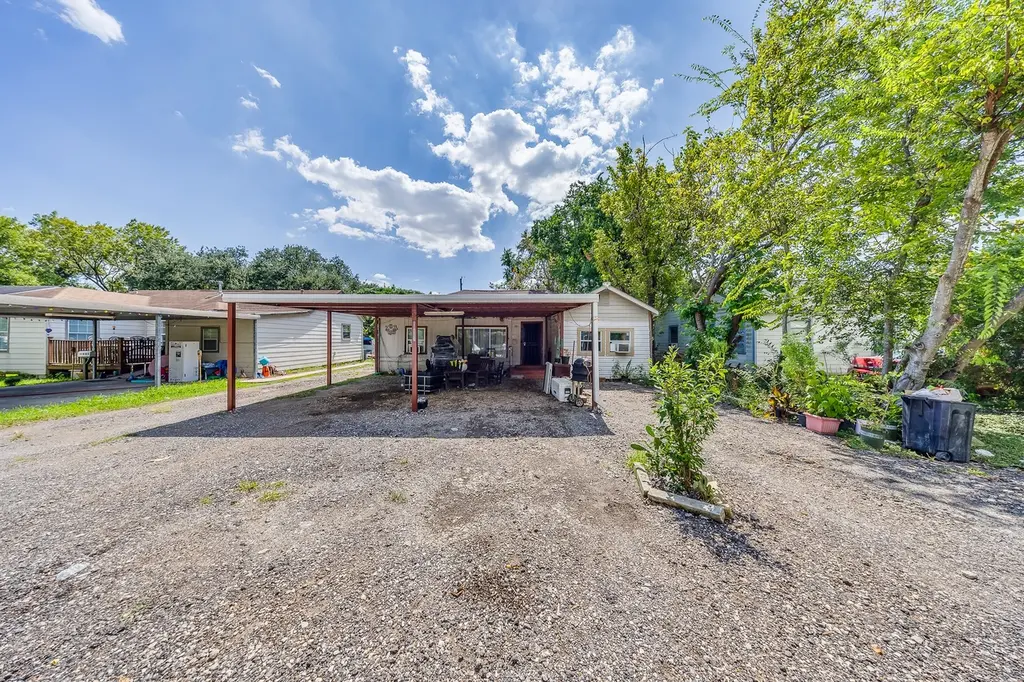
11002 La Crosse St · Jacinto City, TX
Flood risk 5/10 · Moderate
- FEMA flood zone
- X (unshaded)
- Chance of flooding over 30 yrs
- 0.44%
- Est. flood insurance / yr
- $507 – $1,088
Fire risk 3/10 · Minor
- Est. fire insurance / yr
- $1,222 – $2,270
Heat risk 9/10 · Severe
- Hot days now (above 109°F)
- 7 days/yr
- Hot days in 30 yrs
- 24 days/yr
Wind risk 9/10 · Severe
- Chance of severe wind over 30 yrs
- 99.0%
Air-quality risk 2/10 · Minimal
- Unhealthy air days now
- 2 days/yr
- Unhealthy air days in 30 yrs
- 2 days/yr
Risk factors via First Street. Map © Google.
Why this score? — see what drove the C grade
The composite is a weighted blend of 9 inputs, each scored 0–100. Each bar is that input's sub-score; the figure is the points it added to the 100-point composite (weight × sub-score).
- ARV discount +15.0/15.0
- Cash flow +14.0/30.0
- Appreciation +10.0/10.0
- 1% rule +4.3/10.0
- DSCR +4.2/10.0
- Livability +3.5/5.0
- Schools +2.7/10.0
- Rent growth +2.5/5.0
- Condition / age +2.5/5.0
$140,000
🖨 Deal sheet 📄 Offer letter ✓ Due diligence
Listing remarks MLS
Charming single-story home located on a quiet street in Houston’s east side. This property features a traditional layout with a spacious front yard, mature trees for shade, and plenty of potential for customization. Conveniently situated near major freeways, shopping, and schools, the home offers a great opportunity for investors or buyers looking to add personal touches. With easy access to I-10 and Loop 610, commuting around the city is simple.
Key facts
- Spacious front yard
- Single-story home
- Easy access to i-10
Tags
Neighborhood map
What this means for you Summary
Snapshot
- This is a 3-bed/1.0-bath single-family listed at $140k.
Deal economics
- At list price, monthly cash flow is $17 ($209/yr) — positive.
- The deal already cash-flows at list — no discount required.
- To meet the 1% rule (rent ≥ 1% of price), the offer needs to be $130k (6.8% below list).
- Recommended offer: $123k (12.0% below list) — sets the bar for market timing.
Location & tenants
- Location reads 70/100 on livability (#384 in TX) — a middle-class / working-renter tenant base. Strengths: cost of living A+, housing A+, health & safety A-; Watch: schools F, amenities F, commute F.
- Houston ISD (urban): math 27% / reading 35% proficiency, ranked #593 of 826 in TX (top 72%) — families likely to look elsewhere, expect single-tenant / working-renter base with shorter leases; 71% free/reduced lunch — lower-income household profile, screen leases tightly.
- Market conditions: 153 active listings in the ZIP; 19 comparable units currently listed for rent nearby; rentals at typical pace (median 19d on market — plan ~3-4 weeks tenant-placement turnaround); 29,883 units permitted in Harris County in 2024 (8,621 in 5+ unit buildings).
- This rent runs 32% of the median local income ($48k/yr) — at the standard rent-burdened threshold; future hikes will face affordability resistance.
Forward outlook
- In year one you build about $15k of equity ($968 loan paydown + $14k appreciation (10.0% local appreciation)).
- Harris County population projected at +47% by 2050 — long-run rental-demand tailwind backs the buy-and-hold thesis.
- At projected returns (10.0% appreciation + 3.0% rent growth), your $39k cash investment doubles in ~3 years — after that, you're playing with house money.
- By year 3, paydown + projected appreciation supports a ~$38k cash-out refi (75% LTV) — recoverable capital for the next deal without selling this one.
Negotiation context
- It's been on market 172 days — a 12% lower offer ($123k) is reasonable based on typical stale-listing flexibility.
- 2 sale attempts with the ask held roughly flat each time — persistent listings suggest the price (not the market) is what's stuck; bring a comps-based counter.
Risks & watch-outs
- Watch-outs: built in 1945 — expect roof / HVAC / electrical / plumbing capex.
- Climate carrying-cost: moderate flood risk; severe wind risk, 99% chance of damaging wind over 30y; extreme-heat days projected 7→24/yr by 2055 (HVAC capex compounding) — expect insurance premiums to compound above CPI over the hold.
Questions for the listing agent
- It's been on market 172 days. Have you received any prior offers? Is the seller open to a 12% concession, seller financing, or rate buy-down credit?
- Built in 1945 — when were the roof, HVAC, electrical panel, plumbing, and water heater last replaced?
- Why hasn't it sold? Are there any deal-killer items the seller is aware of (foundation, flood, title, zoning, code violations)?
- Is there a deadline driving the sale (1031 exchange, divorce, estate, relocation)? That informs how much negotiation room exists.
- Schools are F-rated, which usually means shorter tenancies and higher turnover. Who's the typical renter profile here, and what's been the actual vacancy rate?
- What's the average days-on-market for RENTAL listings here right now (not sales)? A rising rental-DOM trend means longer vacancies and softer asking-rent achievability than the comps imply.
- What's the recent tenant-quality profile in this submarket — average credit score on applications, eviction rate, late-payment / NSF rate, and stable-employment percentage? A property-management company in the area should have these aggregated.
- How much new for-sale + rental construction is in the pipeline within 1–3 miles? Heavy new supply typically softens prices + rents 12–24 months out; constrained supply supports both.
Investment metrics
- 1% rule
- 0.93% ✗
- Cap rate
- 6.44%
- Cash-on-cash
- 0.53%
- DSCR
- 1.02
- GRM
- 8.9
CMA / ARV
- ARV (median comp)
- $191,292
- List price
- $140,000
- Delta
- -26.81%
- Verdict
- UNDERPRICED
- Comps
- 15 within 1.0 mi
Show comp detail 12 sales within ~0.75 mi
| Address | Dist | Beds/Ba | Sqft | Sold | Price | $/sf | Match |
|---|---|---|---|---|---|---|---|
| 11201 Muscatine St | 0.17mi | 3/1.0 | 1,066 (-14%) | 2mo | $129,900 | $122 | 67 |
| 10514 Palestine St | 0.56mi | 3/2.0 | 1,235 (-0%) | 5mo | $237,500 | $192 | 65 |
| 10418 S Oswego St | 0.60mi | 3/2.0 | 1,256 (+1%) | 2mo | $205,000 | $163 | 64 |
| 631 Soft Shadows Ln | 0.41mi | 3/2.0 | 1,328 (+7%) | 9mo | $196,000 | $148 | 58 |
| 11518 Munn St | 0.65mi | 3/1.0 | 1,288 (+4%) | 7mo | $205,000 | $159 | 57 |
| 519 Westshire Dr | 0.70mi | 3/1.5 | 1,146 (-8%) | 2mo | $169,000 | $147 | 51 |
| 10701 Pillot St | 0.57mi | 3/1.0 | 1,098 (-12%) | 5mo | $130,000 | $118 | 50 |
| 11020 Munn St | 0.56mi | 3/1.5 | 1,373 (+11%) | 5mo | $310,000 | $226 | 50 |
| 1622 Jennifer Ln | 0.71mi | 3/1.0 | 1,121 (-10%) | 8mo | $163,000 | $145 | 44 |
| 11510 Tilia St | 0.62mi | 3/1.0 | 1,404 (+13%) | 7mo | $90,000 | $64 | 44 |
| 10418 Burman St | 0.71mi | 3/2.0 | 1,379 (+11%) | 1mo | $175,000 | $127 | 43 |
| 11509 Lord St | 0.73mi | 3/1.0 | 1,077 (-13%) | 4mo | $119,000 | $110 | 41 |
Match score weights: distance 35% · size 25% · config 20% · recency 20%. Top-matched comps best support the ARV.
Projected returns pro-forma
10.0% appreciation · 3.0% rent growth · sell at horizon
- IRR
- 24.7%
- Equity multiple
- 2.97×
- Total profit
- $77,405
- Equity at exit
- $126,123
- IRR
- 21.8%
- Equity multiple
- 6.80×
- Total profit
- $227,167
- Equity at exit
- $271,989
Cash invested: $39,200 (down + closing). Projections, not guarantees.
Landlord ↔ Tenant lean methodology
- Overall (STATE)
- 87 Strongly Landlord-Friendly
- State Texas
- 87 Strongly Landlord-Friendly · R+5
- County
- — inherits STATE
- City
- — inherits STATE
ZIP-level market 77029
- Home prices YoY
- 7.2%
- Active inventory
- 153
- Price-to-rent
- 8.9×
Monthly cashflow live
- Estimated rent
- $1,304 high interval (Pro) →
- Mortgage (P&I)
- −$734
- Tax from tax record
- −$220 /mo · $2,645/yr
- Insurance
- −$58
- HOA
- −$0
- Vacancy / Maint / Mgmt
- −$274
- Net cashflow
- $17
Break-even live
UW: 25.0% down · 7.5% · 30yr · 1.5% tax · 5.0% vac · 8.0% maint · 8.0% mgmt
Financing live
Cash to close
- Down payment
- $35,000
- Closing costs
- $4,200
- Reserves months
- —
- Total cash needed
- —
Loan-product check · same deal, 3 products live
Conventional
25% down · 7.5% · 30yr
- Down + closing
- —
- Monthly P&I
- —
- Monthly cashflow
- —
- DSCR
- —
- Eligible?
- —
Personal DTI + credit; lowest rate.
DSCR
20% down · 8.5% · 30yr
- Down + closing
- —
- Monthly P&I
- —
- Monthly cashflow
- —
- DSCR
- —
- Eligible?
- —
No personal income docs; deal must DSCR.
Hard money
10% down · 12.0% · 12mo
- Down + closing
- —
- Monthly P&I
- —
- Monthly cashflow
- —
- DSCR
- —
- Eligible?
- —
Short-term bridge; refi at stabilization.
Rent comps 19 comps
| Address | Beds | Baths | Sqft | Rent | $/sqft | DOM | Units | Dist |
|---|---|---|---|---|---|---|---|---|
| 768 Coolwood Dr Houston, TX | 2.0 | 1.0 | 1102 | $1,295 | $1.18 | 44d | 1 | 0.73mi |
| 778 Coolwood Dr Houston, TX | 2.0 | 1.0 | 1000 | $1,295 | $1.29 | 44d | 1 | 0.76mi |
| 12200 Fleming Dr Houston, TX | 1.0–3.0 | 1.0–2.0 | 842 | $1,265 | $1.50 | 2d | 25 | 0.78mi |
| 12006 Fleming Dr Houston, TX | 2.0 | 1.0 | 816 | $1,025 | $1.26 | 24d | 1 | 0.79mi |
| 734 Coolwood Dr Houston, TX | 2.0 | 1.5 | 1000 | $1,295 | $1.29 | 44d | 1 | 0.80mi |
| 10208 Challenger 7 Dr Jacinto City, TX | 2.0 | 1.0 | 900 | $1,190 | $1.32 | 44d | 1 | 0.87mi |
| 12221 Fleming Dr Houston, TX | 1.0–3.0 | 1.0–1.5 | 827 | $1,089 | $1.32 | 19d | 19 | 0.91mi |
| 10202 Challenger 7 Dr Unit 10259 Jacinto City, TX | 2.0 | 2.0 | 900 | $1,107 | $1.23 | 3d | 1 | 0.91mi |
| 10202 Challenger 7 Dr Unit 424 Jacinto City, TX | 2.0 | 2.0 | 900 | $1,115 | $1.24 | 5d | 1 | 0.91mi |
| 10202 Challenger 7 Dr Unit 422 Jacinto City, TX | 2.0 | 2.0 | 900 | $1,115 | $1.24 | 8d | 1 | 0.91mi |
| 10202 Challenger 7 Dr Unit 2047 Jacinto City, TX | 2.0 | 2.0 | 900 | $1,150 | $1.28 | 11d | 1 | 0.91mi |
| 676 Maxey Rd Houston, TX | 2.0 | 1.0 | 968 | $1,060 | $1.10 | 19d | 1 | 1.03mi |
| 676 Maxey Rd Houston, TX | 2.0 | 1.0 | 968 | $1,060 | $1.10 | 22d | 1 | 1.03mi |
| 670 Maxey Rd Houston, TX | 1.0–3.0 | 1.0–2.0 | 936 | $1,380 | $1.47 | 8d | 15 | 1.04mi |
| 664 Maxey Rd Houston, TX | 1.0–2.0 | 1.0 | 783 | $1,150 | $1.47 | 8d | 37 | 1.12mi |
| 9701 Market St Houston, TX | 1.0–2.0 | 1.0 | 798 | $1,309 | $1.64 | 8d | 1 | 1.34mi |
| 9907 Lanewell St Unit a Houston, TX | 3.0 | 2.0 | 872 | $1,154 | $1.32 | 22d | 1 | 1.35mi |
| 513 Woodhurst St Houston, TX | 2.0 | 2.0 | 837 | $1,019 | $1.22 | 24d | 1 | 1.37mi |
| 470 Maxey Rd Houston, TX | 1.0–2.0 | 1.0–2.0 | 682 | $965 | $1.41 | 3d | 26 | 1.43mi |
Listing history 11 events
-
2026-06-10days on market $140,000 Active 172 DOM
-
2026-06-08days on market $140,000 Active 171 DOM
-
2026-06-07days on market $140,000 Active 170 DOM
-
2026-06-04days on market $140,000 Active 167 DOM
-
2026-06-01days on market $140,000 Active 164 DOM
-
2026-05-31days on market $140,000 Active 163 DOM
-
2025-12-19historical
Show marketing remark (456 chars)
Charming single-story home located on a quiet street in Houston’s east side. This property features a traditional layout with a spacious front yard, mature trees for shade, and plenty of potential for customization. Conveniently situated near major freeways, shopping, and schools, the home offers a great opportunity for investors or buyers looking to add personal touches. With easy access to I-10 and Loop 610, commuting around the city is simple.
-
2025-12-19$140,000 Active 456-char remark
Show marketing remark (456 chars)
Charming single-story home located on a quiet street in Houston’s east side. This property features a traditional layout with a spacious front yard, mature trees for shade, and plenty of potential for customization. Conveniently situated near major freeways, shopping, and schools, the home offers a great opportunity for investors or buyers looking to add personal touches. With easy access to I-10 and Loop 610, commuting around the city is simple.
-
2025-10-06$140,000 Active
-
2024-05-09soldstatus
-
1988-01-03soldstatus
ⓘ Source: listings_history table (triggers on properties + properties_extension) + one-shot
backfill from property_details.listing_events for pre-trigger history.
Tax reassessment forecast TX · Resets to sale price
- Current annual tax
- $2,645 · $220/mo
- Projected year-2 tax
- $2,645 · $220/mo
- Expected delta
- $0/yr ($0/mo · 0.0%)
ⓘ Screening estimate from a state-policy table — verify with the county assessor before closing.
Climate risk First Street
- Flood 5/10 Major FEMA zone X (unshaded) · 44% chance over 30 yrs
- Wildfire 3/10 Moderate
- Heat 9/10 Extreme 7 d/yr ≥109°F today · 24 d/yr by 30 yrs out
- Wind 9/10 Extreme 99% chance of damaging wind over 30 yrs
- Air quality 2/10 Low 2 unhealthy d/yr today · 2 by 30 yrs out
Nearby sold comps map
Loading sold comps map…
Walkable amenities ~0.75 mi
Loading nearby amenities…
Taxation est. · year 1
- Rental income
- $15,651
- − Mortgage interest
- −$7,842
- − Property taxes
- −$2,645
- − Insurance
- −$700
- − Repairs & maintenance
- −$1,252
- − Management
- −$1,252
- − Depreciation
- −$4,073
- Taxable loss
- −$2,113
- Est. tax savings @ 24.0%
- +$507
- After-tax cash flow
- $716/yr
For passive investors: Depreciation is non-cash, so a rental often shows a tax loss while cash-flowing — sheltering income. Rental losses are passive: they offset passive income freely, and up to $25,000/yr can offset ordinary (W-2) income if you actively participate and your MAGI is under $100k (phasing out to $0 by $150k); unused losses carry forward. On sale, claimed depreciation is recaptured at up to 25%, and gains may owe capital-gains tax (a 1031 exchange can defer both). Figures are a year-1 estimate at your 24.0% rate — not tax advice; consult a CPA.
Schools (NCES district)
- District
- Houston ISD
- NCES district ID
- 4823640
- Math proficiency
- 27% ▼ -18.00%
- Reading proficiency
- 35% ▼ -6.00%
- Median HH income
- $46,054
- Composite
- 26.63/100
- National rank
- #7173
- State rank
- #593 of 826 in TX
Livability — Jacinto City
- Score
- 70/100
- State rank
- #384
- US rank
- #8027
Category grades
Schools grade is shown separately in the Schools card above.
Census & demographics
- Census place
- Jacinto City, TX
- County
- Harris County · 4,702,590 people
- City population
- 16,154
- Metro
- Houston-The Woodlands-Sugar Land, TX
- Population (ZIP)
- 16,154
- Household income
- $48,279
- Rent vs Own
- Severe rent burden
- 457.0
Population outlook (Harris County) Hauer SSP2
- Today (2025)
- 5,571,493 people
- By 2030
- 6,089,821 · +9.3%
- By 2040
- 7,142,806 · +28.2%
- By 2050
- 8,185,864 · +46.9%
- By 2075
- 10,574,329 · +89.8%
- By 2100
- 12,109,958 · +117.4%
Race, ethnicity, and origin ACS 2023
- Neighborhood character
- Predominantly Hispanic (72%)
- Race & ethnicity
- Hispanic / Latino 72% Two or more races 32% Black 22% White 5%
- Hispanic origin (detail)
- Mexican 66%
- Foreign-born
- 31% · Canada
- Languages at home
- 39% English-only · Spanish 61%
Political lean MEDSL · Harris
- 2024 margin
- Lean D (+5.5) · D 52.0% · R 46.4% · Other 1.6%
- 2008→2024 swing
- +3.9pp toward D · 2008: 1.6pp · 2024: 5.5pp
- All cycles
- 2024: D+5.5 2020: D+13.3 2016: D+12.4 2012: D+0.1 2008: D+1.6
Not yet ingested
- Civics
- —
Market trends
- HPI YoY
- ▲ 18.53%
- Current HPI
- 276.1811
- Rent YoY
- —
- Metro
- Houston-The Woodlands-Sugar Land, TX
- State GDP YoY
- ▲ 3.95%
- F500 in state
- 110
Industry mix (Fortune 500 HQ in TX)
| Industry | F500 HQs | Revenue |
|---|---|---|
| Energy | 16 | $1,198B |
|
||
| Technology | 5 | $198B |
|
||
| Engineering / Construction | 4 | $72B |
|
||
| Energy Services | 3 | $60B |
|
||
| Utilities | 3 | $41B |
|
||
| Healthcare | 2 | $330B |
|
||
Price history
+0.0% since first listed5 events — show timeline
- 2025-12-19 Listed $140,000 HARMLS
- 2025-12-19 Listing Removed — HARMLS
- 2025-10-06 Listed $140,000 HARMLS
- 2024-05-09 Sold (Public Records) — Public Records
- 1988-01-03 Sold (Public Records) — Public Records
Property tax history
+4.4%/yrLatest (2025): $2,645 · +1.5% YoY. Source: county tax records.
Cash-flow waterfall
monthlySold comps — $/sqft
last 12 mo · ≤1 miLoading sold comps…