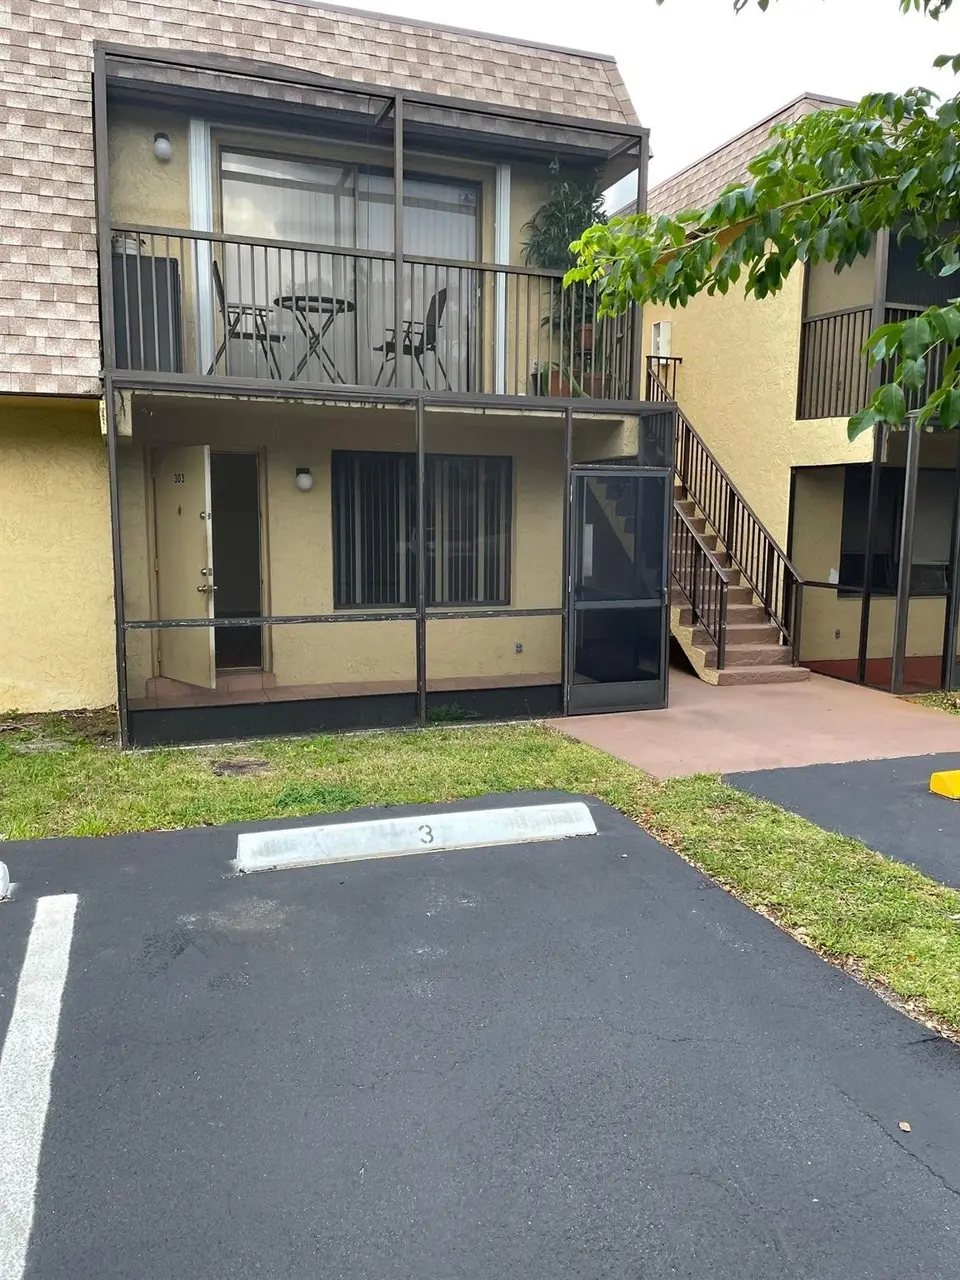
1245 S Flagler Ave S #303 · Pompano Beach, FL
Flood risk 4/10 · Minor
- FEMA flood zone
- X (shaded)
- Chance of flooding over 30 yrs
- 0.22%
- Est. flood insurance / yr
- $507 – $1,088
Fire risk 1/10 · Minimal
- Est. fire insurance / yr
- $947 – $1,759
Heat risk 10/10 · Severe
- Hot days now (above 106°F)
- 7 days/yr
- Hot days in 30 yrs
- 26 days/yr
Wind risk 10/10 · Severe
- Chance of severe wind over 30 yrs
- 99.0%
Air-quality risk 2/10 · Minimal
- Unhealthy air days now
- 1 days/yr
- Unhealthy air days in 30 yrs
- 2 days/yr
Risk factors via First Street. Map © Google.
Why this score? — see what drove the C grade
The composite is a weighted blend of 9 inputs, each scored 0–100. Each bar is that input's sub-score; the figure is the points it added to the 100-point composite (weight × sub-score).
- Cash flow +19.7/30.0
- 1% rule +9.1/10.0
- ARV discount +7.5/15.0
- DSCR +6.2/10.0
- Schools +4.1/10.0
- Livability +3.7/5.0
- Rent growth +3.0/5.0
- Condition / age +2.5/5.0
- Appreciation +0.0/10.0
$174,900
🖨 Deal sheet (PDF) 📄 Offer letter ✓ Due diligence
Listing remarks
Welcome to 1245 S Flagler Ave, a great investment either you will live in it or rent it out right away! This delightful 2-bedroom, 2-bathroom unit boasts a clean, comfortable floorplan with laminate wood flooring in the living areas. Both bedrooms feature tile flooring and generous walk-in closets, while each bathroom offers a convenient tub/shower combination. Enjoy the luxury of your own private laundry, and unwind on the relaxing screened porch. The community amenities include a refreshing pool perfect for the Florida sunshine. Conveniently located near shopping, dining, and beautiful beaches, this home is everything you've been looking for!
Key facts
- $465 HOA
- Parking
- Community pool
Property features AI
Finance
- Other: Pets allowed with breed restrictions
- HOA & community: Townhouse Village association; Monthly HOA fee; Community pool; HOA covers trash, water and common areas
Exterior
- Parking: Assigned parking; Guest parking (1 open space)
- Utilities: Public water; Public sewer; Electricity connected; Cable available
- Home design: Condominium; 2-story building; First floor entry; Faces north; Resale condition
- Construction: Built with CBS construction; Flat and mansard roof
- Exterior features: Screened patio; Patio
Interior
- Kitchen: Dishwasher; Electric range; Refrigerator; Disposal; Electric water heater
- Bedrooms: 2 bedrooms on the main level
- Flooring: Ceramic tile; Laminate
- Bathrooms: 2 full bathrooms on the main level
- Heating & cooling: Central heating (electric); Central air conditioning (electric)
- Interior features: Walk-in closets; Stacked bedroom layout
- Laundry & utility: Laundry in common area
Neighborhood map
What this means for you Summary
Snapshot
- This is a 2-bed/2.0-bath condo listed at $175k.
Deal economics
- At list price, monthly cash flow is $205 ($2k/yr) — positive.
- The deal already cash-flows at list — no discount required.
- Meets the 1% rule at list price ($2k rent vs $175k).
- Recommended offer: $172k (1.5% below list) — sets the bar for market timing.
- Cap rate 7.7% vs local median 3.1% in Pompano Beach — top-decile yield for the area; either an underpriced asset or a hidden risk that comps aren't pricing in. Stress-test before assuming the spread holds.
Location & tenants
- Location reads 74/100 on livability (#284 in FL, #4,541 nationally) — a middle-class / working-renter tenant base. Strengths: commute A+, housing A+, cost of living B+; Watch: employment D+, amenities F.
- Broward (suburban): math 42% / reading 53% proficiency, ranked #46 of 73 in FL (top 63%) — families likely to look elsewhere, expect single-tenant / working-renter base with shorter leases.
- Zoned schools: Mcnab Elementary School (math 51% / reading 63%, grade C+, #781 of 2,144 statewide, top 38%, 614 students, 56% FRL); Pompano Beach Middle School (math 29% / reading 40%, grade F, #421 of 571 statewide, top 74%, 1,040 students, 73% FRL); Blanche Ely High School (math 7% / reading 29%, grade F, #570 of 667 statewide, top 86%, 1,906 students, 75% FRL) — zoned schools average 68% FRL vs 51% district-wide (17 pts higher); higher-poverty schools than district average — tighter screening recommended.
- Market conditions: Rents rising (+2.1%/yr); 339 active listings in the ZIP; 39 comparable units currently listed for rent nearby; rentals at typical pace (median 26d on market — plan ~3-4 weeks tenant-placement turnaround); 2,111 units permitted in Broward County in 2024 (1,265 in 5+ unit buildings).
- At $2,469/mo this rent would consume 46% of the median local household income ($65k/yr) (locally 2870% of renters already pay >50% of income on rent) — very limited rent-growth headroom before tenants either downsize or default.
Forward outlook
- Local home prices are declining (-3.0%/yr); year-one equity from $1k of loan paydown is wiped out by about $5k of value loss. Plan a longer hold.
- Broward County population projected at +34% by 2050 — long-run rental-demand tailwind backs the buy-and-hold thesis.
Negotiation context
- It's been on market 17 days — a 2% lower offer ($172k) is reasonable based on typical stale-listing flexibility.
- 4 sale attempts since 12y ago with the ask held roughly flat each time — persistent listings suggest the price (not the market) is what's stuck; bring a comps-based counter.
- Current owner paid $100k; list at $175k implies a 75% gain — meaningful room to come down on a strong offer.
Risks & watch-outs
- Climate carrying-cost: severe wind risk, 99% chance of damaging wind over 30y; extreme-heat days projected 7→26/yr by 2055 (HVAC capex compounding) — expect insurance premiums to compound above CPI over the hold.
Questions for the listing agent
- What does the HOA fee cover, when was the last increase, and are there any pending special assessments or reserve-fund shortfalls?
- Any open or pending special assessments — roof, HVAC, plumbing, elevator, façade? What's the per-unit balance and payoff schedule, and is the seller paying it off at close or rolling it to the buyer?
- Is there a deadline driving the sale (1031 exchange, divorce, estate, relocation)? That informs how much negotiation room exists.
- Schools are D-rated, which usually means shorter tenancies and higher turnover. Who's the typical renter profile here, and what's been the actual vacancy rate?
- What's the average days-on-market for RENTAL listings here right now (not sales)? A rising rental-DOM trend means longer vacancies and softer asking-rent achievability than the comps imply.
- What's the recent tenant-quality profile in this submarket — average credit score on applications, eviction rate, late-payment / NSF rate, and stable-employment percentage? A property-management company in the area should have these aggregated.
- How much new apartment / multifamily construction is in the pipeline within 1–3 miles? Heavy new supply (>2% of stock underway) typically softens rents 12–24 months out; light construction supports rent growth.
Investment metrics
- 1% rule
- 1.41% ✓
- Cap rate
- 7.70%
- Cash-on-cash
- 5.02%
- DSCR
- 1.22
- GRM
- 5.9
CMA / ARV
No comps found within radius.
Projected returns pro-forma
-3.0% appreciation · 2.12% rent growth · sell at horizon
- IRR
- -9.6%
- Equity multiple
- 0.65×
- Total profit
- $-17,095
- Equity at exit
- $26,078
- IRR
- -1.7%
- Equity multiple
- 0.89×
- Total profit
- $-5,331
- Equity at exit
- $15,122
Cash invested: $48,972 (down + closing). Projections, not guarantees.
Landlord ↔ Tenant lean methodology
- Overall (STATE)
- 87 Strongly Landlord-Friendly
- State Florida
- 87 Strongly Landlord-Friendly · R+3
- County
- — inherits STATE
- City
- — inherits STATE
ZIP-level market 33060
- Home prices YoY
- -23.6%
- Rents YoY
- 2.1%
- Active inventory
- 339
- Price-to-rent
- 5.9×
Monthly cashflow live
- Estimated rent
- $2,469 high interval (Pro) →
- Mortgage (P&I)
- −$917
- Tax from tax record
- −$290 /mo · $3,484/yr
- Insurance
- −$73
- HOA
- −$465
- Vacancy / Maint / Mgmt
- −$518
- Net cashflow
- $205
Break-even live
Sensitivity live
| Price | -10% $304 | -5% $254 | +0% $205 | +5% $155 | +10% $106 |
|---|---|---|---|---|---|
| Rent | -10% $10 | -5% $107 | +0% $205 | +5% $302 | +10% $400 |
| Rate | -1.0pp $293 | -0.5pp $249 | base $205 | +0.5pp $160 | +1.0pp $113 |
UW: 25.0% down · 7.5% · 30yr · 1.5% tax · 5.0% vac · 8.0% maint · 8.0% mgmt
Financing live
Cash to close
- Down payment
- $43,725
- Closing costs
- $5,247
- Reserves months
- —
- Total cash needed
- —
Loan-product check · same deal, 3 products live
Conventional
25% down · 7.5% · 30yr
- Down + closing
- —
- Monthly P&I
- —
- Monthly cashflow
- —
- DSCR
- —
- Eligible?
- —
Personal DTI + credit; lowest rate.
DSCR
20% down · 8.5% · 30yr
- Down + closing
- —
- Monthly P&I
- —
- Monthly cashflow
- —
- DSCR
- —
- Eligible?
- —
No personal income docs; deal must DSCR.
Hard money
10% down · 12.0% · 12mo
- Down + closing
- —
- Monthly P&I
- —
- Monthly cashflow
- —
- DSCR
- —
- Eligible?
- —
Short-term bridge; refi at stabilization.
Rent comps 39 comps
| Address | Beds | Baths | Sqft | Rent | $/sqft | DOM | Units | Dist |
|---|---|---|---|---|---|---|---|---|
| 1156 SW 4th Ave Pompano Beach, FL | 2.0 | 1.0 | 945 | $3,300 | $3.49 | 7d | 1 | 0.12mi |
| 160 SE 12th St Pompano Beach, FL | 2.0 | 2.0 | 950 | $5,390 | $5.67 | 26d | 1 | 0.57mi |
| 147 SW 3rd St Pompano Beach, FL | 2.0 | 1.5 | 1040 | $2,500 | $2.40 | 9d | 1 | 0.94mi |
| 55 SW 3rd St Pompano Beach, FL | 2.0 | 1.0 | 1040 | $2,500 | $2.40 | 26d | 1 | 0.98mi |
| 500 SW 2nd Ct Pompano Beach, FL | 1.0 | 1.0 | 650 | $1,595 | $2.45 | 26d | 1 | 0.99mi |
| 81 SW 3rd St Unit 81 Pompano Beach, FL | 2.0 | 1.5 | 1040 | $2,100 | $2.02 | 26d | 1 | 1.02mi |
| 13 SW 3rd St #13 Pompano Beach, FL | 2.0 | 1.5 | 1040 | $2,400 | $2.31 | 26d | 1 | 1.03mi |
| 450 SW 2nd St Unit 518-7 Pompano Beach, FL | 2.0 | 1.0 | 800 | $1,750 | $2.19 | 26d | 1 | 1.04mi |
| 253 S Cypress Rd #214 Pompano Beach, FL | 1.0 | 1.0 | 678 | $1,450 | $2.14 | 26d | 1 | 1.05mi |
| 280 S Cypress Rd #310 Pompano Beach, FL | 1.0 | 1.0 | 650 | $1,700 | $2.62 | 26d | 1 | 1.05mi |
| 270 S Cypress Rd #204 Pompano Beach, FL | 1.0 | 1.5 | 650 | $1,650 | $2.54 | 13d | 1 | 1.06mi |
| 270 S Cypress Rd #204 Pompano Beach, FL | 1.0 | 1.5 | 650 | $1,600 | $2.46 | 13d | 1 | 1.06mi |
| 6500 N Andrews Ave Fort Lauderdale, FL | 2.0 | 1.0–2.0 | 943 | $3,137 | $3.33 | 0d | 31 | 1.07mi |
| 260 S Cypress Rd #108 Pompano Beach, FL | 2.0 | 2.0 | 850 | $1,900 | $2.24 | 16d | 1 | 1.08mi |
| 540 NE 59th Ct Fort Lauderdale, FL | 3.0 | 2.0 | 964 | $3,400 | $3.53 | 26d | 1 | 1.10mi |
| 313 SW 1st Ct Unit L4 Pompano Beach, FL | 2.0 | 2.0 | 855 | $2,300 | $2.69 | 5d | 1 | 1.14mi |
| 313 SW 1st Ct Unit L4 Pompano Beach, FL | 2.0 | 2.0 | 855 | $2,500 | $2.92 | 6d | 1 | 1.14mi |
| 320 SW 1st St Pompano Beach, FL | 2.0 | 2.0 | 870 | $1,850 | $2.13 | 26d | 1 | 1.16mi |
| 344 SW 1st St #6 Pompano Beach, FL | 2.0 | 2.0 | 840 | $1,825 | $2.17 | 16d | 1 | 1.16mi |
| 138 S Cypress Rd #224 Pompano Beach, FL | 2.0 | 2.0 | 936 | $2,600 | $2.78 | 15d | 1 | 1.16mi |
| 132 S Cypress Rd #523 Pompano Beach, FL | 2.0 | 2.0 | 936 | $2,000 | $2.14 | 26d | 1 | 1.19mi |
| 5841 NE 3rd Ave Fort Lauderdale, FL | 3.0 | 2.0 | 834 | $3,200 | $3.84 | 26d | 1 | 1.28mi |
| 20 NW 7th Ave #6 Pompano Beach, FL | 3.0 | 1.5 | 1088 | $2,150 | $1.98 | 16d | 1 | 1.28mi |
| 103 NW 7th Ave Pompano Beach, FL | 2.0 | 1.0 | 650 | $2,000 | $3.08 | 26d | 1 | 1.31mi |
| 2400 NE 65th St Fort Lauderdale, FL | 1.0–3.0 | 1.0–2.0 | 1103 | $2,814 | $2.55 | 0d | 15 | 1.32mi |
| 201 SE 6th Ave #7 Pompano Beach, FL | 2.0 | 2.0 | 939 | $1,900 | $2.02 | 26d | 1 | 1.33mi |
| 151 SE 6th Ave Pompano Beach, FL | 1.0 | 1.5 | 700 | $1,525 | $2.18 | 26d | 2 | 1.34mi |
| 840 Pine Dr #103 Pompano Beach, FL | 2.0 | 2.0 | 904 | $2,800 | $3.10 | 26d | 1 | 1.36mi |
| 475 SE 1st St Pompano Beach, FL | 3.0 | 1.0–2.0 | 1017 | $3,718 | $3.65 | 0d | 17 | 1.37mi |
| 101 SE 6th Ave Pompano Beach, FL | 1.0–2.0 | 1.5–2.0 | 939 | $2,099 | $2.24 | 26d | 3 | 1.37mi |
| 912 Pine Dr #211 Pompano Beach, FL | 2.0 | 2.0 | 949 | $1,900 | $2.00 | 26d | 1 | 1.38mi |
| 651 Pine Dr Pompano Beach, FL | 2.0 | 2.0 | 1000 | $2,000 | $2.00 | 26d | 1 | 1.40mi |
| 200 NE 1st Ave Pompano Beach, FL | 2.0 | 1.0–2.5 | 1149 | $3,600 | $3.13 | 0d | 47 | 1.40mi |
| 1631 S Federal Hwy Pompano Beach, FL | 1.0–3.0 | 1.0–2.0 | 1092 | $2,774 | $2.54 | 0d | 16 | 1.41mi |
| 241 SE 9th Ave Pompano Beach, FL | 2.0 | 2.0 | 725 | $1,800 | $2.48 | 13d | 2 | 1.42mi |
| 1100 Pine Dr #102 Pompano Beach, FL | 2.0 | 2.0 | 950 | $2,100 | $2.21 | 26d | 1 | 1.43mi |
| 320 SE 10th Ave Unit D Pompano Beach, FL | 2.0 | 2.0 | 1000 | $2,300 | $2.30 | 26d | 1 | 1.44mi |
| 344 SE 11th Ave #8 Pompano Beach, FL | 1.0 | 1.0 | 600 | $1,500 | $2.50 | 26d | 1 | 1.45mi |
| 305 SE 11th Ave Unit D Pompano Beach, FL | 3.0 | 2.0 | 1000 | $2,400 | $2.40 | 18d | 1 | 1.48mi |
HOA detail condo
- Monthly dues
- $465 · $5,580/yr
- Likely covers
- pool
- Assessments
- None detected in remarks — confirm with the listing agent.
Listing history 11 events
-
2026-06-21days on market $174,900 Active 17 DOM
-
2026-06-18days on market $174,900 Active 14 DOM
-
2026-06-17days on market $174,900 Active 13 DOM
-
2026-06-16days on market $174,900 Active 12 DOM
-
2026-06-15days on market $174,900 Active 11 DOM
-
2026-06-13days on market $174,900 Active 9 DOM
-
2026-06-09days on market $174,900 Active 5 DOM
-
2026-06-08days on market $174,900 Active 4 DOM
-
2026-06-07days on market $174,900 Active 3 DOM
-
2026-06-04remarks 652-char remark
-
2026-06-04$174,900 Active 1 DOM
ⓘ Source: listings_history table (triggers on properties + properties_extension) + one-shot
backfill from property_details.listing_events for pre-trigger history.
Tax reassessment forecast FL · Resets to sale price
- Current annual tax
- $3,484 · $290/mo
- Projected year-2 tax
- $3,484 · $290/mo
- Expected delta
- $0/yr ($0/mo · 0.0%)
ⓘ Screening estimate from a state-policy table — verify with the county assessor before closing.
Climate risk First Street
- Flood 4/10 Moderate FEMA zone X (shaded) · 22% chance over 30 yrs
- Wildfire 1/10 Low
- Heat 10/10 Extreme 7 d/yr ≥106°F today · 26 d/yr by 30 yrs out
- Wind 10/10 Extreme 99% chance of damaging wind over 30 yrs
- Air quality 2/10 Low 1 unhealthy d/yr today · 2 by 30 yrs out
Nearby sold comps map
Loading sold comps map…
Walkable amenities ~0.75 mi
Loading nearby amenities…
Taxation est. · year 1
- Rental income
- $29,624
- − Mortgage interest
- −$9,797
- − Property taxes
- −$3,484
- − Insurance
- −$874
- − Repairs & maintenance
- −$2,370
- − Management
- −$2,370
- − HOA
- −$5,580
- − Depreciation
- −$5,088
- Taxable income
- $61
- Est. tax owed @ 24.0%
- −$15
- After-tax cash flow
- $2,444/yr
For passive investors: Depreciation is non-cash, so a rental often shows a tax loss while cash-flowing — sheltering income. Rental losses are passive: they offset passive income freely, and up to $25,000/yr can offset ordinary (W-2) income if you actively participate and your MAGI is under $100k (phasing out to $0 by $150k); unused losses carry forward. On sale, claimed depreciation is recaptured at up to 25%, and gains may owe capital-gains tax (a 1031 exchange can defer both). Figures are a year-1 estimate at your 24.0% rate — not tax advice; consult a CPA.
Schools (NCES district)
- District
- Broward
- NCES district ID
- 1200180
- Math proficiency
- 42% ▼ -18.00%
- Reading proficiency
- 53% ▼ -5.00%
- Median HH income
- $52,139
- Composite
- 40.88/100
- National rank
- #3621
- State rank
- #46 of 73 in FL
Livability — Pompano Beach
- Score
- 74/100
- State rank
- #284
- US rank
- #4541
Category grades
Schools grade is shown separately in the Schools card above.
Census & demographics
- Census place
- Pompano Beach, FL
- County
- Broward County · 1,963,430 people
- City population
- 155,861
- Metro
- Miami-Fort Lauderdale-Pompano Beach, FL
- Population (ZIP)
- 37,233
- Household income
- $64,819
- Rent vs Own
- Severe rent burden
- 2870.0
Population outlook (Broward County) Hauer SSP2
- Today (2025)
- 2,207,033 people
- By 2030
- 2,360,704 · +7.0%
- By 2040
- 2,661,208 · +20.6%
- By 2050
- 2,946,698 · +33.5%
- By 2075
- 3,602,273 · +63.2%
- By 2100
- 3,970,984 · +79.9%
Race, ethnicity, and origin ACS 2023
- Neighborhood character
- Diverse neighborhood (Simpson 0.69)
- Race & ethnicity
- Black 38% White 33% Hispanic / Latino 26% Two or more races 14%
- Hispanic origin (detail)
- Mexican 9% Puerto Rican 2% Cuban 3% Dominican 1%
- Common ancestry
- Hispanic 13% Romanian 2% Slovak 1%
- Foreign-born
- 31% · Canada, Jamaica
- Languages at home
- 60% English-only · Spanish 23% French/Haitian/Cajun 13% Other Indo-European 2%
Political lean MEDSL · Broward
- 2024 margin
- D (+17.0) · D 58.0% · R 41.0%
- 2008→2024 swing
- -17.8pp toward R · 2008: 34.7pp · 2024: 17.0pp
- All cycles
- 2024: D+17.0 2020: D+29.8 2016: D+35.0 2012: D+34.9 2008: D+34.7
Not yet ingested
- Civics
- —
Market trends
- HPI YoY
- ▼ -131.09%
- Current HPI
- 425.3083
- Rent YoY
- ▲ 2.12%
- Metro
- Miami-Fort Lauderdale-Pompano Beach, FL
- State GDP YoY
- ▲ 3.28%
- F500 in state
- 36
Industry mix (Fortune 500 HQ in FL)
| Industry | F500 HQs | Revenue |
|---|---|---|
| Industrial Technology | 2 | $29B |
|
||
| Insurance | 2 | $17B |
|
||
| Retail | 1 | $60B |
|
||
| Technology Distribution | 1 | $58B |
|
||
| Homebuilding | 1 | $35B |
|
||
| Technology Manufacturing | 1 | $35B |
|
||
Price history
+483.0% since first listed12 events — show timeline
- 2026-06-04 Listed $174,900 Beaches MLS
- 2025-01-05 Rental Removed $1,850 GFLMLS
- 2024-10-24 Listed for Rent $1,850 GFLMLS
- 2018-08-01 Sold (Public Records) $100,000 Public Records
- 2014-08-28 Sold (Public Records) $61,250 Public Records
- 2014-06-01 Listing Removed — Beaches MLS
- 2014-05-16 Price Changed $69,000 Beaches MLS
- 2014-05-12 Pending — Beaches MLS
- 2014-03-24 Relisted — Beaches MLS
- 2014-03-24 Price Changed $75,000 Beaches MLS
- 2014-02-12 Listed $85,000 Beaches MLS
- 1996-06-10 Sold (Public Records) $30,000 Public Records
Property tax history
+11.2%/yrLatest (2025): $3,484 · +3.9% YoY. Source: county tax records.
Cash-flow waterfall
monthlySold comps — $/sqft
last 12 mo · ≤1 miLoading sold comps…