70 Dogwood Ln · Lumberton, TX
Flood risk 1/10 · Minimal
- FEMA flood zone
- X (unshaded)
- Chance of flooding over 30 yrs
- 0.0%
- Est. flood insurance / yr
- $507 – $1,088
Fire risk 4/10 · Minor
- Est. fire insurance / yr
- $1,222 – $2,270
Heat risk 9/10 · Severe
- Hot days now (above 111°F)
- 7 days/yr
- Hot days in 30 yrs
- 24 days/yr
Wind risk 9/10 · Severe
- Chance of severe wind over 30 yrs
- 99.0%
Air-quality risk 2/10 · Minimal
- Unhealthy air days now
- 1 days/yr
- Unhealthy air days in 30 yrs
- 1 days/yr
Risk factors via First Street. Map © Google.
Why this score? — see what drove the B+ grade
The composite is a weighted blend of 9 inputs, each scored 0–100. Each bar is that input's sub-score; the figure is the points it added to the 100-point composite (weight × sub-score).
- Cash flow +30.0/30.0
- ARV discount +15.0/15.0
- 1% rule +10.0/10.0
- DSCR +10.0/10.0
- Schools +4.3/10.0
- Livability +3.8/5.0
- Rent growth +2.5/5.0
- Condition / age +2.5/5.0
- Appreciation +0.0/10.0
$125,000
🖨 Deal sheet (PDF) 📄 Offer letter ✓ Due diligence
Listing remarks MLS
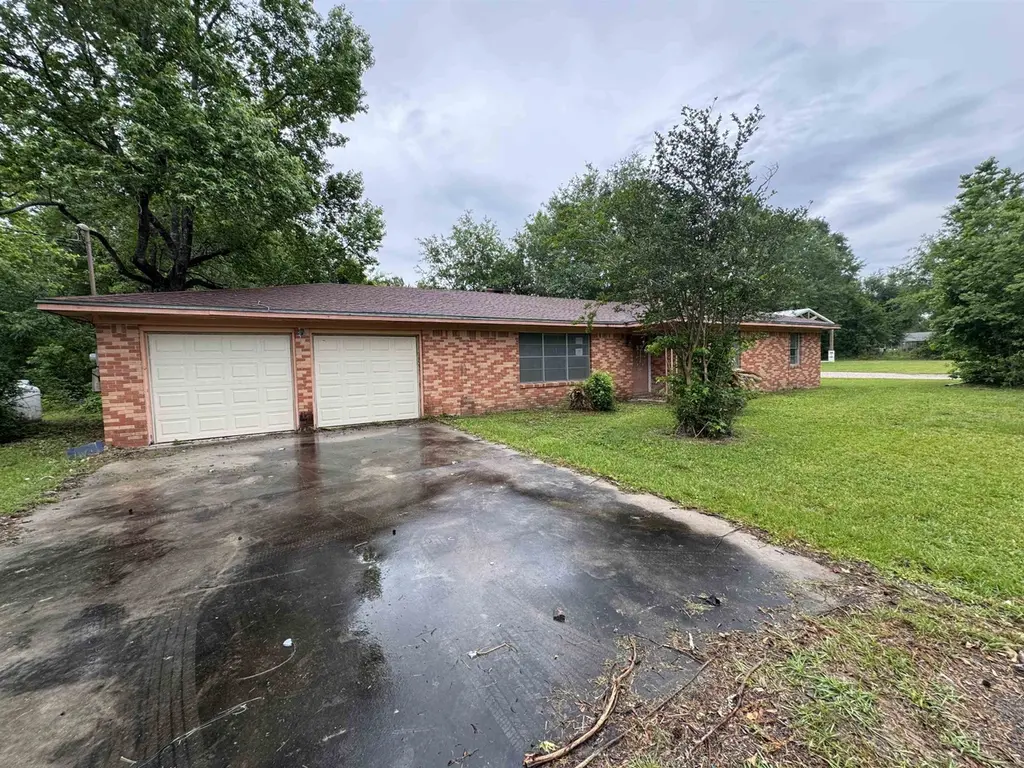
Terrific opportunity for making this home everything you want it to be. This home has a BRAND NEW roof installed September 2020, BRAND NEW AC inside and outside unit, BRAND NEW garage doors. You cannot ask for a better location as the 1.26 acres is in the heart of Lumberton Texas with easy access to HWY 96 and HWY 69. This home features 3 bedrooms 2 baths with a large 4th bedroom/game room/office/dining room. This home sits on 1.26 acres with several mature oak trees and is in the sought after Lumberton School district. No flooding ever on this property. Great investment opportunity or to make this your next home with acreage in the heart of Lumberton Tx. NO VALUE TO SHED IN BACK YARD
Key facts
- Garden
- Workshop
- 1.26-acre property
Tags
Property features AI
Exterior
- Parking: Attached 2-car garage
- Utilities: Public water; Public sewer
- Home design: Single-family residence; One story
- Construction: Brick veneer construction; Slab foundation; Built with composition roof
- Exterior features: Chain link fencing; Composition roof; Lot about 1.26 acres
Interior
- Kitchen: Dishwasher
- Flooring: Carpet; Vinyl
- Bathrooms: 2 full bathrooms
- Heating & cooling: Central heating (electric); Central air; Ceiling fan(s)
- Interior features: Breakfast bar; Wood-burning fireplace
Neighborhood map
What this means for you Summary
Snapshot
- This is a 3-bed/2.0-bath single-family listed at $125k.
Deal economics
- At list price, monthly cash flow is $673 ($8k/yr) — positive.
- The deal already cash-flows at list — no discount required.
- Meets the 1% rule at list price ($2k rent vs $125k).
- Cap rate 12.8% vs local median 3.2% in Lumberton — top-decile yield for the area; either an underpriced asset or a hidden risk that comps aren't pricing in. Stress-test before assuming the spread holds.
Location & tenants
- Location reads 75/100 on livability (#160 in TX, #4,326 nationally) — a middle-class / working-renter tenant base. Strengths: crime A+, employment A+, cost of living A+; Watch: amenities F, commute F.
- Lumberton ISD (suburban): math 48% / reading 50% proficiency, ranked #173 of 826 in TX (top 21%) — families likely to look elsewhere, expect single-tenant / working-renter base with shorter leases.
- Zoned schools: Lumberton Pri (math 54% / reading 58%, grade C+, #574 of 4,322 statewide, top 14%, 982 students, 43% FRL); Lumberton Middle (math 47% / reading 51%, grade C-, #378 of 1,662 statewide, top 23%, 969 students, 35% FRL); Lumberton H S (math 55% / reading 61%, grade C, #320 of 1,632 statewide, top 20%, 1,229 students, 30% FRL).
- Market conditions: 318 active listings in the ZIP; 9 comparable units currently listed for rent nearby; rentals at typical pace (median 25d on market — plan ~3-4 weeks tenant-placement turnaround); 44% of comp listings sitting > 30 days — soft ceiling on asking rent; solid renter incomes; 358 units permitted in Hardin County in 2024 (0 in 5+ unit buildings).
Forward outlook
- Local home prices are declining (-3.0%/yr); year-one equity from $864 of loan paydown is wiped out by about $4k of value loss. Plan a longer hold.
- At projected returns (-3.0% appreciation + 3.0% rent growth), your $35k cash investment doubles in ~6 years — after that, you're playing with house money.
Negotiation context
- Only 9 days on market — expect competitive offers; lowballing is unlikely to land.
- 2 sale attempts since 6y ago with the ask held roughly flat each time — persistent listings suggest the price (not the market) is what's stuck; bring a comps-based counter.
Risks & watch-outs
- Climate carrying-cost: severe wind risk, 99% chance of damaging wind over 30y; extreme-heat days projected 7→24/yr by 2055 (HVAC capex compounding) — expect insurance premiums to compound above CPI over the hold.
Questions for the listing agent
- Built in 1973 — when were the roof, HVAC, electrical panel, plumbing, and water heater last replaced?
- Is there a deadline driving the sale (1031 exchange, divorce, estate, relocation)? That informs how much negotiation room exists.
- What's the average days-on-market for RENTAL listings here right now (not sales)? A rising rental-DOM trend means longer vacancies and softer asking-rent achievability than the comps imply.
- What's the recent tenant-quality profile in this submarket — average credit score on applications, eviction rate, late-payment / NSF rate, and stable-employment percentage? A property-management company in the area should have these aggregated.
- How much new for-sale + rental construction is in the pipeline within 1–3 miles? Heavy new supply typically softens prices + rents 12–24 months out; constrained supply supports both.
Investment metrics
- 1% rule
- 1.66% ✓
- Cap rate
- 12.76%
- Cash-on-cash
- 23.08%
- DSCR
- 2.03
- GRM
- 5.0
CMA / ARV
- ARV (median comp)
- $240,528
- List price
- $125,000
- Delta
- -48.03%
- Verdict
- UNDERPRICED
- Comps
- 20 within 1.0 mi
Show comp detail 7 sales within ~0.75 mi
| Address | Dist | Beds/Ba | Sqft | Sold | Price | $/sf | Match |
|---|---|---|---|---|---|---|---|
| 1054 Bryan Ln | 0.43mi | 3/2.0 | 1,665 (+8%) | 0mo | $275,000 | $165 | 66 |
| 322 N Lhs Dr | 0.59mi | 3/2.0 | 1,664 (+8%) | 3mo | $750,000 | $451 | 56 |
| 119 Stephens Ln | 0.67mi | 3/2.0 | 1,645 (+7%) | 4mo | $218,000 | $133 | 54 |
| 6050 Westchase Loop | 0.72mi | 3/2.0 | 1,478 (-4%) | 10mo | $240,000 | $162 | 52 |
| 5225 Westgate Ln | 0.72mi | 3/2.0 | 1,499 (-2%) | 13mo | $239,500 | $160 | 51 |
| 6115 Westchase Loop | 0.67mi | 3/2.0 | 1,584 (+3%) | 16mo | $229,900 | $145 | 50 |
| 450 Jordan Dr | 0.36mi | 3/2.0 | 1,305 (-15%) | 15mo | $259,000 | $198 | 45 |
Match score weights: distance 35% · size 25% · config 20% · recency 20%. Top-matched comps best support the ARV.
Projected returns pro-forma
-3.0% appreciation · 3.0% rent growth · sell at horizon
- IRR
- 16.1%
- Equity multiple
- 1.65×
- Total profit
- $22,720
- Equity at exit
- $18,638
- IRR
- 24.8%
- Equity multiple
- 3.15×
- Total profit
- $75,385
- Equity at exit
- $10,808
Cash invested: $35,000 (down + closing). Projections, not guarantees.
Landlord ↔ Tenant lean methodology
- Overall (STATE)
- 87 Strongly Landlord-Friendly
- State Texas
- 87 Strongly Landlord-Friendly · R+5
- County
- — inherits STATE
- City
- — inherits STATE
ZIP-level market 77657
- Active inventory
- 318
- Price-to-rent
- 5.0×
Monthly cashflow live
- Estimated rent
- $2,076 high interval (Pro) →
- Mortgage (P&I)
- −$656
- Tax from tax record
- −$259 /mo · $3,114/yr
- Insurance
- −$52
- HOA
- −$0
- Vacancy / Maint / Mgmt
- −$436
- Net cashflow
- $673
Break-even live
Sensitivity live
| Price | -10% $744 | -5% $709 | +0% $673 | +5% $638 | +10% $603 |
|---|---|---|---|---|---|
| Rent | -10% $509 | -5% $591 | +0% $673 | +5% $755 | +10% $837 |
| Rate | -1.0pp $736 | -0.5pp $705 | base $673 | +0.5pp $641 | +1.0pp $608 |
UW: 25.0% down · 7.5% · 30yr · 1.5% tax · 5.0% vac · 8.0% maint · 8.0% mgmt
Financing live
Cash to close
- Down payment
- $31,250
- Closing costs
- $3,750
- Reserves months
- —
- Total cash needed
- —
Loan-product check · same deal, 3 products live
Conventional
25% down · 7.5% · 30yr
- Down + closing
- —
- Monthly P&I
- —
- Monthly cashflow
- —
- DSCR
- —
- Eligible?
- —
Personal DTI + credit; lowest rate.
DSCR
20% down · 8.5% · 30yr
- Down + closing
- —
- Monthly P&I
- —
- Monthly cashflow
- —
- DSCR
- —
- Eligible?
- —
No personal income docs; deal must DSCR.
Hard money
10% down · 12.0% · 12mo
- Down + closing
- —
- Monthly P&I
- —
- Monthly cashflow
- —
- DSCR
- —
- Eligible?
- —
Short-term bridge; refi at stabilization.
Rent comps 9 comps
| Address | Beds | Baths | Sqft | Rent | $/sqft | DOM | Units | Dist |
|---|---|---|---|---|---|---|---|---|
| 65 Jordan Dr Lumberton, TX | 4.0 | 2.0 | 1352 | $1,995 | $1.48 | 15d | 1 | 0.28mi |
| 102 Remington Cir Lumberton, TX | 4.0 | 2.0 | 2079 | $2,825 | $1.36 | 45d | 1 | 0.56mi |
| 322 N Lhs Dr Lumberton, TX | 3.0 | 2.0 | 1664 | $1,500 | $0.90 | 45d | 1 | 0.57mi |
| 6575 Daylily Lumberton, TX | 3.0 | 2.0 | 1512 | $1,350 | $0.89 | 45d | 1 | 0.68mi |
| 30 Stephens Ln Lumberton, TX | 2.0 | 2.0 | 1290 | $1,650 | $1.28 | 45d | 1 | 0.76mi |
| 5670 Shadowbend Cir N Unit 104 Lumberton, TX | 3.0 | 2.5 | 1500 | $1,900 | $1.27 | 15d | 1 | 1.02mi |
| 65 Hooks Rd Lumberton, TX | 4.0 | 2.0 | 2174 | $1,600 | $0.74 | 25d | 1 | 1.05mi |
| 5525 Westchase Loop Lumberton, TX | 3.0 | 2.0 | 1384 | $2,100 | $1.52 | 15d | 1 | 1.20mi |
| 500 Trinity Rd Lumberton, TX | 3.0 | 2.0 | 1920 | $2,175 | $1.13 | 15d | 1 | 1.49mi |
Listing history 5 events
-
2026-05-15status Pending 513-char remark
-
2026-05-06$125,000 Active 513-char remark
-
2020-12-15soldstatus
-
2020-12-09soldstatus 693-char remark
Show marketing remark (693 chars)
Terrific opportunity for making this home everything you want it to be. This home has a BRAND NEW roof installed September 2020, BRAND NEW AC inside and outside unit, BRAND NEW garage doors. You cannot ask for a better location as the 1.26 acres is in the heart of Lumberton Texas with easy access to HWY 96 and HWY 69. This home features 3 bedrooms 2 baths with a large 4th bedroom/game room/office/dining room. This home sits on 1.26 acres with several mature oak trees and is in the sought after Lumberton School district. No flooding ever on this property. Great investment opportunity or to make this your next home with acreage in the heart of Lumberton Tx. NO VALUE TO SHED IN BACK YARD
-
2020-10-25$165,000 693-char remark
Show marketing remark (693 chars)
Terrific opportunity for making this home everything you want it to be. This home has a BRAND NEW roof installed September 2020, BRAND NEW AC inside and outside unit, BRAND NEW garage doors. You cannot ask for a better location as the 1.26 acres is in the heart of Lumberton Texas with easy access to HWY 96 and HWY 69. This home features 3 bedrooms 2 baths with a large 4th bedroom/game room/office/dining room. This home sits on 1.26 acres with several mature oak trees and is in the sought after Lumberton School district. No flooding ever on this property. Great investment opportunity or to make this your next home with acreage in the heart of Lumberton Tx. NO VALUE TO SHED IN BACK YARD
ⓘ Source: listings_history table (triggers on properties + properties_extension) + one-shot
backfill from property_details.listing_events for pre-trigger history.
Tax reassessment forecast TX · Resets to sale price
- Current annual tax
- $3,114 · $259/mo
- Projected year-2 tax
- $3,114 · $259/mo
- Expected delta
- $0/yr ($0/mo · 0.0%)
ⓘ Screening estimate from a state-policy table — verify with the county assessor before closing.
Climate risk First Street
- Flood 1/10 Low FEMA zone X (unshaded) · 0% chance over 30 yrs
- Wildfire 4/10 Moderate
- Heat 9/10 Extreme 7 d/yr ≥111°F today · 24 d/yr by 30 yrs out
- Wind 9/10 Extreme 99% chance of damaging wind over 30 yrs
- Air quality 2/10 Low 1 unhealthy d/yr today · 1 by 30 yrs out
Nearby sold comps map
Loading sold comps map…
Walkable amenities ~0.75 mi
Loading nearby amenities…
Taxation est. · year 1
- Rental income
- $24,917
- − Mortgage interest
- −$7,002
- − Property taxes
- −$3,114
- − Insurance
- −$625
- − Repairs & maintenance
- −$1,993
- − Management
- −$1,993
- − Depreciation
- −$3,636
- Taxable income
- $6,553
- Est. tax owed @ 24.0%
- −$1,573
- After-tax cash flow
- $6,507/yr
For passive investors: Depreciation is non-cash, so a rental often shows a tax loss while cash-flowing — sheltering income. Rental losses are passive: they offset passive income freely, and up to $25,000/yr can offset ordinary (W-2) income if you actively participate and your MAGI is under $100k (phasing out to $0 by $150k); unused losses carry forward. On sale, claimed depreciation is recaptured at up to 25%, and gains may owe capital-gains tax (a 1031 exchange can defer both). Figures are a year-1 estimate at your 24.0% rate — not tax advice; consult a CPA.
Schools (NCES district)
- District
- Lumberton ISD
- NCES district ID
- 4813530
- Math proficiency
- 48% ▼ -5.00%
- Reading proficiency
- 50% ▼ -4.00%
- Median HH income
- $62,996
- Composite
- 43.2/100
- National rank
- #3063
- State rank
- #173 of 826 in TX
Livability — Lumberton
- Score
- 75/100
- State rank
- #160
- US rank
- #4326
Category grades
Schools grade is shown separately in the Schools card above.
Census & demographics
- Census place
- Lumberton, TX
- County
- Hardin County · 39,783 people
- City population
- 22,258
- Metro
- Beaumont-Port Arthur, TX
- Population (ZIP)
- 22,258
- Household income
- $95,718
- Rent vs Own
- Severe rent burden
- 147.0
Population outlook (Hardin County) Hauer SSP2
- Today (2025)
- 57,780 people
- By 2030
- 58,296 · +0.9%
- By 2040
- 58,421 · +1.1%
- By 2050
- 57,391 · -0.7%
- By 2075
- 53,132 · -8.0%
- By 2100
- 44,905 · -22.3%
Race, ethnicity, and origin ACS 2023
- Neighborhood character
- Predominantly White (89%)
- Race & ethnicity
- White 89% Hispanic / Latino 5% Two or more races 5%
- Hispanic origin (detail)
- Mexican 4%
- Common ancestry
- Lithuanian 10% Serbian 3% Slovak 2%
- Foreign-born
- 2% · Canada
- Languages at home
- 97% English-only · Spanish 2%
Political lean MEDSL · Hardin
- 2024 margin
- Solid R (+75.8) · D 11.9% · R 87.7%
- 2008→2024 swing
- -14.6pp toward R · 2008: -61.2pp · 2024: -75.8pp
- All cycles
- 2024: R+75.8 2020: R+73.8 2016: R+73.9 2012: R+67.6 2008: R+61.2
Not yet ingested
- Civics
- —
Market trends
- HPI YoY
- ▼ -160.56%
- Current HPI
- 156.2265
- Rent YoY
- —
- Metro
- Beaumont-Port Arthur, TX
- State GDP YoY
- ▲ 3.95%
- F500 in state
- 110
Industry mix (Fortune 500 HQ in TX)
| Industry | F500 HQs | Revenue |
|---|---|---|
| Energy | 16 | $1,198B |
|
||
| Technology | 5 | $198B |
|
||
| Engineering / Construction | 4 | $72B |
|
||
| Energy Services | 3 | $60B |
|
||
| Utilities | 3 | $41B |
|
||
| Healthcare | 2 | $330B |
|
||
Price history
-24.2% since first listed5 events — show timeline
- 2026-05-15 Pending — BBOR
- 2026-05-06 Listed $125,000 BBOR
- 2020-12-15 Sold (Public Records) — Public Records
- 2020-12-09 Sold (MLS) — BBOR
- 2020-10-25 Listed $165,000 BBOR
Property tax history
+1.3%/yrLatest (2025): $3,114 · -0.8% YoY. Source: county tax records.
Cash-flow waterfall
monthlySold comps — $/sqft
last 12 mo · ≤1 miLoading sold comps…