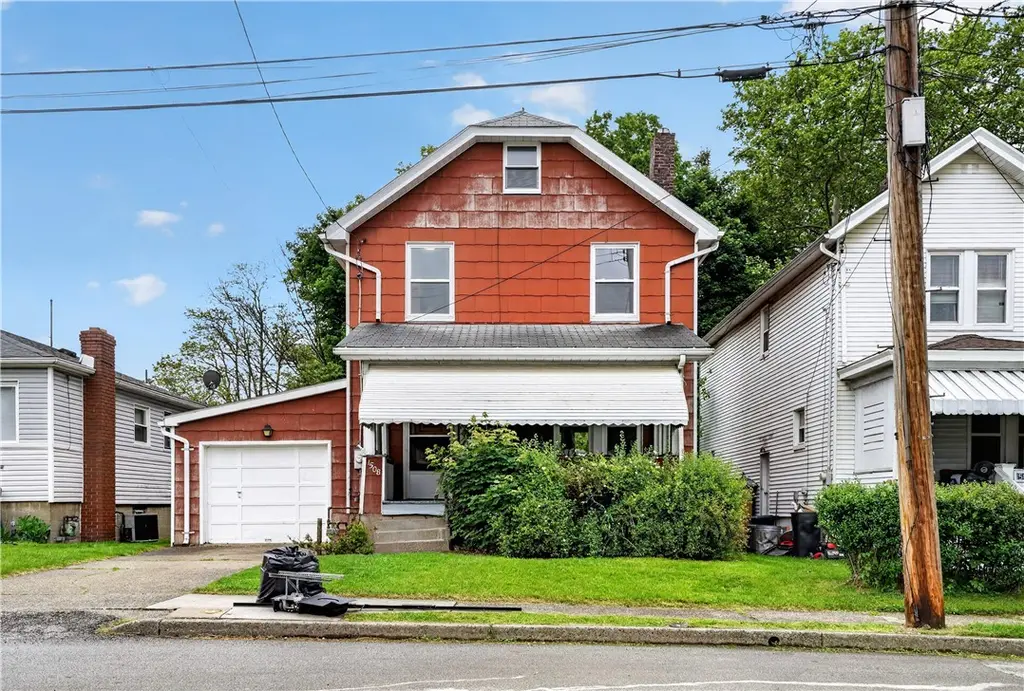
1508 Abraham St · McKeesport, PA
Flood risk 1/10 · Minimal
- FEMA flood zone
- X (unshaded)
- Chance of flooding over 30 yrs
- 0.0%
- Est. flood insurance / yr
- $473 – $860
Fire risk 1/10 · Minimal
- Est. fire insurance / yr
- $511 – $949
Heat risk 4/10 · Minor
- Hot days now (above 97°F)
- 7 days/yr
- Hot days in 30 yrs
- 18 days/yr
Wind risk 2/10 · Minimal
- Chance of severe wind over 30 yrs
- 0.0%
Air-quality risk 5/10 · Moderate
- Unhealthy air days now
- 9 days/yr
- Unhealthy air days in 30 yrs
- 11 days/yr
Risk factors via First Street. Map © Google.
Why this score? — see what drove the C- grade
The composite is a weighted blend of 9 inputs, each scored 0–100. Each bar is that input's sub-score; the figure is the points it added to the 100-point composite (weight × sub-score).
- Cash flow +24.2/30.0
- DSCR +7.8/10.0
- ARV discount +5.9/15.0
- 1% rule +5.6/10.0
- Livability +3.3/5.0
- Rent growth +2.5/5.0
- Condition / age +2.5/5.0
- Schools +1.6/10.0
- Appreciation +0.0/10.0
$114,900
🖨 Deal sheet 📄 Offer letter ✓ Due diligence
Listing remarks MLS
super starter clean & neat lovely level backyard nice patio off back porch w fan
Key facts
- 2 story residence
- Full basement
- Convenient location
Tags
Property features AI
Finance
- HOA & community: Access to public transportation
Exterior
- Parking: Attached garage (1 parking space total)
- Utilities: Public water
- Home design: 2-story residence; Resale condition
- Construction: Shingle siding; Composition roof
- Exterior features: Small lot (approx. 0.086 acres)
Interior
- Kitchen: Stove; Some gas appliances
- Bedrooms: Three bedrooms (two upper-level bedrooms and one upper-level third bedroom)
- Flooring: Carpet
- Bathrooms: One full bathroom
- Heating & cooling: Forced-air gas heating
- Interior features: Window treatments throughout; Decorative fireplace
Neighborhood map
What this means for you Summary
Snapshot
- This is a 3-bed/1.0-bath single-family listed at $115k.
Deal economics
- At list price, monthly cash flow is $229 ($3k/yr) — positive.
- The deal already cash-flows at list — no discount required.
- Meets the 1% rule at list price ($1k rent vs $115k).
- Recommended offer: $113k (1.5% below list) — sets the bar for market timing.
Location & tenants
- Location reads 66/100 on livability (#1,089 in PA) — a middle-class / working-renter tenant base. Strengths: commute A+, cost of living A+, housing A+; Watch: schools D+, health & safety D, crime F.
- Mckeesport Area SD (suburban): math 11% / reading 28% proficiency, ranked #499 of 539 in PA (top 93%) — low school quality limits family demand, transient renter base, plan for 1-2y turnover; 66% free/reduced lunch — lower-income household profile, screen leases tightly.
- Market conditions: 113 active listings in the ZIP; 16 comparable units currently listed for rent nearby; rentals at typical pace (median 24d on market — plan ~3-4 weeks tenant-placement turnaround); lower-income renter base — watch delinquency; 2,996 units permitted in Allegheny County in 2024 (1,588 in 5+ unit buildings).
- This rent runs 41% of the median local income ($35k/yr) — at the standard rent-burdened threshold; future hikes will face affordability resistance.
Forward outlook
- Local home prices are declining (-3.0%/yr); year-one equity from $794 of loan paydown is wiped out by about $3k of value loss. Plan a longer hold.
Negotiation context
- It's been on market 30 days — a 2% lower offer ($113k) is reasonable based on typical stale-listing flexibility.
- 3 sale attempts since 28y ago with the ask held roughly flat each time — persistent listings suggest the price (not the market) is what's stuck; bring a comps-based counter.
- Current owner paid $38k; list at $115k implies a 198% gain — meaningful room to come down on a strong offer.
Risks & watch-outs
- Watch-outs: built in 1920 — expect roof / HVAC / electrical / plumbing capex.
Questions for the listing agent
- Built in 1920 — when were the roof, HVAC, electrical panel, plumbing, and water heater last replaced?
- Is there a deadline driving the sale (1031 exchange, divorce, estate, relocation)? That informs how much negotiation room exists.
- Schools are D-rated, which usually means shorter tenancies and higher turnover. Who's the typical renter profile here, and what's been the actual vacancy rate?
- Crime grade is F in this area — have there been break-ins, vandalism, or insurance claims at this property in the last 3 years? What carrier currently insures it and at what premium?
- What's the average days-on-market for RENTAL listings here right now (not sales)? A rising rental-DOM trend means longer vacancies and softer asking-rent achievability than the comps imply.
- What's the recent tenant-quality profile in this submarket — average credit score on applications, eviction rate, late-payment / NSF rate, and stable-employment percentage? A property-management company in the area should have these aggregated.
- How much new for-sale + rental construction is in the pipeline within 1–3 miles? Heavy new supply typically softens prices + rents 12–24 months out; constrained supply supports both.
Investment metrics
- 1% rule
- 1.06% ✓
- Cap rate
- 8.68%
- Cash-on-cash
- 8.54%
- DSCR
- 1.38
- GRM
- 7.9
CMA / ARV
- ARV (on-the-fly)
- $110,838
- Comps found
- 12
Show comp detail 12 sales within ~0.75 mi
| Address | Dist | Beds/Ba | Sqft | Sold | Price | $/sf | Match |
|---|---|---|---|---|---|---|---|
| 1707 Grandview Ave | 0.11mi | 2/1.0 (-1) | 1,120 (-8%) | 1mo | $110,000 | $98 | 75 |
| 2104 Calvin St | 0.28mi | 2/2.0 (-1) | 1,200 (-2%) | 5mo | $110,000 | $92 | 71 |
| 2112 Dalton | 0.30mi | 3/1.0 | 1,122 (-8%) | 3mo | $75,000 | $67 | 70 |
| 2817 Jenny Lind St | 0.47mi | 2/1.0 (-1) | 1,232 (+1%) | 2mo | $51,033 | $41 | 70 |
| 1310 Pirl St | 0.41mi | 3/1.0 | 1,270 (+4%) | 7mo | $55,000 | $43 | 68 |
| 3021 Myer Blvd | 0.40mi | 3/1.0 | 1,296 (+6%) | 7mo | $118,000 | $91 | 65 |
| 473 Mccully St | 0.55mi | 3/1.5 | 1,260 (+3%) | 3mo | $206,000 | $163 | 64 |
| 3806 Sarah St | 0.50mi | 3/1.0 | 1,324 (+9%) | 0mo | $129,900 | $98 | 62 |
| 1819 Craig St | 0.24mi | 3/1.5 | 1,080 (-11%) | 9mo | $139,900 | $130 | 61 |
| 2405 Harrison St | 0.44mi | 3/2.5 | 1,320 (+8%) | 7mo | $21,000 | $16 | 53 |
| 2613 Cleveland St | 0.58mi | 2/1.0 (-1) | 1,328 (+9%) | 1mo | $49,000 | $37 | 52 |
| 2510 Oak St | 0.60mi | 3/1.0 | 1,088 (-11%) | 6mo | $19,000 | $17 | 49 |
Match score weights: distance 35% · size 25% · config 20% · recency 20%. Top-matched comps best support the ARV.
Projected returns pro-forma
-3.0% appreciation · 3.0% rent growth · sell at horizon
- IRR
- -3.4%
- Equity multiple
- 0.87×
- Total profit
- $-4,061
- Equity at exit
- $17,132
- IRR
- 6.3%
- Equity multiple
- 1.47×
- Total profit
- $15,151
- Equity at exit
- $9,934
Cash invested: $32,172 (down + closing). Projections, not guarantees.
Landlord ↔ Tenant lean methodology
- Overall (STATE)
- 62 Landlord-Friendly
- State Pennsylvania
- 62 Landlord-Friendly · EVEN
- County
- — inherits STATE
- City
- — inherits STATE
ZIP-level market 15132
- Home prices YoY
- -32.9%
- Active inventory
- 113
- Price-to-rent
- 7.9×
Monthly cashflow live
- Estimated rent
- $1,214 high interval (Pro) →
- Mortgage (P&I)
- −$603
- Tax from tax record
- −$80 /mo · $958/yr
- Insurance
- −$48
- HOA
- −$0
- Vacancy / Maint / Mgmt
- −$255
- Net cashflow
- $229
Break-even live
UW: 25.0% down · 7.5% · 30yr · 1.5% tax · 5.0% vac · 8.0% maint · 8.0% mgmt
Financing live
Cash to close
- Down payment
- $28,725
- Closing costs
- $3,447
- Reserves months
- —
- Total cash needed
- —
Loan-product check · same deal, 3 products live
Conventional
25% down · 7.5% · 30yr
- Down + closing
- —
- Monthly P&I
- —
- Monthly cashflow
- —
- DSCR
- —
- Eligible?
- —
Personal DTI + credit; lowest rate.
DSCR
20% down · 8.5% · 30yr
- Down + closing
- —
- Monthly P&I
- —
- Monthly cashflow
- —
- DSCR
- —
- Eligible?
- —
No personal income docs; deal must DSCR.
Hard money
10% down · 12.0% · 12mo
- Down + closing
- —
- Monthly P&I
- —
- Monthly cashflow
- —
- DSCR
- —
- Eligible?
- —
Short-term bridge; refi at stabilization.
Rent comps 16 comps
| Address | Beds | Baths | Sqft | Rent | $/sqft | DOM | Units | Dist |
|---|---|---|---|---|---|---|---|---|
| 3710 Mayfair St McKeesport, PA | 3.0 | 1.5 | 1314 | $1,095 | $0.83 | 3d | 1 | 0.22mi |
| 3506 Mayfair St Unit B McKeesport, PA | 2.0 | 1.0 | 948 | $1,200 | $1.27 | 43d | 1 | 0.25mi |
| 1114-1116 Ohio St Unit 2R McKeesport, PA | 2.0 | 1.0 | 878 | $850 | $0.97 | 16d | 1 | 0.33mi |
| 1506 Freemont St McKeesport, PA | 3.0 | 2.0 | 1250 | $1,295 | $1.04 | 23d | 1 | 0.35mi |
| 2408 McCarrell St McKeesport, PA | 4.0 | 1.0 | 1430 | $1,195 | $0.84 | 23d | 1 | 0.53mi |
| 1217 Scott St McKeesport, PA | 3.0 | 1.0 | 1500 | $1,165 | $0.78 | 43d | 1 | 0.58mi |
| 1108 Prescott St White Oak, PA | 2.0 | 1.0 | 945 | $1,200 | $1.27 | 12d | 1 | 0.59mi |
| 311-313 24th St McKeesport, PA | 2.0 | 1.0 | 950 | $900 | $0.95 | 43d | 1 | 0.90mi |
| 2918 Walnut St Apt 3 McKeesport, PA | 2.0 | 1.0 | 800 | $850 | $1.06 | 43d | 1 | 0.92mi |
| 3211 Walnut St McKeesport, PA | 4.0 | 1.0 | 1434 | $1,500 | $1.05 | 7d | 1 | 0.94mi |
| 2618 Poinsettia Dr White Oak, PA | 4.0 | 1.0 | 1225 | $1,599 | $1.31 | 23d | 1 | 1.09mi |
| 1451 Jenny Lind St McKeesport, PA | 3.0 | 1.5 | 1408 | $1,150 | $0.82 | 23d | 1 | 1.17mi |
| 1735 Ohio Ave Unit 6 White Oak, PA | 3.0 | 1.0 | 1034 | $1,200 | $1.16 | 43d | 1 | 1.21mi |
| 152 Royal Oak Dr White Oak, PA | 1.0–2.0 | 1.0–2.0 | 930 | $1,445 | $1.55 | 1d | 9 | 1.30mi |
| 604 Shaw Ave McKeesport, PA | 2.0 | 1.0–1.5 | 800 | $900 | $1.12 | 12d | 3 | 1.31mi |
| 604 Shaw Ave Unit 101 McKeesport, PA | 2.0 | 1.5 | 1050 | $900 | $0.86 | 14d | 1 | 1.31mi |
Listing history 21 events
-
2026-06-18days on market $114,900 Active 30 DOM
-
2026-06-17days on market $114,900 Active 29 DOM
-
2026-06-16days on market $114,900 Active 28 DOM
-
2026-06-15days on market $114,900 Active 27 DOM
-
2026-06-13days on market $114,900 Active 25 DOM
-
2026-06-13days on market $114,900 Active 24 DOM
-
2026-06-09days on market $114,900 Active 21 DOM
-
2026-06-08days on market $114,900 Active 20 DOM
-
2026-06-07days on market $114,900 Active 19 DOM
-
2026-06-03days on market $114,900 Active 15 DOM
-
2026-06-02days on market $114,900 Active 14 DOM
-
2026-06-01days on market $114,900 Active 13 DOM
-
2026-05-31days on market $114,900 Active 12 DOM
-
2026-05-19$114,900 Active
-
2014-09-19soldstatus $38,500
-
2014-09-18price $38,500 86-char remark
Show marketing remark (86 chars)
super starter clean & neat lovely level backyard nice patio off back porch w fan
-
2014-09-17soldstatus $38,500 86-char remark
Show marketing remark (86 chars)
super starter clean & neat lovely level backyard nice patio off back porch w fan
-
2014-09-17price $42,900 86-char remark
Show marketing remark (86 chars)
super starter clean & neat lovely level backyard nice patio off back porch w fan
-
2014-06-24$42,900 86-char remark
Show marketing remark (86 chars)
super starter clean & neat lovely level backyard nice patio off back porch w fan
-
1999-05-20soldstatus $17,600 112-char remark
Show marketing remark (112 chars)
SPECIAL WARR DEED AS IS COND, SPECIAL AGREE ADDEN- DUM, SUBJ TO CORP APPROVAL, LIST OFFICE HOLDS H/M, LEVEL REAR
-
1998-06-03$22,900 112-char remark
Show marketing remark (112 chars)
SPECIAL WARR DEED AS IS COND, SPECIAL AGREE ADDEN- DUM, SUBJ TO CORP APPROVAL, LIST OFFICE HOLDS H/M, LEVEL REAR
ⓘ Source: listings_history table (triggers on properties + properties_extension) + one-shot
backfill from property_details.listing_events for pre-trigger history.
Tax reassessment forecast PA · Partial reset (capped growth)
- Current annual tax
- $958 · $80/mo
- Projected year-2 tax
- $1,387 · $116/mo
- Expected delta
- +$429/yr (+$36/mo · 44.8%)
ⓘ Screening estimate from a state-policy table — verify with the county assessor before closing.
Climate risk First Street
- Flood 1/10 Low FEMA zone X (unshaded) · 0% chance over 30 yrs
- Wildfire 1/10 Low
- Heat 4/10 Moderate 7 d/yr ≥97°F today · 18 d/yr by 30 yrs out
- Wind 2/10 Low 0% chance of damaging wind over 30 yrs
- Air quality 5/10 Major 9 unhealthy d/yr today · 11 by 30 yrs out
Nearby sold comps map
Loading sold comps map…
Walkable amenities ~0.75 mi
Loading nearby amenities…
Taxation est. · year 1
- Rental income
- $14,569
- − Mortgage interest
- −$6,436
- − Property taxes
- −$958
- − Insurance
- −$574
- − Repairs & maintenance
- −$1,166
- − Management
- −$1,166
- − Depreciation
- −$3,343
- Taxable income
- $927
- Est. tax owed @ 24.0%
- −$223
- After-tax cash flow
- $2,524/yr
For passive investors: Depreciation is non-cash, so a rental often shows a tax loss while cash-flowing — sheltering income. Rental losses are passive: they offset passive income freely, and up to $25,000/yr can offset ordinary (W-2) income if you actively participate and your MAGI is under $100k (phasing out to $0 by $150k); unused losses carry forward. On sale, claimed depreciation is recaptured at up to 25%, and gains may owe capital-gains tax (a 1031 exchange can defer both). Figures are a year-1 estimate at your 24.0% rate — not tax advice; consult a CPA.
Schools (NCES district)
- District
- Mckeesport Area SD
- NCES district ID
- 4214940
- Math proficiency
- 11% ▼ -9.00%
- Reading proficiency
- 28% ▼ -10.00%
- Median HH income
- $33,779
- Composite
- 15.88/100
- National rank
- #9257
- State rank
- #499 of 539 in PA
Livability — McKeesport
- Score
- 66/100
- State rank
- #1089
- US rank
- #12321
Category grades
Schools grade is shown separately in the Schools card above.
Census & demographics
- Census place
- McKeesport, PA
- County
- Allegheny County · 1,022,028 people
- City population
- 25,010
- Metro
- Pittsburgh, PA
- Population (ZIP)
- 18,898
- Household income
- $35,397
- Rent vs Own
- Severe rent burden
- 1239.0
Population outlook (Allegheny County) Hauer SSP2
- Today (2025)
- 1,250,282 people
- By 2030
- 1,256,482 · +0.5%
- By 2040
- 1,256,318 · +0.5%
- By 2050
- 1,244,169 · -0.5%
- By 2075
- 1,197,693 · -4.2%
- By 2100
- 1,093,187 · -12.6%
Race, ethnicity, and origin ACS 2023
- Neighborhood character
- Diverse neighborhood (Simpson 0.62)
- Race & ethnicity
- White 50% Black 35% Two or more races 10% Hispanic / Latino 4% Asian 1%
- Common ancestry
- Romanian 5% Serbian 2% Scotch-Irish 2%
- Foreign-born
- 2% · Canada, China
- Languages at home
- 96% English-only · Spanish 3%
Political lean MEDSL · Allegheny
- 2024 margin
- Strong D (+20.3) · D 59.7% · R 39.4%
- 2008→2024 swing
- +4.8pp toward D · 2008: 15.5pp · 2024: 20.3pp
- All cycles
- 2024: D+20.3 2020: D+20.4 2016: D+16.4 2012: D+14.4 2008: D+15.5
Not yet ingested
- Civics
- —
Market trends
- HPI YoY
- ▼ -71.01%
- Current HPI
- 145.195
- Rent YoY
- —
- Metro
- Pittsburgh, PA
- State GDP YoY
- ▲ 1.68%
- F500 in state
- 34
Industry mix (Fortune 500 HQ in PA)
| Industry | F500 HQs | Revenue |
|---|---|---|
| Healthcare | 2 | $309B |
|
||
| Insurance | 2 | $27B |
|
||
| Telecommunications / Media | 1 | $124B |
|
||
| Industrial Distribution | 1 | $22B |
|
||
| Financial Services | 1 | $20B |
|
||
| Chemicals / Materials | 1 | $18B |
|
||
Price history
+401.7% since first listed8 events — show timeline
- 2026-05-19 Listed $114,900 West Penn MLS
- 2014-09-19 Sold (Public Records) $38,500 Public Records
- 2014-09-18 Price Changed $38,500 West Penn MLS
- 2014-09-17 Price Changed $42,900 West Penn MLS
- 2014-09-17 Sold (MLS) $38,500 West Penn MLS
- 2014-06-24 Listed $42,900 West Penn MLS
- 1999-05-20 Sold (MLS) $17,600 West Penn MLS
- 1998-06-03 Listed $22,900 West Penn MLS
Property tax history
+6.2%/yrLatest (2026): $958 · +0.0% YoY. Source: county tax records.
Cash-flow waterfall
monthlySold comps — $/sqft
last 12 mo · ≤1 miLoading sold comps…