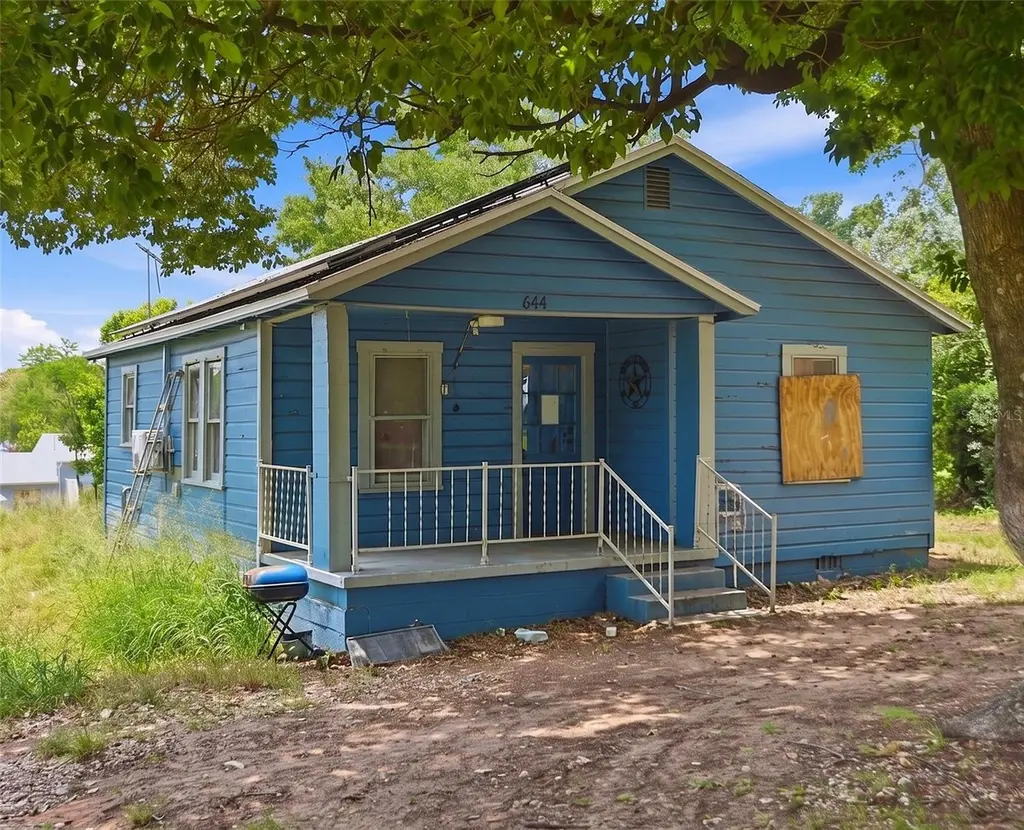
644 S 6th St · Lake Wales, FL
Flood risk 1/10 · Minimal
- FEMA flood zone
- X (unshaded)
- Chance of flooding over 30 yrs
- 0.0%
- Est. flood insurance / yr
- $507 – $1,088
Fire risk 4/10 · Minor
- Est. fire insurance / yr
- $947 – $1,759
Heat risk 8/10 · Major
- Hot days now (above 108°F)
- 7 days/yr
- Hot days in 30 yrs
- 23 days/yr
Wind risk 10/10 · Severe
- Chance of severe wind over 30 yrs
- 99.0%
Air-quality risk 2/10 · Minimal
- Unhealthy air days now
- 0 days/yr
- Unhealthy air days in 30 yrs
- 2 days/yr
Risk factors via First Street. Map © Google.
Why this score? — see what drove the C grade
The composite is a weighted blend of 9 inputs, each scored 0–100. Each bar is that input's sub-score; the figure is the points it added to the 100-point composite (weight × sub-score).
- Cash flow +21.0/30.0
- 1% rule +8.5/10.0
- ARV discount +7.5/15.0
- DSCR +6.7/10.0
- Schools +3.5/10.0
- Livability +3.4/5.0
- Rent growth +2.5/5.0
- Condition / age +2.5/5.0
- Appreciation +0.0/10.0
$89,900
🖨 Deal sheet 📄 Offer letter ✓ Due diligence
Listing remarks
Virtually Staged. 644 S 6th Street in Lake Wales, Florida, a two-bedroom, one-bathroom single family home positioned on a generous 0.3 acre corner lot within Polk County and the 33853 zip code. With 724 square feet of comfortable interior living space set on an expansive corner homesite, this Lake Wales property is in great overall condition with clear potential value, providing more usable yard space, street frontage, and visibility than typical interior neighborhood parcels. Originally built in 1952 with traditional frame construction on a crawlspace foundation, this mid-century Lake Wales home supports ventilation, easier service access under the home, and the architectural character dra
Key facts
- 0.3 acre corner lot
- Solar panels
- No hoa
Tags
Property features AI
Finance
- Other: Property zoned C-2; Lot about 0.3 acre (approx. 92.7 x 140); Furnished; Solar energy generation
- HOA & community: No HOA
Exterior
- Utilities: Well water; Septic tank; Other utilities
- Home design: Single-family residence; 1 story; Faces east; Homestead exempt
- Construction: Other construction materials; Other roof; Pillar/Post/Pier foundation; Built on one level
- Exterior features: Front porch; Other exterior features
Interior
- Kitchen: Range
- Bedrooms: 2 bedrooms
- Flooring: Wood and other flooring
- Bathrooms: 1 full bathroom
- Heating & cooling: Central heating; Central air; Wall/window unit(s)
- Interior features: Ceiling fans
- Laundry & utility: Laundry: Other
Neighborhood map
What this means for you Summary
Snapshot
- This is a 2-bed/1.0-bath single-family listed at $90k.
Deal economics
- At list price, monthly cash flow is $127 ($2k/yr) — positive.
- The deal already cash-flows at list — no discount required.
- Meets the 1% rule at list price ($1k rent vs $90k).
Location & tenants
- Location reads 68/100 on livability (#535 in FL) — a middle-class / working-renter tenant base. Strengths: cost of living A+, housing A+; Watch: employment D+, amenities F, commute F.
- Polk (suburban): math 39% / reading 43% proficiency, ranked #62 of 73 in FL (top 85%) — families likely to look elsewhere, expect single-tenant / working-renter base with shorter leases.
- Zoned schools: Frostproof Ben Hill Griffin Jr Elementary School (math 34% / reading 36%, grade F, #1,697 of 2,144 statewide, top 80%, 917 students, 66% FRL); Frostproof Middle/Senior High (math 34% / reading 34%, grade F, #394 of 667 statewide, top 60%, 1,150 students, 60% FRL) — zoned schools at 63% FRL track the district average.
- Market conditions: 182 active listings in the ZIP; 7 comparable units currently listed for rent nearby; rentals at typical pace (median 24d on market — plan ~3-4 weeks tenant-placement turnaround); 10,384 units permitted in Polk County in 2024 (1,716 in 5+ unit buildings).
Forward outlook
- Local home prices are declining (-3.0%/yr); year-one equity from $622 of loan paydown is wiped out by about $3k of value loss. Plan a longer hold.
- Polk County population projected at +33% by 2050 — long-run rental-demand tailwind backs the buy-and-hold thesis.
Negotiation context
- Only 13 days on market — expect competitive offers; lowballing is unlikely to land.
Risks & watch-outs
- Watch-outs: property tax is 4.3% of price; built in 1952 — expect roof / HVAC / electrical / plumbing capex.
- Climate carrying-cost: severe wind risk, 99% chance of damaging wind over 30y; extreme-heat days projected 7→23/yr by 2055 (HVAC capex compounding) — expect insurance premiums to compound above CPI over the hold.
Questions for the listing agent
- Built in 1952 — when were the roof, HVAC, electrical panel, plumbing, and water heater last replaced?
- Property tax is high relative to price — has the assessment been appealed recently, and will the sale trigger a re-assessment?
- Is there a deadline driving the sale (1031 exchange, divorce, estate, relocation)? That informs how much negotiation room exists.
- Schools are D-rated, which usually means shorter tenancies and higher turnover. Who's the typical renter profile here, and what's been the actual vacancy rate?
- What's the average days-on-market for RENTAL listings here right now (not sales)? A rising rental-DOM trend means longer vacancies and softer asking-rent achievability than the comps imply.
- What's the recent tenant-quality profile in this submarket — average credit score on applications, eviction rate, late-payment / NSF rate, and stable-employment percentage? A property-management company in the area should have these aggregated.
- How much new for-sale + rental construction is in the pipeline within 1–3 miles? Heavy new supply typically softens prices + rents 12–24 months out; constrained supply supports both.
Investment metrics
- 1% rule
- 1.35% ✓
- Cap rate
- 7.98%
- Cash-on-cash
- 6.04%
- DSCR
- 1.27
- GRM
- 6.2
CMA / ARV
No comps found within radius.
Projected returns pro-forma
-3.0% appreciation · 3.0% rent growth · sell at horizon
- IRR
- -6.8%
- Equity multiple
- 0.75×
- Total profit
- $-6,350
- Equity at exit
- $13,404
- IRR
- 3.0%
- Equity multiple
- 1.22×
- Total profit
- $5,457
- Equity at exit
- $7,773
Cash invested: $25,172 (down + closing). Projections, not guarantees.
Landlord ↔ Tenant lean methodology
- Overall (STATE)
- 87 Strongly Landlord-Friendly
- State Florida
- 87 Strongly Landlord-Friendly · R+3
- County
- — inherits STATE
- City
- — inherits STATE
ZIP-level market 33853
- Home prices YoY
- -9.2%
- Active inventory
- 182
- Price-to-rent
- 6.2×
Monthly cashflow live
- Estimated rent
- $1,210 high interval (Pro) →
- Mortgage (P&I)
- −$471
- Tax from tax record
- −$320 /mo · $3,845/yr
- Insurance
- −$37
- HOA
- −$0
- Vacancy / Maint / Mgmt
- −$254
- Net cashflow
- $127
Break-even live
UW: 25.0% down · 7.5% · 30yr · 1.5% tax · 5.0% vac · 8.0% maint · 8.0% mgmt
Financing live
Cash to close
- Down payment
- $22,475
- Closing costs
- $2,697
- Reserves months
- —
- Total cash needed
- —
Loan-product check · same deal, 3 products live
Conventional
25% down · 7.5% · 30yr
- Down + closing
- —
- Monthly P&I
- —
- Monthly cashflow
- —
- DSCR
- —
- Eligible?
- —
Personal DTI + credit; lowest rate.
DSCR
20% down · 8.5% · 30yr
- Down + closing
- —
- Monthly P&I
- —
- Monthly cashflow
- —
- DSCR
- —
- Eligible?
- —
No personal income docs; deal must DSCR.
Hard money
10% down · 12.0% · 12mo
- Down + closing
- —
- Monthly P&I
- —
- Monthly cashflow
- —
- DSCR
- —
- Eligible?
- —
Short-term bridge; refi at stabilization.
Rent comps 7 comps
| Address | Beds | Baths | Sqft | Rent | $/sqft | DOM | Units | Dist |
|---|---|---|---|---|---|---|---|---|
| 918 S Scenic Hwy Lake Wales, FL | 1.0 | 1.0 | 600 | $1,500 | $2.50 | 23d | 1 | 0.37mi |
| 335 E Central Ave Lake Wales, FL | 2.0 | 1.0 | 450 | $995 | $2.21 | 14d | 1 | 0.76mi |
| 244 E Park Ave Unit 203 Lake Wales, FL | 1.0 | 1.0 | 614 | $1,400 | $2.28 | 23d | 1 | 0.91mi |
| 104 W Stuart Ave Lake Wales, FL | 2.0 | 1.0 | 720 | $1,100 | $1.53 | 3d | 1 | 1.06mi |
| 711 Springer Dr Lake Wales, FL | 1.0–2.0 | 1.0–2.0 | 848 | $1,400 | $1.65 | 3d | 2 | 1.14mi |
| 414 1/2 S Miami St Unit A Lake Wales, FL | 1.0 | 1.0 | 544 | $700 | $1.29 | 23d | 1 | 1.15mi |
| 414 1/2 S Miami St Unit B Lake Wales, FL | 1.0 | 1.0 | 544 | $650 | $1.19 | 23d | 1 | 1.15mi |
Listing history 10 events
-
2026-06-10status $89,900 Pending 13 DOM
-
2026-06-09days on market $89,900 Active 13 DOM
-
2026-06-08days on market $89,900 Active 12 DOM
-
2026-06-07days on market $89,900 Active 11 DOM
-
2026-06-05days on market $89,900 Active 8 DOM
-
2026-06-03days on market $89,900 Active 7 DOM
-
2026-06-03pricedays on market $89,900 Active 6 DOM
-
2026-06-01days on market $99,900 Active 5 DOM
-
2026-05-31days on market $99,900 Active 4 DOM
-
2026-05-27$99,900 Active
ⓘ Source: listings_history table (triggers on properties + properties_extension) + one-shot
backfill from property_details.listing_events for pre-trigger history.
Tax reassessment forecast FL · Resets to sale price
- Current annual tax
- $3,845 · $320/mo
- Projected year-2 tax
- $3,845 · $320/mo
- Expected delta
- $0/yr ($0/mo · 0.0%)
ⓘ Screening estimate from a state-policy table — verify with the county assessor before closing.
Climate risk First Street
- Flood 1/10 Low FEMA zone X (unshaded) · 0% chance over 30 yrs
- Wildfire 4/10 Moderate
- Heat 8/10 Severe 7 d/yr ≥108°F today · 23 d/yr by 30 yrs out
- Wind 10/10 Extreme 99% chance of damaging wind over 30 yrs
- Air quality 2/10 Low 0 unhealthy d/yr today · 2 by 30 yrs out
Nearby sold comps map
Loading sold comps map…
Walkable amenities ~0.75 mi
Loading nearby amenities…
Taxation est. · year 1
- Rental income
- $14,523
- − Mortgage interest
- −$5,036
- − Property taxes
- −$3,845
- − Insurance
- −$450
- − Repairs & maintenance
- −$1,162
- − Management
- −$1,162
- − Depreciation
- −$2,615
- Taxable income
- $253
- Est. tax owed @ 24.0%
- −$61
- After-tax cash flow
- $1,460/yr
For passive investors: Depreciation is non-cash, so a rental often shows a tax loss while cash-flowing — sheltering income. Rental losses are passive: they offset passive income freely, and up to $25,000/yr can offset ordinary (W-2) income if you actively participate and your MAGI is under $100k (phasing out to $0 by $150k); unused losses carry forward. On sale, claimed depreciation is recaptured at up to 25%, and gains may owe capital-gains tax (a 1031 exchange can defer both). Figures are a year-1 estimate at your 24.0% rate — not tax advice; consult a CPA.
Schools (NCES district)
- District
- Polk
- NCES district ID
- 1201590
- Math proficiency
- 39% ▼ -11.00%
- Reading proficiency
- 43% ▼ -4.00%
- Median HH income
- $43,979
- Composite
- 34.74/100
- National rank
- #5132
- State rank
- #62 of 73 in FL
Livability — Lake Wales
- Score
- 68/100
- State rank
- #535
- US rank
- #10036
Category grades
Schools grade is shown separately in the Schools card above.
Census & demographics
- Census place
- Lake Wales, FL
- City population
- 30,351
- Population (ZIP)
- 12,385
Population outlook (Polk County) Hauer SSP2
- Today (2025)
- 752,975 people
- By 2030
- 804,621 · +6.9%
- By 2040
- 906,117 · +20.3%
- By 2050
- 1,000,476 · +32.9%
- By 2075
- 1,197,520 · +59.0%
- By 2100
- 1,271,518 · +68.9%
Race, ethnicity, and origin ACS 2023
- Neighborhood character
- Diverse neighborhood (Simpson 0.65)
- Race & ethnicity
- White 42% Hispanic / Latino 36% Black 19% Two or more races 16%
- Hispanic origin (detail)
- Mexican 10% Puerto Rican 18% Cuban 2% Dominican 1%
- Common ancestry
- Romanian 2% Slovak 1% Lithuanian 1%
- Foreign-born
- 10% · Canada
- Languages at home
- 72% English-only · Spanish 27%
Political lean MEDSL · Polk
- 2024 margin
- Strong R (+20.7) · D 39.2% · R 59.9%
- 2008→2024 swing
- -14.6pp toward R · 2008: -6.1pp · 2024: -20.7pp
- All cycles
- 2024: R+20.7 2020: R+14.4 2016: R+14.1 2012: R+6.8 2008: R+6.1
Not yet ingested
- Civics
- —
Market trends
- HPI YoY
- ▼ -33.98%
- Current HPI
- 333.8292
- Rent YoY
- —
- Metro
- —
- State GDP YoY
- ▲ 3.28%
- F500 in state
- 36
Industry mix (Fortune 500 HQ in FL)
| Industry | F500 HQs | Revenue |
|---|---|---|
| Industrial Technology | 2 | $29B |
|
||
| Insurance | 2 | $17B |
|
||
| Retail | 1 | $60B |
|
||
| Technology Distribution | 1 | $58B |
|
||
| Homebuilding | 1 | $35B |
|
||
| Technology Manufacturing | 1 | $35B |
|
||
Price history
1 event — show timeline
- 2026-05-27 Listed $99,900 Stellar MLS as Distributed by MLS Grid
Property tax history
+14.4%/yrLatest (2025): $3,845 · +1.7% YoY. Source: county tax records.
Cash-flow waterfall
monthlySold comps — $/sqft
last 12 mo · ≤1 miLoading sold comps…