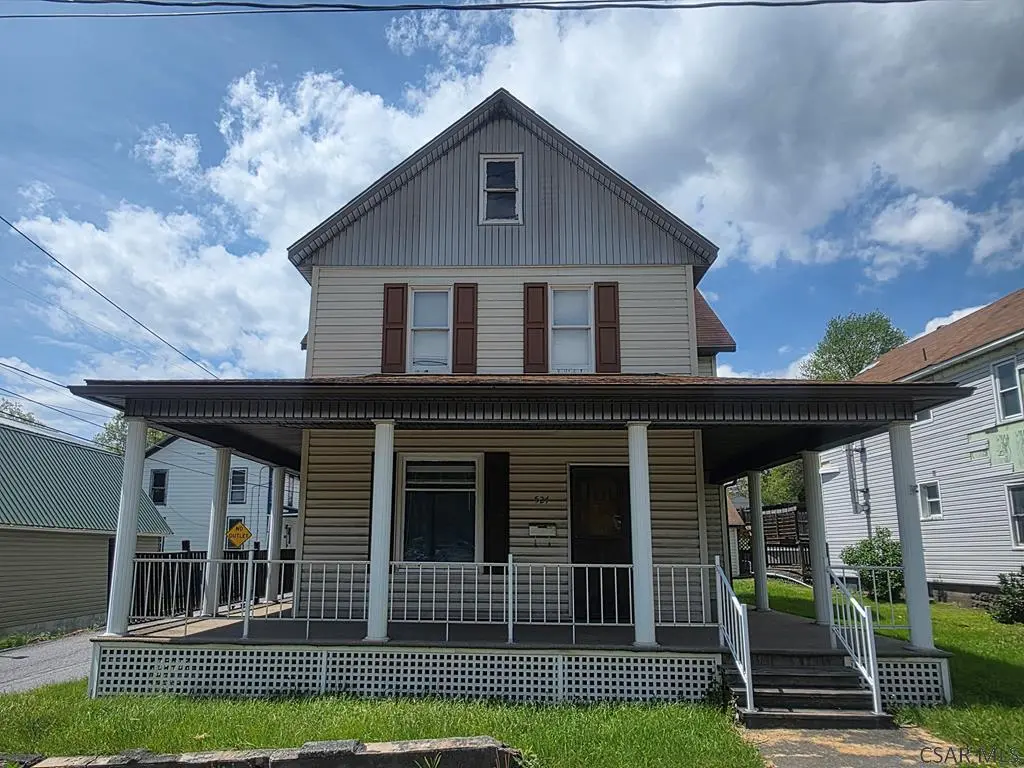
524 Main St · Scalp Level, PA
Flood risk 6/10 · Moderate
- FEMA flood zone
- AO
- Chance of flooding over 30 yrs
- 0.75%
- Est. flood insurance / yr
- $1,327 – $3,136
Fire risk 1/10 · Minimal
- Est. fire insurance / yr
- $511 – $949
Heat risk 3/10 · Minor
- Hot days now (above 91°F)
- 7 days/yr
- Hot days in 30 yrs
- 19 days/yr
Wind risk 2/10 · Minimal
- Chance of severe wind over 30 yrs
- —
Air-quality risk 2/10 · Minimal
- Unhealthy air days now
- 0 days/yr
- Unhealthy air days in 30 yrs
- 1 days/yr
Risk factors via First Street. Map © Google.
Why this score? — see what drove the D+ grade
The composite is a weighted blend of 9 inputs, each scored 0–100. Each bar is that input's sub-score; the figure is the points it added to the 100-point composite (weight × sub-score).
- Cash flow +15.0/30.0
- ARV discount +7.5/15.0
- 1% rule +5.0/10.0
- DSCR +5.0/10.0
- Schools +4.4/10.0
- Livability +3.2/5.0
- Rent growth +2.5/5.0
- Condition / age +2.5/5.0
- Appreciation +0.0/10.0
$42,500
🖨 Deal sheet 📄 Offer letter ✓ Due diligence
Listing remarks MLS
Nice roomy home. .. low taxes, oversized one car garage. .nice large din. room, living room, eat in kit w/ bar & Laminate wood floors. .. roomy pantry off kitchen w/ 1/2 bath. .closet and room for washer & dryer. .. Oil hot water and Coal/Wood Furnace. .Wrap around country porch. .This property is a must see. .priced to sell. .move right in and take your time painting and updating at your leisure. nice playground across the street, vinyl sided. .. call to view today!!!! Lots and lots of home for the money!!!!DON'T MISS THIS ONE. .. SEE TODAY!!!!!
Key facts
- 5,227 sq ft lot
- Garage
- Listed 27 days
Property features AI
Exterior
- Parking: Detached garage (1 car); Additional parking: dirt and crushed rock
- Utilities: Public water; Public sewer (sewer available)
- Home design: Single family residence; Two levels / 2 stories
- Construction: Frame, vinyl siding, and block construction; Composition roof; Has basement
- Exterior features: Covered porch; Porch; Corner lot; Rectangular lot
Interior
- Kitchen: Range; Oven
- Flooring: Carpet; Vinyl
- Bathrooms: One full bathroom
- Heating & cooling: Hot water heating; Oil heating
- Interior features: Eat-in kitchen; High-speed internet access; Window coverings; Double-pane windows; Unfinished basement
Neighborhood map
What this means for you Summary
Snapshot
- This is a 3-bed/1.0-bath single-family listed at $42k.
Deal economics
- At list price, monthly cash flow is $934 ($11k/yr) — positive.
- The deal already cash-flows at list — no discount required.
- Meets the 1% rule at list price ($2k rent vs $42k).
- Recommended offer: $42k (1.5% below list) — sets the bar for market timing.
Location & tenants
- Location reads 64/100 on livability (#1,230 in PA) — a middle-class / working-renter tenant base. Strengths: cost of living A+, housing A+, health & safety A+; Watch: crime D+, schools F, amenities F.
- Windber Area SD (suburban): math 45% / reading 60% proficiency, ranked #166 of 539 in PA (top 31%) — acceptable for families but not a draw, mixed tenant base, ~2y average lease.
- Market conditions: 45 active listings in the ZIP; 1 comparable units currently listed for rent nearby; 64 units permitted in Cambria County in 2024 (0 in 5+ unit buildings).
Forward outlook
- Local home prices are declining (-3.0%/yr); year-one equity from $294 of loan paydown is wiped out by about $1k of value loss. Plan a longer hold.
- Cambria County population projected at -28% by 2050 — secular population decline; favor cash flow + early exit over multi-decade hold.
- At projected returns (-3.0% appreciation + 3.0% rent growth), your $12k cash investment doubles in ~2 years — after that, you're playing with house money.
Negotiation context
- It's been on market 27 days — a 2% lower offer ($42k) is reasonable based on typical stale-listing flexibility.
Risks & watch-outs
- Watch-outs: property tax is 2.8% of price; flood insurance adds $186/mo.
- Climate carrying-cost: in FEMA flood zone AO (mandatory federal flood insurance) — expect insurance premiums to compound above CPI over the hold.
Questions for the listing agent
- Property tax is high relative to price — has the assessment been appealed recently, and will the sale trigger a re-assessment?
- What's the actual annual flood-insurance premium (NFIP or private), and is the property in a SFHA with mandatory coverage?
- Is there a deadline driving the sale (1031 exchange, divorce, estate, relocation)? That informs how much negotiation room exists.
- Schools are F-rated, which usually means shorter tenancies and higher turnover. Who's the typical renter profile here, and what's been the actual vacancy rate?
- Crime grade is D in this area — have there been break-ins, vandalism, or insurance claims at this property in the last 3 years? What carrier currently insures it and at what premium?
- The area grade is low — what's the realistic commute time and amenity access for the typical tenant pool here? Any planned neighborhood developments (good or bad) we should know about?
- What's the average days-on-market for RENTAL listings here right now (not sales)? A rising rental-DOM trend means longer vacancies and softer asking-rent achievability than the comps imply.
- What's the recent tenant-quality profile in this submarket — average credit score on applications, eviction rate, late-payment / NSF rate, and stable-employment percentage? A property-management company in the area should have these aggregated.
- How much new for-sale + rental construction is in the pipeline within 1–3 miles? Heavy new supply typically softens prices + rents 12–24 months out; constrained supply supports both.
Investment metrics
- 1% rule
- 4.35% ✓
- Cap rate
- 37.93%
- Cash-on-cash
- 112.97%
- DSCR
- 6.03
- GRM
- 1.9
CMA / ARV
- ARV (on-the-fly)
- $140,616
- Comps found
- 7
Show comp detail 7 sales within ~0.75 mi
| Address | Dist | Beds/Ba | Sqft | Sold | Price | $/sf | Match |
|---|---|---|---|---|---|---|---|
| 307 Cambria Ave | 0.47mi | 3/2.0 | 1,536 (+2%) | 4mo | $205,000 | $133 | 68 |
| 300 6th St | 0.66mi | 3/1.0 | 1,500 (-1%) | 19mo | $137,694 | $92 | 52 |
| 218 Jefferson Ave | 0.36mi | 3/1.5 | 1,352 (-11%) | 15mo | $90,000 | $67 | 51 |
| 1157 2nd St | 0.69mi | 2/2.0 (-1) | 1,511 (-0%) | 11mo | $89,000 | $59 | 49 |
| 301 8th St | 0.75mi | 3/2.0 | 1,356 (-10%) | 2mo | $160,000 | $118 | 43 |
| 201 7th St | 0.70mi | 4/2.0 (+1) | 1,598 (+6%) | 11mo | $148,000 | $93 | 40 |
| 401 8th St | 0.74mi | 3/1.5 | 1,644 (+9%) | 11mo | $165,000 | $100 | 40 |
Match score weights: distance 35% · size 25% · config 20% · recency 20%. Top-matched comps best support the ARV.
Projected returns pro-forma
-3.0% appreciation · 3.0% rent growth · sell at horizon
- IRR
- 95.2%
- Equity multiple
- 5.44×
- Total profit
- $52,796
- Equity at exit
- $6,337
- IRR
- 97.9%
- Equity multiple
- 11.36×
- Total profit
- $123,299
- Equity at exit
- $3,675
Cash invested: $11,900 (down + closing). Projections, not guarantees.
Landlord ↔ Tenant lean methodology
- Overall (STATE)
- 62 Landlord-Friendly
- State Pennsylvania
- 62 Landlord-Friendly · EVEN
- County
- — inherits STATE
- City
- — inherits STATE
ZIP-level market 15963
- Home prices YoY
- -24.4%
- Active inventory
- 45
- Price-to-rent
- 1.9×
Monthly cashflow live
- Estimated rent
- $1,850 medium interval (Pro) →
- Mortgage (P&I)
- −$223
- Tax from tax record
- −$101 /mo · $1,207/yr
- Insurance
- −$18
- Flood insurance flood zone
- −$186 /mo · $2,232/yr
- HOA
- −$0
- Vacancy / Maint / Mgmt
- −$388
- Net cashflow
- $934
Break-even live
UW: 25.0% down · 7.5% · 30yr · 1.5% tax · 5.0% vac · 8.0% maint · 8.0% mgmt
Financing live
Cash to close
- Down payment
- $10,625
- Closing costs
- $1,275
- Reserves months
- —
- Total cash needed
- —
Loan-product check · same deal, 3 products live
Conventional
25% down · 7.5% · 30yr
- Down + closing
- —
- Monthly P&I
- —
- Monthly cashflow
- —
- DSCR
- —
- Eligible?
- —
Personal DTI + credit; lowest rate.
DSCR
20% down · 8.5% · 30yr
- Down + closing
- —
- Monthly P&I
- —
- Monthly cashflow
- —
- DSCR
- —
- Eligible?
- —
No personal income docs; deal must DSCR.
Hard money
10% down · 12.0% · 12mo
- Down + closing
- —
- Monthly P&I
- —
- Monthly cashflow
- —
- DSCR
- —
- Eligible?
- —
Short-term bridge; refi at stabilization.
Rent comps 1 comps
| Address | Beds | Baths | Sqft | Rent | $/sqft | DOM | Units | Dist |
|---|---|---|---|---|---|---|---|---|
| 213 Sunapee Dr Johnstown, PA | 3.0 | 2.5 | 2087 | $1,850 | $0.89 | 43d | 1 | 0.83mi |
Listing history 17 events
-
2026-06-18days on market $42,500 Active 27 DOM
-
2026-06-17days on market $42,500 Active 26 DOM
-
2026-06-16days on market $42,500 Active 25 DOM
-
2026-06-15days on market $42,500 Active 24 DOM
-
2026-06-13days on market $42,500 Active 22 DOM
-
2026-06-12days on market $42,500 Active 21 DOM
-
2026-06-09days on market $42,500 Active 18 DOM
-
2026-06-08days on market $42,500 Active 17 DOM
-
2026-06-08days on market $42,500 Active 16 DOM
-
2026-06-07days on market $42,500 Active 15 DOM
-
2026-06-04days on market $42,500 Active 12 DOM
-
2026-06-02days on market $42,500 Active 11 DOM
-
2026-06-01days on market $42,500 Active 10 DOM
-
2026-05-31days on market $42,500 Active 9 DOM
-
2026-05-21$42,500 Active
-
2015-05-30soldstatus $44,000 566-char remark
Show marketing remark (566 chars)
Nice roomy home. .. low taxes, oversized one car garage. .nice large din. room, living room, eat in kit w/ bar & Laminate wood floors. .. roomy pantry off kitchen w/ 1/2 bath. .closet and room for washer & dryer. .. Oil hot water and Coal/Wood Furnace. .Wrap around country porch. .This property is a must see. .priced to sell. .move right in and take your time painting and updating at your leisure. nice playground across the street, vinyl sided. .. call to view today!!!! Lots and lots of home for the money!!!!DON'T MISS THIS ONE. .. SEE TODAY!!!!!
-
2015-05-01soldstatus $44,000
ⓘ Source: listings_history table (triggers on properties + properties_extension) + one-shot
backfill from property_details.listing_events for pre-trigger history.
Tax reassessment forecast PA · Partial reset (capped growth)
- Current annual tax
- $1,207 · $101/mo
- Projected year-2 tax
- $1,207 · $101/mo
- Expected delta
- $0/yr ($0/mo · 0.0%)
ⓘ Screening estimate from a state-policy table — verify with the county assessor before closing.
Climate risk First Street
- Flood 6/10 Major FEMA zone AO · 75% chance over 30 yrs
- Wildfire 1/10 Low
- Heat 3/10 Moderate 7 d/yr ≥91°F today · 19 d/yr by 30 yrs out
- Wind 2/10 Low
- Air quality 2/10 Low 0 unhealthy d/yr today · 1 by 30 yrs out
Nearby sold comps map
Loading sold comps map…
Walkable amenities ~0.75 mi
Loading nearby amenities…
Taxation est. · year 1
- Rental income
- $22,200
- − Mortgage interest
- −$2,381
- − Property taxes
- −$1,207
- − Insurance
- −$2,444
- − Repairs & maintenance
- −$1,776
- − Management
- −$1,776
- − Depreciation
- −$1,236
- Taxable income
- $11,380
- Est. tax owed @ 24.0%
- −$2,731
- After-tax cash flow
- $8,481/yr
For passive investors: Depreciation is non-cash, so a rental often shows a tax loss while cash-flowing — sheltering income. Rental losses are passive: they offset passive income freely, and up to $25,000/yr can offset ordinary (W-2) income if you actively participate and your MAGI is under $100k (phasing out to $0 by $150k); unused losses carry forward. On sale, claimed depreciation is recaptured at up to 25%, and gains may owe capital-gains tax (a 1031 exchange can defer both). Figures are a year-1 estimate at your 24.0% rate — not tax advice; consult a CPA.
Schools (NCES district)
- District
- Windber Area SD
- NCES district ID
- 4226610
- Math proficiency
- 45% ▼ -14.00%
- Reading proficiency
- 60% ▼ -13.00%
- Median HH income
- $36,802
- Composite
- 43.54/100
- National rank
- #2985
- State rank
- #166 of 539 in PA
Livability — Scalp Level
- Score
- 64/100
- State rank
- #1230
- US rank
- #14673
Category grades
Schools grade is shown separately in the Schools card above.
Census & demographics
- Census place
- Scalp Level, PA
- Population (ZIP)
- 10,383
Population outlook (Cambria County) Hauer SSP2
- Today (2025)
- 122,754 people
- By 2030
- 115,827 · -5.6%
- By 2040
- 101,309 · -17.5%
- By 2050
- 88,379 · -28.0%
- By 2075
- 65,237 · -46.9%
- By 2100
- 46,909 · -61.8%
Race, ethnicity, and origin ACS 2023
- Neighborhood character
- Predominantly White (96%)
- Race & ethnicity
- White 96% Hispanic / Latino 3% Two or more races 2%
- Common ancestry
- Romanian 17% Slovak 3% Iranian 3%
- Foreign-born
- 0%
- Languages at home
- 98% English-only · Spanish 2%
Political lean MEDSL · Cambria
- 2024 margin
- Solid R (+39.7) · D 29.8% · R 69.5%
- 2008→2024 swing
- -40.4pp toward R · 2008: 0.7pp · 2024: -39.7pp
- All cycles
- 2024: R+39.7 2020: R+37.3 2016: R+37.8 2012: R+17.8 2008: D+0.7
Not yet ingested
- Civics
- —
Market trends
- HPI YoY
- ▼ -45.99%
- Current HPI
- 142.2017
- Rent YoY
- —
- Metro
- —
- State GDP YoY
- ▲ 1.68%
- F500 in state
- 34
Industry mix (Fortune 500 HQ in PA)
| Industry | F500 HQs | Revenue |
|---|---|---|
| Healthcare | 2 | $309B |
|
||
| Insurance | 2 | $27B |
|
||
| Telecommunications / Media | 1 | $124B |
|
||
| Industrial Distribution | 1 | $22B |
|
||
| Financial Services | 1 | $20B |
|
||
| Chemicals / Materials | 1 | $18B |
|
||
Price history
-3.4% since first listed3 events — show timeline
- 2026-05-21 Listed $42,500 CSMLS
- 2015-05-30 Sold (MLS) $44,000 CSMLS
- 2015-05-01 Sold (Public Records) $44,000 Public Records
Property tax history
+2.6%/yrLatest (2026): $1,207 · +2.8% YoY. Source: county tax records.
Cash-flow waterfall
monthlySold comps — $/sqft
last 12 mo · ≤1 miLoading sold comps…