 Fourplex
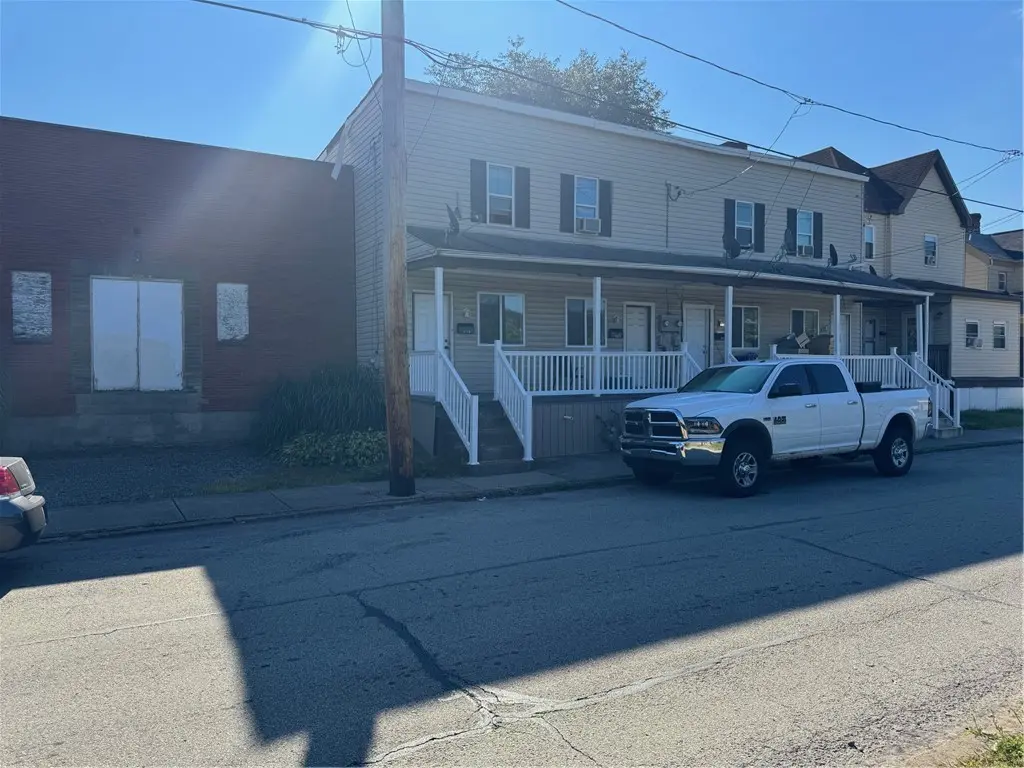
607-609 1/2 Allegheny Ave · Glassport, PA
Flood risk 9/10 · Severe
- FEMA flood zone
- X (unshaded)
- Chance of flooding over 30 yrs
- 0.99%
- Est. flood insurance / yr
- $473 – $860
Fire risk 1/10 · Minimal
- Est. fire insurance / yr
- $511 – $949
Heat risk 4/10 · Minor
- Hot days now (above 97°F)
- 7 days/yr
- Hot days in 30 yrs
- 20 days/yr
Wind risk 2/10 · Minimal
- Chance of severe wind over 30 yrs
- —
Air-quality risk 5/10 · Moderate
- Unhealthy air days now
- 8 days/yr
- Unhealthy air days in 30 yrs
- 8 days/yr
Risk factors via First Street. Map © Google.
Why this score? — see what drove the C+ grade
The composite is a weighted blend of 9 inputs, each scored 0–100. Each bar is that input's sub-score; the figure is the points it added to the 100-point composite (weight × sub-score).
- Cash flow +22.4/30.0
- ARV discount +7.5/15.0
- DSCR +7.2/10.0
- 1% rule +5.9/10.0
- Appreciation +5.1/10.0
- Condition / age +3.8/5.0
- Livability +3.6/5.0
- Schools +2.8/10.0
- Rent growth +2.5/5.0
$369,000
🖨 Deal sheet 📄 Offer letter ✓ Due diligence
Multi-family units
County records classify this as Multi-Family (2-4 Unit). Listing-text estimate: 4 units. confirmed
Listing remarks MLS
Fully Renovated 4-Unit multi-Plex | Cap Rate: 14.6% This turnkey 4-unit property was fully remodeled in May 2024, eliminating the headaches of deferred maintenance and positioning it as a high-yield investment. Tenants pay their own utilities. Recent Upgrades: New kitchens, Stoves, and Refrigerators; new full bathrooms; updated flooring throughout; new plumbing with PEX fixtures, shut-off valves, and new hot water tanks; new 90% efficient gas furnaces were installed in each unit; new sewer lines. Select units that have been upgraded with new windows and electrical panels. Investment Highlights: Cap Rate: 14.6% Strong cash flow with updated mechanicals and finishes Annual Leases, Low near-term maintenance risk due to extensive renovations, Multiple units were already modernized, making them attractive to quality tenants. This property combines IMMEDIATE INCOME with long-term stability, making it ideal for investors seeking both yield and reduced capital expenditure risk.
Key facts
- Fully renovated
- New kitchens
- New plumbing
Tags
Neighborhood map
What this means for you Summary
Snapshot
- This is a 4 × 2-bed/1.0-bath units multifamily listed at $369k. Condition is rated good.
Deal economics
- At list price, monthly cash flow is $558 ($7k/yr) — positive. Per door: $139/mo.
- The deal already cash-flows at list — no discount required.
- Meets the 1% rule at list price ($4k rent vs $369k).
- Recommended offer: $325k (12.0% below list) — sets the bar for market timing.
Location & tenants
- Location reads 71/100 on livability (#716 in PA) — a middle-class / working-renter tenant base. Strengths: cost of living A+, housing A+, commute A-; Watch: crime C-, employment D+, schools D-.
- South Allegheny SD (suburban): math 23% / reading 44% proficiency, ranked #430 of 539 in PA (top 80%) — families likely to look elsewhere, expect single-tenant / working-renter base with shorter leases.
- Market conditions: 24 active listings in the ZIP; 2,996 units permitted in Allegheny County in 2024 (1,588 in 5+ unit buildings).
Forward outlook
- In year one you build about $3k of equity ($3k loan paydown + $658 appreciation (0.2% local appreciation)).
- At projected returns (0.2% appreciation + 3.0% rent growth), your $103k cash investment doubles in ~8 years — after that, you're playing with house money.
- By year 8, paydown + projected appreciation supports a ~$31k cash-out refi (75% LTV) — recoverable capital for the next deal without selling this one.
Negotiation context
- It's been on market 223 days — a 12% lower offer ($325k) is reasonable based on typical stale-listing flexibility.
- 2 sale attempts with the ask held roughly flat each time — persistent listings suggest the price (not the market) is what's stuck; bring a comps-based counter.
Risks & watch-outs
- Watch-outs: flood insurance adds $56/mo; built in 1916 — expect roof / HVAC / electrical / plumbing capex.
- Climate carrying-cost: severe flood risk — expect insurance premiums to compound above CPI over the hold.
Questions for the listing agent
- It's been on market 223 days. Have you received any prior offers? Is the seller open to a 12% concession, seller financing, or rate buy-down credit?
- Can we see the unit-by-unit rent roll, current vacancy, and any below-market leases? What's the average tenancy length?
- What capital expenditures (roof, boiler, parking lot, exteriors) have been made in the last 5 years, and what's planned in the next 2?
- Built in 1916 — when were the roof, HVAC, electrical panel, plumbing, and water heater last replaced?
- What's the actual annual flood-insurance premium (NFIP or private), and is the property in a SFHA with mandatory coverage?
- Why hasn't it sold? Are there any deal-killer items the seller is aware of (foundation, flood, title, zoning, code violations)?
- Is there a deadline driving the sale (1031 exchange, divorce, estate, relocation)? That informs how much negotiation room exists.
- Schools are D-rated, which usually means shorter tenancies and higher turnover. Who's the typical renter profile here, and what's been the actual vacancy rate?
- What's the average days-on-market for RENTAL listings here right now (not sales)? A rising rental-DOM trend means longer vacancies and softer asking-rent achievability than the comps imply.
- What's the recent tenant-quality profile in this submarket — average credit score on applications, eviction rate, late-payment / NSF rate, and stable-employment percentage? A property-management company in the area should have these aggregated.
- How much new apartment / multifamily construction is in the pipeline within 1–3 miles? Heavy new supply (>2% of stock underway) typically softens rents 12–24 months out; light construction supports rent growth.
Investment metrics
- 1% rule
- 1.09% ✓
- Cap rate
- 8.29%
- Cash-on-cash
- 7.12%
- DSCR
- 1.32
- GRM
- 7.7
CMA / ARV
No comps found within radius.
Show comp detail 2 sales within ~0.75 mi
| Address | Dist | Beds/Ba | Sqft | Sold | Price | $/sf | Match |
|---|---|---|---|---|---|---|---|
| 425 Ohio Ave | 0.16mi | 9/5.0 (+1) | — | 10mo | $200,000 | — | 62 |
| 730 Indiana Ave | 0.33mi | 7/3.0 (-1) | — | 16mo | $60,000 | — | 50 |
Match score weights: distance 35% · size 25% · config 20% · recency 20%. Top-matched comps best support the ARV.
Projected returns pro-forma
0.18% appreciation · 3.0% rent growth · sell at horizon
- IRR
- 5.6%
- Equity multiple
- 1.27×
- Total profit
- $27,912
- Equity at exit
- $110,446
- IRR
- 10.6%
- Equity multiple
- 2.18×
- Total profit
- $122,354
- Equity at exit
- $135,423
Cash invested: $103,320 (down + closing). Projections, not guarantees.
Landlord ↔ Tenant lean methodology
- Overall (STATE)
- 62 Landlord-Friendly
- State Pennsylvania
- 62 Landlord-Friendly · EVEN
- County
- — inherits STATE
- City
- — inherits STATE
ZIP-level market 15045
- Home prices YoY
- 0.1%
- Active inventory
- 24
- Price-to-rent
- 30.7×
Monthly cashflow live
- Estimated rent
- $4,004 high interval (Pro) →
- Mortgage (P&I)
- −$1,935
- Tax est. 1.5%
- −$461 /mo · $5,535/yr
- Insurance
- −$154
- Flood insurance flood zone
- −$56 /mo · $666/yr
- HOA
- −$0
- Vacancy / Maint / Mgmt
- −$841
- Net cashflow
- $558
Break-even live
4-unit breakdown (identical units grouped — click to expand)
| Units | Beds | Baths | Est. rent |
|---|---|---|---|
| 4× units | 2 | 1 | $4,004 |
| #1 | 2 | 1 | $1,001 |
| #2 | 2 | 1 | $1,001 |
| #3 | 2 | 1 | $1,001 |
| #4 | 2 | 1 | $1,001 |
| Total (4 units) | $4,004 | ||
UW: 25.0% down · 7.5% · 30yr · 1.5% tax · 5.0% vac · 8.0% maint · 8.0% mgmt
Financing live
Cash to close
- Down payment
- $92,250
- Closing costs
- $11,070
- Reserves months
- —
- Total cash needed
- —
Loan-product check · same deal, 3 products live
Conventional
25% down · 7.5% · 30yr
- Down + closing
- —
- Monthly P&I
- —
- Monthly cashflow
- —
- DSCR
- —
- Eligible?
- —
Personal DTI + credit; lowest rate.
DSCR
20% down · 8.5% · 30yr
- Down + closing
- —
- Monthly P&I
- —
- Monthly cashflow
- —
- DSCR
- —
- Eligible?
- —
No personal income docs; deal must DSCR.
Hard money
10% down · 12.0% · 12mo
- Down + closing
- —
- Monthly P&I
- —
- Monthly cashflow
- —
- DSCR
- —
- Eligible?
- —
Short-term bridge; refi at stabilization.
Listing history 2 events
-
2026-03-03status Active 988-char remark
Show marketing remark (988 chars)
Fully Renovated 4-Unit multi-Plex | Cap Rate: 14.6% This turnkey 4-unit property was fully remodeled in May 2024, eliminating the headaches of deferred maintenance and positioning it as a high-yield investment. Tenants pay their own utilities. Recent Upgrades: New kitchens, Stoves, and Refrigerators; new full bathrooms; updated flooring throughout; new plumbing with PEX fixtures, shut-off valves, and new hot water tanks; new 90% efficient gas furnaces were installed in each unit; new sewer lines. Select units that have been upgraded with new windows and electrical panels. Investment Highlights: Cap Rate: 14.6% Strong cash flow with updated mechanicals and finishes Annual Leases, Low near-term maintenance risk due to extensive renovations, Multiple units were already modernized, making them attractive to quality tenants. This property combines IMMEDIATE INCOME with long-term stability, making it ideal for investors seeking both yield and reduced capital expenditure risk.
-
2025-09-05$369,000 Active 988-char remark
Show marketing remark (988 chars)
Fully Renovated 4-Unit multi-Plex | Cap Rate: 14.6% This turnkey 4-unit property was fully remodeled in May 2024, eliminating the headaches of deferred maintenance and positioning it as a high-yield investment. Tenants pay their own utilities. Recent Upgrades: New kitchens, Stoves, and Refrigerators; new full bathrooms; updated flooring throughout; new plumbing with PEX fixtures, shut-off valves, and new hot water tanks; new 90% efficient gas furnaces were installed in each unit; new sewer lines. Select units that have been upgraded with new windows and electrical panels. Investment Highlights: Cap Rate: 14.6% Strong cash flow with updated mechanicals and finishes Annual Leases, Low near-term maintenance risk due to extensive renovations, Multiple units were already modernized, making them attractive to quality tenants. This property combines IMMEDIATE INCOME with long-term stability, making it ideal for investors seeking both yield and reduced capital expenditure risk.
ⓘ Source: listings_history table (triggers on properties + properties_extension) + one-shot
backfill from property_details.listing_events for pre-trigger history.
Climate risk First Street
- Flood 9/10 Extreme FEMA zone X (unshaded) · 99% chance over 30 yrs
- Wildfire 1/10 Low
- Heat 4/10 Moderate 7 d/yr ≥97°F today · 20 d/yr by 30 yrs out
- Wind 2/10 Low
- Air quality 5/10 Major 8 unhealthy d/yr today · 8 by 30 yrs out
Nearby sold comps map
Loading sold comps map…
Walkable amenities ~0.75 mi
Loading nearby amenities…
Taxation est. · year 1
- Rental income
- $48,048
- − Mortgage interest
- −$20,670
- − Property taxes
- −$5,535
- − Insurance
- −$2,512
- − Repairs & maintenance
- −$3,844
- − Management
- −$3,844
- − Depreciation
- −$10,735
- Taxable income
- $910
- Est. tax owed @ 24.0%
- −$218
- After-tax cash flow
- $6,472/yr
For passive investors: Depreciation is non-cash, so a rental often shows a tax loss while cash-flowing — sheltering income. Rental losses are passive: they offset passive income freely, and up to $25,000/yr can offset ordinary (W-2) income if you actively participate and your MAGI is under $100k (phasing out to $0 by $150k); unused losses carry forward. On sale, claimed depreciation is recaptured at up to 25%, and gains may owe capital-gains tax (a 1031 exchange can defer both). Figures are a year-1 estimate at your 24.0% rate — not tax advice; consult a CPA.
Condition & rehab AI · 14 photos
This fully renovated 4-unit multi-family property is in good condition with recent updates to kitchens, bathrooms, and mechanical systems. It is ready for immediate occupancy and has a strong investment potential with a cap rate of 14.6%.
Value-add opportunities
- Both Paint the exterior walls — Enhances curb appeal and adds value for both resale and rental.
- Both Replace worn-out windows — Improves energy efficiency and adds value for both resale and rental.
Renovation cost estimate screening
Value-add ROI direction
- Both Paint the exterior walls — Enhances curb appeal and adds value for both resale and rental. ↑
- Both Replace worn-out windows — Improves energy efficiency and adds value for both resale and rental. ↑
ⓘ Cost ranges are severity-bucket heuristics (US national rule-of-thumb). Get contractor quotes + a written scope before underwriting a rehab budget.
Schools (NCES district)
- District
- South Allegheny SD
- NCES district ID
- 4221910
- Math proficiency
- 23% ▼ -10.00%
- Reading proficiency
- 44% ▼ -13.00%
- Median HH income
- $40,891
- Composite
- 28.15/100
- National rank
- #6815
- State rank
- #430 of 539 in PA
Livability — Glassport
- Score
- 71/100
- State rank
- #716
- US rank
- #7113
Category grades
Schools grade is shown separately in the Schools card above.
Census & demographics
- Census place
- Glassport, PA
- City population
- 4,400
- Population (ZIP)
- 4,400
Population outlook (Allegheny County) Hauer SSP2
- Today (2025)
- 1,250,282 people
- By 2030
- 1,256,482 · +0.5%
- By 2040
- 1,256,318 · +0.5%
- By 2050
- 1,244,169 · -0.5%
- By 2075
- 1,197,693 · -4.2%
- By 2100
- 1,093,187 · -12.6%
Race, ethnicity, and origin ACS 2023
- Neighborhood character
- Predominantly White (88%)
- Race & ethnicity
- White 88% Hispanic / Latino 6% Black 4% Two or more races 3%
- Hispanic origin (detail)
- Mexican 4%
- Common ancestry
- Romanian 18% Portuguese 6% Serbian 6%
- Foreign-born
- 1% · South Korea, Canada
- Languages at home
- 97% English-only · German/W. Germanic 1% Spanish 1% Korean 1%
Political lean MEDSL · Allegheny
- 2024 margin
- Strong D (+20.3) · D 59.7% · R 39.4%
- 2008→2024 swing
- +4.8pp toward D · 2008: 15.5pp · 2024: 20.3pp
- All cycles
- 2024: D+20.3 2020: D+20.4 2016: D+16.4 2012: D+14.4 2008: D+15.5
Not yet ingested
- Civics
- —
Market trends
- HPI YoY
- ▲ 0.18%
- Current HPI
- 214.7403
- Rent YoY
- —
- Metro
- —
- State GDP YoY
- ▲ 1.68%
- F500 in state
- 34
Industry mix (Fortune 500 HQ in PA)
| Industry | F500 HQs | Revenue |
|---|---|---|
| Healthcare | 2 | $309B |
|
||
| Insurance | 2 | $27B |
|
||
| Telecommunications / Media | 1 | $124B |
|
||
| Industrial Distribution | 1 | $22B |
|
||
| Financial Services | 1 | $20B |
|
||
| Chemicals / Materials | 1 | $18B |
|
||
Price history
2 events — show timeline
- 2026-03-03 Relisted — West Penn MLS
- 2025-09-05 Listed $369,000 West Penn MLS
Cash-flow waterfall
monthlySold comps — $/sqft
last 12 mo · ≤1 miLoading sold comps…