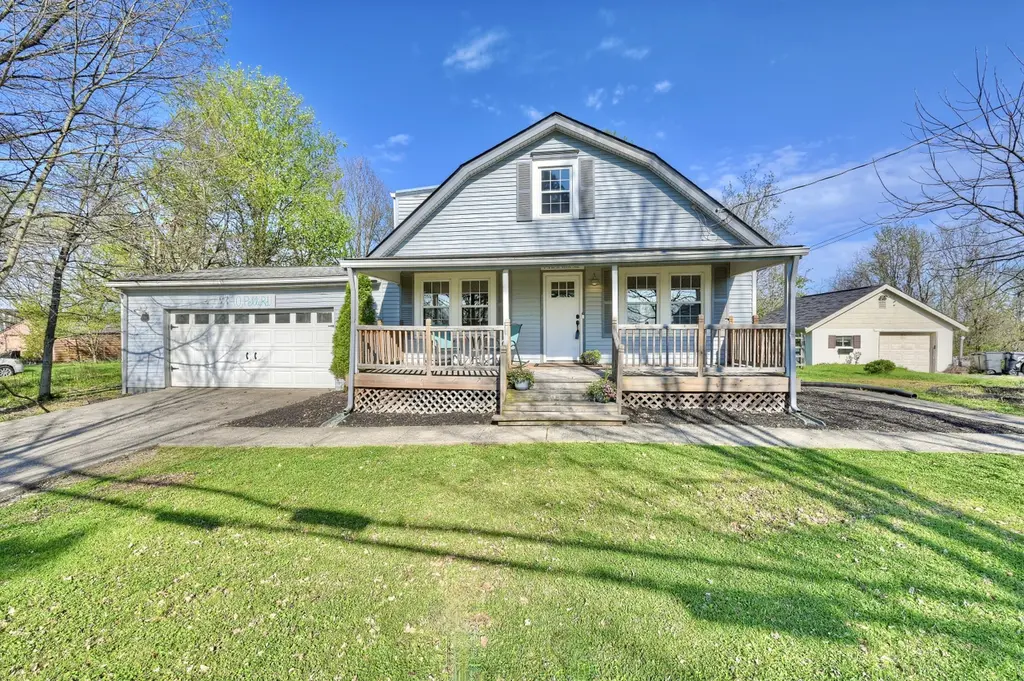
40 Pelly Rd · Independence, KY
Flood risk 1/10 · Minimal
- FEMA flood zone
- X (unshaded)
- Chance of flooding over 30 yrs
- 0.0%
- Est. flood insurance / yr
- $507 – $1,088
Fire risk 3/10 · Minor
- Est. fire insurance / yr
- $839 – $1,559
Heat risk 4/10 · Minor
- Hot days now (above 102°F)
- 7 days/yr
- Hot days in 30 yrs
- 19 days/yr
Wind risk 2/10 · Minimal
- Chance of severe wind over 30 yrs
- 1.0%
Air-quality risk 3/10 · Minor
- Unhealthy air days now
- 2 days/yr
- Unhealthy air days in 30 yrs
- 3 days/yr
Risk factors via First Street. Map © Google.
Why this score? — see what drove the C- grade
The composite is a weighted blend of 9 inputs, each scored 0–100. Each bar is that input's sub-score; the figure is the points it added to the 100-point composite (weight × sub-score).
- Cash flow +14.4/30.0
- ARV discount +14.0/15.0
- DSCR +4.4/10.0
- Schools +4.0/10.0
- Rent growth +3.8/5.0
- Livability +3.6/5.0
- 1% rule +3.3/10.0
- Condition / age +2.5/5.0
- Appreciation +0.0/10.0
$249,900
🖨 Deal sheet (PDF) 📄 Offer letter ✓ Due diligence
Listing remarks MLS
Simply Awesome! Gorgeous "Farmhouse" Style Home*Beautifully Remodeled w. Wood Plank Ceilings/Easy Care Wood Laminate Flooring*Butcher Block Countertops/Stainless Appliances*Stone Backsplash*Stone Surround Fireplace*Oversized 2 Car Garage w. Separate Workshop Space*Large Fenced Yard*Double Driveways (Great for RV's/Boats)*2 New Baths*Newly Remodeled thruout! Buy w. No Money Down USDA Loan!
Key facts
- 2 garage spots
- Listed 4 days
Neighborhood map
What this means for you Summary
Snapshot
- This is a 3-bed/2.0-bath single-family listed at $250k.
Deal economics
- At list price, monthly cash flow is $49 ($592/yr) — positive.
- The deal already cash-flows at list — no discount required.
- To meet the 1% rule (rent ≥ 1% of price), the offer needs to be $208k (16.8% below list).
- Recommended offer: $208k (16.8% below list) — sets the bar for 1% rule.
- Cap rate 6.5% vs local median 3.7% in Independence — top-decile yield for the area; either an underpriced asset or a hidden risk that comps aren't pricing in. Stress-test before assuming the spread holds.
Location & tenants
- Location reads 72/100 on livability (#130 in KY) — a middle-class / working-renter tenant base. Strengths: crime A+, employment A+, cost of living A+; Watch: amenities F, commute F, health & safety F.
- Kenton County (suburban): math 42% / reading 48% proficiency, ranked #14 of 165 in KY (top 8%) — families likely to look elsewhere, expect single-tenant / working-renter base with shorter leases.
- Zoned schools: Woodland Middle School (math 38% / reading 50%, grade D, #40 of 217 statewide, top 19%, 616 students, 48% FRL); Simon Kenton High School (math 40% / reading 44%, grade F, #32 of 254 statewide, top 13%, 1,859 students, 37% FRL).
- Market conditions: Rents rising fast (+5.4%/yr); 258 active listings in the ZIP; solid renter incomes; 699 units permitted in Kenton County in 2024 (287 in 5+ unit buildings).
Forward outlook
- Local home prices are declining (-3.0%/yr); year-one equity from $2k of loan paydown is wiped out by about $7k of value loss. Plan a longer hold.
- Kenton County population projected at +5% by 2050 — modest demand growth; plan on rents tracking national, not racing it.
Negotiation context
- Only 4 days on market — expect competitive offers; lowballing is unlikely to land.
- 4 sale attempts since 8y ago; this cycle's ask has dropped $20k (7%) from the opening price — seller is motivated, your offer sets the floor, not the list.
- Current owner paid $170k; 47% above their basis — modest negotiation headroom, anchor on the comps not their cost.
Questions for the listing agent
- Is there a deadline driving the sale (1031 exchange, divorce, estate, relocation)? That informs how much negotiation room exists.
- Schools are B-rated — typically a magnet for longer-tenancy family renters. What's the average tenant stay here, and is there a school-zone premium baked into asking?
- What's the average days-on-market for RENTAL listings here right now (not sales)? A rising rental-DOM trend means longer vacancies and softer asking-rent achievability than the comps imply.
- What's the recent tenant-quality profile in this submarket — average credit score on applications, eviction rate, late-payment / NSF rate, and stable-employment percentage? A property-management company in the area should have these aggregated.
- How much new for-sale + rental construction is in the pipeline within 1–3 miles? Heavy new supply typically softens prices + rents 12–24 months out; constrained supply supports both.
Investment metrics
- 1% rule
- 0.83% ✗
- Cap rate
- 6.53%
- Cash-on-cash
- 0.85%
- DSCR
- 1.04
- GRM
- 10.0
CMA / ARV
- ARV (on-the-fly)
- $292,080
- Comps found
- 12
Show comp detail 12 sales within ~0.75 mi
| Address | Dist | Beds/Ba | Sqft | Sold | Price | $/sf | Match |
|---|---|---|---|---|---|---|---|
| 40 Pelly Rd | 0.00mi | 3/2.0 | 1,217 (0%) | 1mo | $242,000 | $199 | 99 |
| 5217 Belle Dr | 0.52mi | 2/2.0 (-1) | 1,206 (-1%) | 4mo | $232,000 | $192 | 66 |
| 46 Carrie Way | 0.73mi | 3/2.5 | 1,225 (+1%) | 1mo | $352,000 | $287 | 62 |
| 5114 Christopher Dr | 0.55mi | 3/2.5 | 1,320 (+8%) | 0mo | $275,000 | $208 | 58 |
| 64 Sylvan Dr | 0.39mi | 3/1.5 | 1,080 (-11%) | 5mo | $269,000 | $249 | 57 |
| 114 Sylvan Dr | 0.56mi | 3/2.0 | 1,125 (-8%) | 7mo | $270,000 | $240 | 55 |
| 5190 Christopher Dr | 0.61mi | 3/1.5 | 1,120 (-8%) | 1mo | $255,000 | $228 | 55 |
| 120 Carrie Way | 0.66mi | 3/2.5 | 1,287 (+6%) | 7mo | $340,000 | $264 | 52 |
| 164 Friar Tuck Dr | 0.53mi | 3/2.0 | 1,098 (-10%) | 10mo | $235,000 | $214 | 51 |
| 4949 Scenic Ridge Ln | 0.57mi | 3/2.0 | 1,386 (+14%) | 1mo | $440,000 | $317 | 49 |
| 5186 Christopher Dr | 0.61mi | 3/1.5 | 1,337 (+10%) | 6mo | $256,500 | $192 | 48 |
| 4940 Pritchard Ln | 0.69mi | 3/2.5 | 1,144 (-6%) | 13mo | $312,000 | $273 | 45 |
Match score weights: distance 35% · size 25% · config 20% · recency 20%. Top-matched comps best support the ARV.
Projected returns pro-forma
-3.0% appreciation · 5.37% rent growth · sell at horizon
- IRR
- -12.5%
- Equity multiple
- 0.54×
- Total profit
- $-32,330
- Equity at exit
- $37,261
- IRR
- -0.5%
- Equity multiple
- 0.96×
- Total profit
- $-2,461
- Equity at exit
- $21,607
Cash invested: $69,972 (down + closing). Projections, not guarantees.
Landlord ↔ Tenant lean methodology
- Overall (STATE)
- 83 Strongly Landlord-Friendly
- State Kentucky
- 83 Strongly Landlord-Friendly · R+16
- County
- — inherits STATE
- City
- — inherits STATE
ZIP-level market 41051
- Home prices YoY
- -32.6%
- Rents YoY
- 5.4%
- Active inventory
- 258
- Price-to-rent
- 10.0×
Monthly cashflow live
- Estimated rent
- $2,078 medium interval (Pro) →
- Mortgage (P&I)
- −$1,311
- Tax from tax record
- −$178 /mo · $2,133/yr
- Insurance
- −$104
- HOA
- −$0
- Vacancy / Maint / Mgmt
- −$436
- Net cashflow
- $49
Break-even live
Sensitivity live
| Price | -10% $191 | -5% $120 | +0% $49 | +5% $-21 | +10% $-92 |
|---|---|---|---|---|---|
| Rent | -10% $-115 | -5% $-33 | +0% $49 | +5% $131 | +10% $214 |
| Rate | -1.0pp $175 | -0.5pp $113 | base $49 | +0.5pp $-15 | +1.0pp $-81 |
UW: 25.0% down · 7.5% · 30yr · 1.5% tax · 5.0% vac · 8.0% maint · 8.0% mgmt
Financing live
Cash to close
- Down payment
- $62,475
- Closing costs
- $7,497
- Reserves months
- —
- Total cash needed
- —
Loan-product check · same deal, 3 products live
Conventional
25% down · 7.5% · 30yr
- Down + closing
- —
- Monthly P&I
- —
- Monthly cashflow
- —
- DSCR
- —
- Eligible?
- —
Personal DTI + credit; lowest rate.
DSCR
20% down · 8.5% · 30yr
- Down + closing
- —
- Monthly P&I
- —
- Monthly cashflow
- —
- DSCR
- —
- Eligible?
- —
No personal income docs; deal must DSCR.
Hard money
10% down · 12.0% · 12mo
- Down + closing
- —
- Monthly P&I
- —
- Monthly cashflow
- —
- DSCR
- —
- Eligible?
- —
Short-term bridge; refi at stabilization.
Listing history 12 events
-
2026-04-28status Pending
-
2026-04-27status Active
-
2026-04-18status Pending
-
2026-04-17price $249,900
-
2026-04-15status Active
-
2026-04-08status Pending
-
2026-04-06$269,900 Active
-
2018-04-09soldstatus $169,900
-
2018-04-06soldstatus $169,900 401-char remark
Show marketing remark (401 chars)
Simply Awesome! Gorgeous "Farmhouse" Style Home*Beautifully Remodeled w. Wood Plank Ceilings/Easy Care Wood Laminate Flooring*Butcher Block Countertops/Stainless Appliances*Stone Backsplash*Stone Surround Fireplace*Oversized 2 Car Garage w. Separate Workshop Space*Large Fenced Yard*Double Driveways (Great for RV's/Boats)*2 New Baths*Newly Remodeled thruout! Buy w. No Money Down USDA Loan!
-
2018-01-11$169,900 401-char remark
Show marketing remark (401 chars)
Simply Awesome! Gorgeous "Farmhouse" Style Home*Beautifully Remodeled w. Wood Plank Ceilings/Easy Care Wood Laminate Flooring*Butcher Block Countertops/Stainless Appliances*Stone Backsplash*Stone Surround Fireplace*Oversized 2 Car Garage w. Separate Workshop Space*Large Fenced Yard*Double Driveways (Great for RV's/Boats)*2 New Baths*Newly Remodeled thruout! Buy w. No Money Down USDA Loan!
-
1993-03-08soldstatus $20,000
-
1988-05-23soldstatus $17,000
ⓘ Source: listings_history table (triggers on properties + properties_extension) + one-shot
backfill from property_details.listing_events for pre-trigger history.
Tax reassessment forecast KY · Resets to sale price
- Current annual tax
- $2,133 · $178/mo
- Projected year-2 tax
- $2,149 · $179/mo
- Expected delta
- +$16/yr (+$1/mo · 0.8%)
ⓘ Screening estimate from a state-policy table — verify with the county assessor before closing.
Climate risk First Street
- Flood 1/10 Low FEMA zone X (unshaded) · 0% chance over 30 yrs
- Wildfire 3/10 Moderate
- Heat 4/10 Moderate 7 d/yr ≥102°F today · 19 d/yr by 30 yrs out
- Wind 2/10 Low 100% chance of damaging wind over 30 yrs
- Air quality 3/10 Moderate 2 unhealthy d/yr today · 3 by 30 yrs out
Nearby sold comps map
Loading sold comps map…
Walkable amenities ~0.75 mi
Loading nearby amenities…
Taxation est. · year 1
- Rental income
- $24,938
- − Mortgage interest
- −$13,998
- − Property taxes
- −$2,133
- − Insurance
- −$1,250
- − Repairs & maintenance
- −$1,995
- − Management
- −$1,995
- − Depreciation
- −$7,270
- Taxable loss
- −$3,703
- Est. tax savings @ 24.0%
- +$889
- After-tax cash flow
- $1,481/yr
For passive investors: Depreciation is non-cash, so a rental often shows a tax loss while cash-flowing — sheltering income. Rental losses are passive: they offset passive income freely, and up to $25,000/yr can offset ordinary (W-2) income if you actively participate and your MAGI is under $100k (phasing out to $0 by $150k); unused losses carry forward. On sale, claimed depreciation is recaptured at up to 25%, and gains may owe capital-gains tax (a 1031 exchange can defer both). Figures are a year-1 estimate at your 24.0% rate — not tax advice; consult a CPA.
Schools (NCES district)
- District
- Kenton County
- NCES district ID
- 2103090
- Math proficiency
- 42% ▼ -13.00%
- Reading proficiency
- 48% ▼ -14.00%
- Median HH income
- $66,183
- Composite
- 40.17/100
- National rank
- #3789
- State rank
- #14 of 165 in KY
Livability — Independence
- Score
- 72/100
- State rank
- #130
- US rank
- #6165
Category grades
Schools grade is shown separately in the Schools card above.
Census & demographics
- County
- Kenton County · 142,881 people
- City population
- 33,054
- Metro
- Cincinnati, OH-KY-IN
- Population (ZIP)
- 33,054
- Household income
- $104,201
- Rent vs Own
- Severe rent burden
- 243.0
Population outlook (Kenton County) Hauer SSP2
- Today (2025)
- 174,205 people
- By 2030
- 177,897 · +2.1%
- By 2040
- 182,671 · +4.9%
- By 2050
- 183,543 · +5.4%
- By 2075
- 178,977 · +2.7%
- By 2100
- 159,920 · -8.2%
Race, ethnicity, and origin ACS 2023
- Neighborhood character
- Predominantly White (93%)
- Race & ethnicity
- White 93% Two or more races 3% Hispanic / Latino 2% Black 1% Asian 1%
- Common ancestry
- Italian 3% Lithuanian 3% Slovak 2%
- Foreign-born
- 3% · China, Canada
- Languages at home
- 96% English-only · Spanish 1% Chinese 1% Other Asian/Pacific 1%
Political lean MEDSL · Kenton
- 2024 margin
- Strong R (+21.7) · D 38.2% · R 59.9% · Other 1.9%
- 2008→2024 swing
- -0.9pp no change · 2008: -20.9pp · 2024: -21.7pp
- All cycles
- 2024: R+21.7 2020: R+19.3 2016: R+26.1 2012: R+24.3 2008: R+20.9
Not yet ingested
- Civics
- —
Market trends
- HPI YoY
- ▼ -105.60%
- Current HPI
- 218.492
- Rent YoY
- ▲ 5.37%
- Metro
- Cincinnati, OH-KY-IN
- State GDP YoY
- ▲ 1.81%
- F500 in state
- 4
Industry mix (Fortune 500 HQ in KY)
| Industry | F500 HQs | Revenue |
|---|---|---|
| Healthcare | 1 | $118B |
|
||
| Food / Beverage | 1 | $7B |
|
||
Price history
+1370.0% since first listed12 events — show timeline
- 2026-04-28 Pending — NKMLS
- 2026-04-27 Relisted — NKMLS
- 2026-04-18 Pending — NKMLS
- 2026-04-17 Price Changed $249,900 NKMLS
- 2026-04-15 Relisted — NKMLS
- 2026-04-08 Pending — NKMLS
- 2026-04-06 Listed $269,900 NKMLS
- 2018-04-09 Sold (Public Records) $169,900 Public Records
- 2018-04-06 Sold (MLS) $169,900 NKMLS
- 2018-01-11 Listed $169,900 NKMLS
- 1993-03-08 Sold (Public Records) $20,000 Public Records
- 1988-05-23 Sold (Public Records) $17,000 Public Records
Property tax history
+12.2%/yrLatest (2025): $2,133 · +1.1% YoY. Source: county tax records.
Cash-flow waterfall
monthlySold comps — $/sqft
last 12 mo · ≤1 miLoading sold comps…