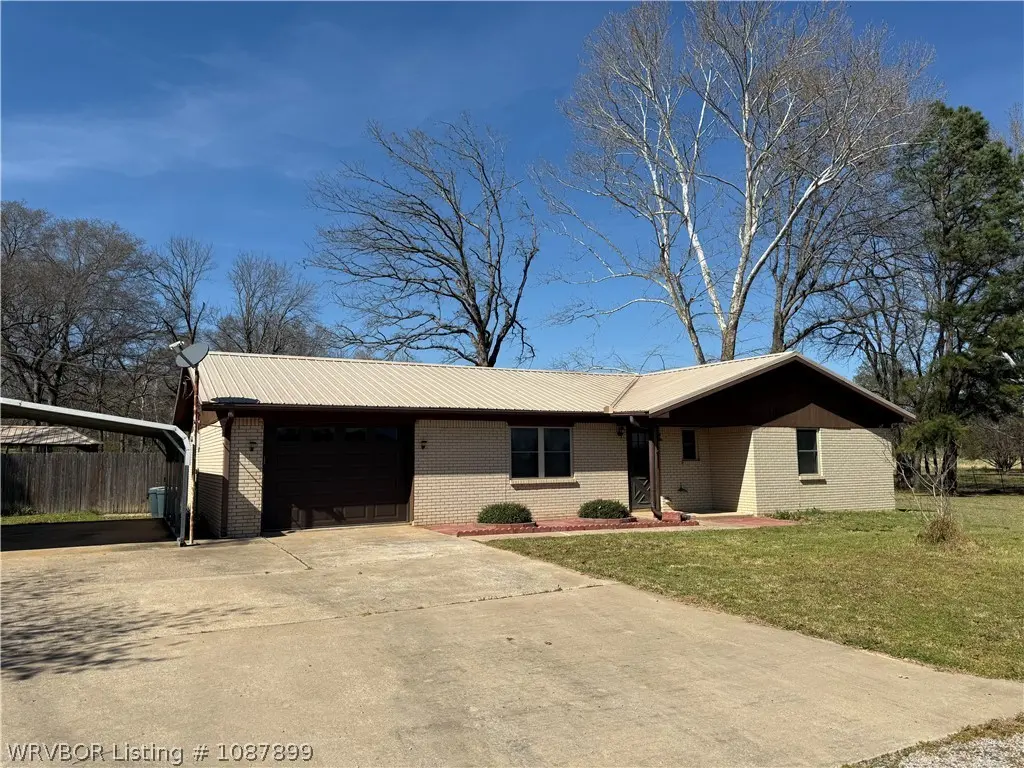
14630 Edwards Loop · Rock Island, OK
Flood risk 1/10 · Minimal
- FEMA flood zone
- X (unshaded)
- Chance of flooding over 30 yrs
- 0.0%
- Est. flood insurance / yr
- $507 – $1,088
Fire risk 4/10 · Minor
- Est. fire insurance / yr
- $2,463 – $4,575
Heat risk 6/10 · Moderate
- Hot days now (above 112°F)
- 7 days/yr
- Hot days in 30 yrs
- 20 days/yr
Wind risk 2/10 · Minimal
- Chance of severe wind over 30 yrs
- 4.0%
Air-quality risk 2/10 · Minimal
- Unhealthy air days now
- 0 days/yr
- Unhealthy air days in 30 yrs
- 1 days/yr
Risk factors via First Street. Map © Google.
Why this score? — see what drove the C grade
The composite is a weighted blend of 9 inputs, each scored 0–100. Each bar is that input's sub-score; the figure is the points it added to the 100-point composite (weight × sub-score).
- Cash flow +16.4/30.0
- ARV discount +15.0/15.0
- Appreciation +10.0/10.0
- DSCR +5.1/10.0
- 1% rule +3.3/10.0
- Livability +2.7/5.0
- Rent growth +2.5/5.0
- Condition / age +2.5/5.0
- Schools +1.4/10.0
$144,100
🖨 Deal sheet 📄 Offer letter ✓ Due diligence
Listing remarks
Auction 4/28/26 @ 10 am. This well-maintained brick home offers approximately 1,344 sf of comfortable living space featuring three bedrooms and two bathrooms. The exterior is topped with a durable metal roof, while the interior boasts modern updates including new windows, a newer HVAC system, and stylish vinyl plank flooring. Situated on a sprawling appx 0.93-acre lot, the property provides a peaceful retreat highlighted by an in-ground pool and stunning panoramic views of the surrounding mountains.
Key facts
- One acre lot
- Metal roof
- Brick home
Tags
Property features AI
Finance
- Other: Private pool (in ground); Directions: From HWY 112 at Rock Island turn West on Old HWY 112 go 1/2 mile; then turn South on Edwards Loop go approx. 1 mile.
Exterior
- Parking: 2 covered parking spaces; Garage with concrete driveway and garage door opener
- Utilities: Public water; Electricity available; Water available
- Home design: Single-family residence; One story; House; Public-maintained paved road access; Subdivision: Rock Island Township Add
- Construction: Brick construction; Metal roof; Slab foundation; Built as a residential single-family home
- Exterior features: Covered patio/porch; Back-yard fencing; In-ground private pool
Interior
- Kitchen: Oven; Electric water heater
- Flooring: Carpet; Vinyl
- Bathrooms: 3 full bathrooms; 1 half bathroom
- Heating & cooling: Central heating; Central air; Ceiling fans
- Interior features: Ceiling fans; Blinds; Fireplace in the family room
- Laundry & utility: Electric dryer hookup
Neighborhood map
What this means for you Summary
Snapshot
- This is a 3-bed/2.0-bath single-family listed at $144k.
Deal economics
- At list price, monthly cash flow is $82 ($988/yr) — positive.
- The deal already cash-flows at list — no discount required.
- To meet the 1% rule (rent ≥ 1% of price), the offer needs to be $119k (17.5% below list).
- Recommended offer: $119k (17.5% below list) — sets the bar for 1% rule.
Location & tenants
- Location reads 54/100 on livability (#578 in OK) — a working-class tenant base; expect higher turnover. Strengths: cost of living A+; Watch: crime F, amenities F, commute F.
- Cameron (rural): math 10% / reading 15% proficiency, ranked #485 of 513 in OK (top 94%) — low school quality limits family demand, transient renter base, plan for 1-2y turnover; 60% free/reduced lunch — lower-income household profile, screen leases tightly.
- Zoned schools: Cameron Es (math 12% / reading 8%, grade F, #711 of 845 statewide, top 87%, 220 students, 0% FRL); Cameron Hs (math 10% / reading 10%, grade F, #361 of 447 statewide, top 94%, 99 students, 0% FRL) — zoned schools average 0% FRL vs 60% district-wide (60 pts lower); this property's tenant base skews higher-income than the district average.
- Market conditions: 22 active listings in the ZIP; 73 units permitted in Le Flore County in 2024 (0 in 5+ unit buildings).
Forward outlook
- In year one you build about $15k of equity ($996 loan paydown + $14k appreciation (10.0% local appreciation)).
- Le Flore County population projected at -13% by 2050 — secular population decline; favor cash flow + early exit over multi-decade hold.
- At projected returns (10.0% appreciation + 3.0% rent growth), your $40k cash investment doubles in ~3 years — after that, you're playing with house money.
- By year 3, paydown + projected appreciation supports a ~$39k cash-out refi (75% LTV) — recoverable capital for the next deal without selling this one.
Negotiation context
- It's been on market 35 days — a 3% lower offer ($140k) is reasonable based on typical stale-listing flexibility.
Risks & watch-outs
- Climate carrying-cost: extreme-heat days projected 7→20/yr by 2055 (HVAC capex compounding) — expect insurance premiums to compound above CPI over the hold.
Questions for the listing agent
- It's been on market 35 days. Have you received any prior offers? Is the seller open to a 17% concession, seller financing, or rate buy-down credit?
- Built in 1978 — when were the roof, HVAC, electrical panel, plumbing, and water heater last replaced?
- Is there a deadline driving the sale (1031 exchange, divorce, estate, relocation)? That informs how much negotiation room exists.
- Schools are F-rated, which usually means shorter tenancies and higher turnover. Who's the typical renter profile here, and what's been the actual vacancy rate?
- Crime grade is F in this area — have there been break-ins, vandalism, or insurance claims at this property in the last 3 years? What carrier currently insures it and at what premium?
- What's the average days-on-market for RENTAL listings here right now (not sales)? A rising rental-DOM trend means longer vacancies and softer asking-rent achievability than the comps imply.
- What's the recent tenant-quality profile in this submarket — average credit score on applications, eviction rate, late-payment / NSF rate, and stable-employment percentage? A property-management company in the area should have these aggregated.
- How much new for-sale + rental construction is in the pipeline within 1–3 miles? Heavy new supply typically softens prices + rents 12–24 months out; constrained supply supports both.
Investment metrics
- 1% rule
- 0.83% ✗
- Cap rate
- 6.98%
- Cash-on-cash
- 2.45%
- DSCR
- 1.11
- GRM
- 10.1
CMA / ARV
- ARV (on-the-fly)
- $193,536
- Comps found
- 2
Show comp detail 2 sales within ~0.75 mi
| Address | Dist | Beds/Ba | Sqft | Sold | Price | $/sf | Match |
|---|---|---|---|---|---|---|---|
| 14630 Edwards Loop | 0.00mi | 3/3.5 | 1,344 (0%) | 1mo | $144,100 | $107 | 93 |
| 14572 Edwards Loop | 0.09mi | 3/2.0 | 1,435 (+7%) | 10mo | $207,000 | $144 | 77 |
Match score weights: distance 35% · size 25% · config 20% · recency 20%. Top-matched comps best support the ARV.
Projected returns pro-forma
10.0% appreciation · 3.0% rent growth · sell at horizon
- IRR
- 26.0%
- Equity multiple
- 3.07×
- Total profit
- $83,657
- Equity at exit
- $129,817
- IRR
- 22.8%
- Equity multiple
- 7.00×
- Total profit
- $242,099
- Equity at exit
- $279,955
Cash invested: $40,348 (down + closing). Projections, not guarantees.
Landlord ↔ Tenant lean methodology
- Overall (STATE)
- 83 Strongly Landlord-Friendly
- State Oklahoma
- 83 Strongly Landlord-Friendly · R+20
- County
- — inherits STATE
- City
- — inherits STATE
ZIP-level market 74932
- Home prices YoY
- 3.5%
- Active inventory
- 22
- Price-to-rent
- 10.1×
Monthly cashflow live
- Estimated rent
- $1,189 medium interval (Pro) →
- Mortgage (P&I)
- −$756
- Tax from tax record
- −$41 /mo · $495/yr
- Insurance
- −$60
- HOA
- −$0
- Vacancy / Maint / Mgmt
- −$250
- Net cashflow
- $82
Break-even live
UW: 25.0% down · 7.5% · 30yr · 1.5% tax · 5.0% vac · 8.0% maint · 8.0% mgmt
Financing live
Cash to close
- Down payment
- $36,025
- Closing costs
- $4,323
- Reserves months
- —
- Total cash needed
- —
Loan-product check · same deal, 3 products live
Conventional
25% down · 7.5% · 30yr
- Down + closing
- —
- Monthly P&I
- —
- Monthly cashflow
- —
- DSCR
- —
- Eligible?
- —
Personal DTI + credit; lowest rate.
DSCR
20% down · 8.5% · 30yr
- Down + closing
- —
- Monthly P&I
- —
- Monthly cashflow
- —
- DSCR
- —
- Eligible?
- —
No personal income docs; deal must DSCR.
Hard money
10% down · 12.0% · 12mo
- Down + closing
- —
- Monthly P&I
- —
- Monthly cashflow
- —
- DSCR
- —
- Eligible?
- —
Short-term bridge; refi at stabilization.
Listing history 3 events
-
2026-06-02price $144,100 Pending 35 DOM
-
2026-04-28status Pending
-
2026-03-20$1 Active
ⓘ Source: listings_history table (triggers on properties + properties_extension) + one-shot
backfill from property_details.listing_events for pre-trigger history.
Tax reassessment forecast OK · Resets to sale price
- Current annual tax
- $495 · $41/mo
- Projected year-2 tax
- $1,297 · $108/mo
- Expected delta
- +$802/yr (+$67/mo · 162.0%)
ⓘ Screening estimate from a state-policy table — verify with the county assessor before closing.
Climate risk First Street
- Flood 1/10 Low FEMA zone X (unshaded) · 0% chance over 30 yrs
- Wildfire 4/10 Moderate
- Heat 6/10 Major 7 d/yr ≥112°F today · 20 d/yr by 30 yrs out
- Wind 2/10 Low 4% chance of damaging wind over 30 yrs
- Air quality 2/10 Low 0 unhealthy d/yr today · 1 by 30 yrs out
Nearby sold comps map
Loading sold comps map…
Walkable amenities ~0.75 mi
Loading nearby amenities…
Taxation est. · year 1
- Rental income
- $14,268
- − Mortgage interest
- −$8,072
- − Property taxes
- −$495
- − Insurance
- −$720
- − Repairs & maintenance
- −$1,141
- − Management
- −$1,141
- − Depreciation
- −$4,192
- Taxable loss
- −$1,494
- Est. tax savings @ 24.0%
- +$359
- After-tax cash flow
- $1,347/yr
For passive investors: Depreciation is non-cash, so a rental often shows a tax loss while cash-flowing — sheltering income. Rental losses are passive: they offset passive income freely, and up to $25,000/yr can offset ordinary (W-2) income if you actively participate and your MAGI is under $100k (phasing out to $0 by $150k); unused losses carry forward. On sale, claimed depreciation is recaptured at up to 25%, and gains may owe capital-gains tax (a 1031 exchange can defer both). Figures are a year-1 estimate at your 24.0% rate — not tax advice; consult a CPA.
Schools (NCES district)
- District
- Cameron
- NCES district ID
- 4006330
- Math proficiency
- 10% ▬ 0.00%
- Reading proficiency
- 15% ▬ 0.00%
- Median HH income
- $37,024
- Composite
- 14.0/100
- National rank
- #14452
- State rank
- #485 of 513 in OK
Livability — Rock Island
- Score
- 54/100
- State rank
- #578
- US rank
- #23813
Category grades
Schools grade is shown separately in the Schools card above.
Census & demographics
- Census place
- Rock Island, OK
- Population (ZIP)
- 2,550
Population outlook (Le Flore County) Hauer SSP2
- Today (2025)
- 48,504 people
- By 2030
- 47,474 · -2.1%
- By 2040
- 44,914 · -7.4%
- By 2050
- 42,239 · -12.9%
- By 2075
- 35,071 · -27.7%
- By 2100
- 25,949 · -46.5%
Race, ethnicity, and origin ACS 2023
- Neighborhood character
- Predominantly White (72%)
- Race & ethnicity
- White 72% Two or more races 12% Native American 12% Hispanic / Latino 4%
- Common ancestry
- Lithuanian 2% Slovak 2% Serbian 1%
- Foreign-born
- 1% · Canada, Jamaica
- Languages at home
- 97% English-only · Spanish 1% Other Asian/Pacific 1%
Political lean MEDSL · Le Flore
- 2024 margin
- Solid R (+64.8) · D 17.0% · R 81.8% · Other 1.3%
- 2008→2024 swing
- -26.1pp toward R · 2008: -38.6pp · 2024: -64.8pp
- All cycles
- 2024: R+64.8 2020: R+63.4 2016: R+58.7 2012: R+41.1 2008: R+38.6
Not yet ingested
- Civics
- —
Market trends
- HPI YoY
- ▲ 11.57%
- Current HPI
- 346.0767
- Rent YoY
- —
- Metro
- —
- State GDP YoY
- ▲ 1.55%
- F500 in state
- 6
Industry mix (Fortune 500 HQ in OK)
| Industry | F500 HQs | Revenue |
|---|---|---|
| Energy | 3 | $48B |
|
||
Property tax history
-3.9%/yrLatest (2025): $495 · -33.0% YoY. Source: county tax records.
Cash-flow waterfall
monthlySold comps — $/sqft
last 12 mo · ≤1 miLoading sold comps…