317 N Orange St · Perry, FL
Flood risk 6/10 · Moderate
- FEMA flood zone
- X (shaded)
- Chance of flooding over 30 yrs
- 0.7%
- Est. flood insurance / yr
- $507 – $1,088
Fire risk 7/10 · Major
- Est. fire insurance / yr
- $947 – $1,759
Heat risk 9/10 · Severe
- Hot days now (above 109°F)
- 7 days/yr
- Hot days in 30 yrs
- 22 days/yr
Wind risk 9/10 · Severe
- Chance of severe wind over 30 yrs
- 99.0%
Air-quality risk 2/10 · Minimal
- Unhealthy air days now
- 0 days/yr
- Unhealthy air days in 30 yrs
- 2 days/yr
Risk factors via First Street. Map © Google.
Why this score? — see what drove the B grade
The composite is a weighted blend of 9 inputs, each scored 0–100. Each bar is that input's sub-score; the figure is the points it added to the 100-point composite (weight × sub-score).
- Cash flow +28.6/30.0
- ARV discount +15.0/15.0
- DSCR +10.0/10.0
- 1% rule +7.9/10.0
- Schools +3.6/10.0
- Livability +3.5/5.0
- Rent growth +2.5/5.0
- Condition / age +1.0/5.0
- Appreciation +0.0/10.0
$99,900
🖨 Deal sheet 📄 Offer letter ✓ Due diligence
Listing remarks MLS
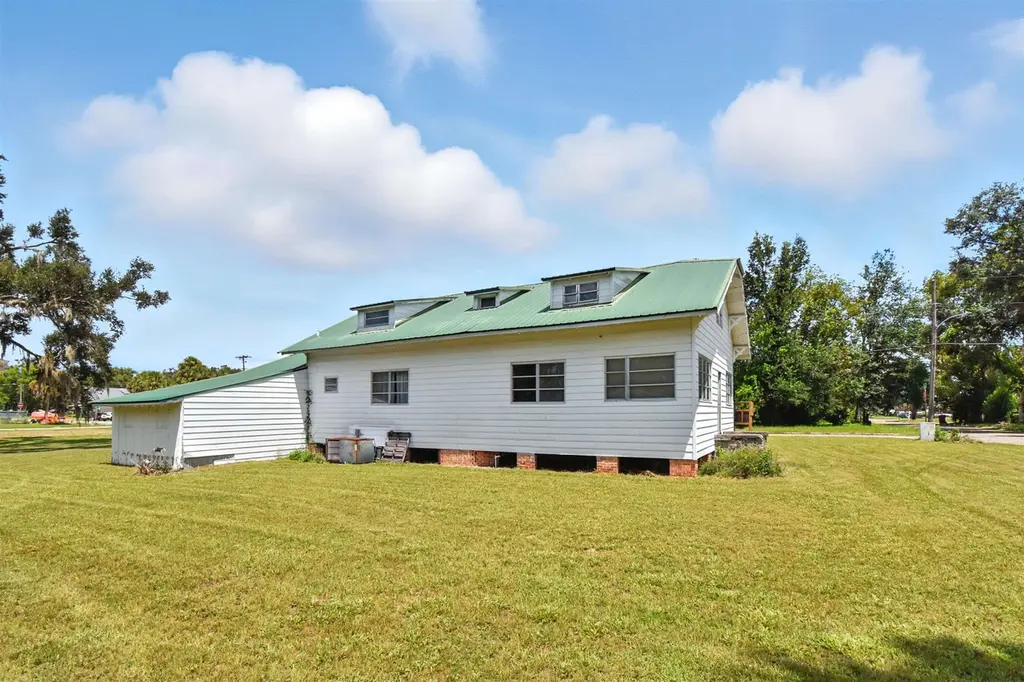
Own a Piece of Perry’s History! Welcome to 317 N Orange Street — a captivating 1903 historic gem nestled in the heart of downtown Perry, Florida. With 2,880 square feet of space and nearly an acre of land (. 92 acres across four city lots), this rare property is brimming with potential for restoration, expansion, and income generation. Originally built as a pastorium, this storied structure has also served as a church youth center and meeting hall, preserving over a century of local history within its walls. Now, it's ready for its next chapter — whether reimagined as a charming income-producing duplex, converted into office or event space, or lovingly restored into a stunning single-family home. Located just steps from shopping, restaurants, the public library, and other downtown conveniences, this prime location offers walkability and visibility in a growing community. The additional three city lots offer room to expand or develop further, making it a standout investment opportunity. Don’t miss your chance to bring this piece of Perry’s past back to life — opportunities like this are rare, and the potential is limitless.
Key facts
- Historic gem
- Heart of downtown
- Income generation
Tags
Neighborhood map
What this means for you Summary
Snapshot
- This is a 3-bed/1.0-bath single-family listed at $100k. Condition is rated poor.
Deal economics
- At list price, monthly cash flow is $330 ($4k/yr) — positive.
- The deal already cash-flows at list — no discount required.
- Meets the 1% rule at list price ($1k rent vs $100k).
- Recommended offer: $97k (3.0% below list) — sets the bar for market timing.
- Cap rate 10.3% vs local median 3.6% in Perry — top-decile yield for the area; either an underpriced asset or a hidden risk that comps aren't pricing in. Stress-test before assuming the spread holds.
Location & tenants
- Location reads 70/100 on livability (#420 in FL) — a middle-class / working-renter tenant base. Strengths: cost of living A+, housing A+, health & safety A+; Watch: schools D, amenities F, commute F.
- Taylor (rural): math 44% / reading 42% proficiency, ranked #59 of 73 in FL (top 81%) — families likely to look elsewhere, expect single-tenant / working-renter base with shorter leases; 64% free/reduced lunch — lower-income household profile, screen leases tightly.
- Market conditions: 51 active listings in the ZIP; 48 units permitted in Taylor County in 2024 (0 in 5+ unit buildings).
Forward outlook
- Local home prices are declining (-3.0%/yr); year-one equity from $691 of loan paydown is wiped out by about $3k of value loss. Plan a longer hold.
- Taylor County population projected at -14% by 2050 — secular population decline; favor cash flow + early exit over multi-decade hold.
- At projected returns (-3.0% appreciation + 3.0% rent growth), your $28k cash investment doubles in ~9 years — after that, you're playing with house money.
Negotiation context
- It's been on market 57 days — a 3% lower offer ($97k) is reasonable based on typical stale-listing flexibility.
- 2 sale attempts with the ask held roughly flat each time — persistent listings suggest the price (not the market) is what's stuck; bring a comps-based counter.
Risks & watch-outs
- Watch-outs: built in 1903 — expect roof / HVAC / electrical / plumbing capex.
- Climate carrying-cost: major flood risk; severe wind risk, 99% chance of damaging wind over 30y; major wildfire risk; extreme-heat days projected 7→22/yr by 2055 (HVAC capex compounding) — expect insurance premiums to compound above CPI over the hold.
Questions for the listing agent
- It's been on market 57 days. Have you received any prior offers? Is the seller open to a 3% concession, seller financing, or rate buy-down credit?
- Have any recent inspections been done? Can we get a copy of the seller's disclosures and any deferred-maintenance estimates?
- Built in 1903 — when were the roof, HVAC, electrical panel, plumbing, and water heater last replaced?
- Is there a deadline driving the sale (1031 exchange, divorce, estate, relocation)? That informs how much negotiation room exists.
- Schools are D-rated, which usually means shorter tenancies and higher turnover. Who's the typical renter profile here, and what's been the actual vacancy rate?
- What's the average days-on-market for RENTAL listings here right now (not sales)? A rising rental-DOM trend means longer vacancies and softer asking-rent achievability than the comps imply.
- What's the recent tenant-quality profile in this submarket — average credit score on applications, eviction rate, late-payment / NSF rate, and stable-employment percentage? A property-management company in the area should have these aggregated.
- How much new for-sale + rental construction is in the pipeline within 1–3 miles? Heavy new supply typically softens prices + rents 12–24 months out; constrained supply supports both.
Investment metrics
- 1% rule
- 1.29% ✓
- Cap rate
- 10.26%
- Cash-on-cash
- 14.17%
- DSCR
- 1.63
- GRM
- 6.4
CMA / ARV
- ARV (median comp)
- $188,981
- List price
- $99,900
- Delta
- -47.14%
- Verdict
- UNDERPRICED
- Comps
- 20 within 1.0 mi
Show comp detail 2 sales within ~0.75 mi
| Address | Dist | Beds/Ba | Sqft | Sold | Price | $/sf | Match |
|---|---|---|---|---|---|---|---|
| 315 W Green St | 0.31mi | 3/1.0 | 2,746 (-5%) | 2mo | $190,000 | $69 | 76 |
| 606 N Washington St | 0.14mi | 4/3.0 (+1) | 3,122 (+8%) | 23mo | $376,000 | $120 | 47 |
Match score weights: distance 35% · size 25% · config 20% · recency 20%. Top-matched comps best support the ARV.
Projected returns pro-forma
-3.0% appreciation · 3.0% rent growth · sell at horizon
- IRR
- 4.5%
- Equity multiple
- 1.17×
- Total profit
- $4,865
- Equity at exit
- $14,895
- IRR
- 14.0%
- Equity multiple
- 2.12×
- Total profit
- $31,401
- Equity at exit
- $8,638
Cash invested: $27,972 (down + closing). Projections, not guarantees.
Landlord ↔ Tenant lean methodology
- Overall (STATE)
- 87 Strongly Landlord-Friendly
- State Florida
- 87 Strongly Landlord-Friendly · R+3
- County
- — inherits STATE
- City
- — inherits STATE
ZIP-level market 32347
- Home prices YoY
- -23.5%
- Active inventory
- 51
- Price-to-rent
- 6.4×
Monthly cashflow live
- Estimated rent
- $1,292 medium interval (Pro) →
- Mortgage (P&I)
- −$524
- Tax est. 1.5%
- −$125 /mo · $1,498/yr
- Insurance
- −$42
- HOA
- −$0
- Vacancy / Maint / Mgmt
- −$271
- Net cashflow
- $330
Break-even live
UW: 25.0% down · 7.5% · 30yr · 1.5% tax · 5.0% vac · 8.0% maint · 8.0% mgmt
Financing live
Cash to close
- Down payment
- $24,975
- Closing costs
- $2,997
- Reserves months
- —
- Total cash needed
- —
Loan-product check · same deal, 3 products live
Conventional
25% down · 7.5% · 30yr
- Down + closing
- —
- Monthly P&I
- —
- Monthly cashflow
- —
- DSCR
- —
- Eligible?
- —
Personal DTI + credit; lowest rate.
DSCR
20% down · 8.5% · 30yr
- Down + closing
- —
- Monthly P&I
- —
- Monthly cashflow
- —
- DSCR
- —
- Eligible?
- —
No personal income docs; deal must DSCR.
Hard money
10% down · 12.0% · 12mo
- Down + closing
- —
- Monthly P&I
- —
- Monthly cashflow
- —
- DSCR
- —
- Eligible?
- —
Short-term bridge; refi at stabilization.
Listing history 19 events
-
2026-06-18days on market $99,900 Active 57 DOM
-
2026-06-17days on market $99,900 Active 56 DOM
-
2026-06-16days on market $99,900 Active 55 DOM
-
2026-06-15days on market $99,900 Active 54 DOM
-
2026-06-13days on market $99,900 Active 52 DOM
-
2026-06-13days on market $99,900 Active 51 DOM
-
2026-06-09days on market $99,900 Active 48 DOM
-
2026-06-08days on market $99,900 Active 47 DOM
-
2026-06-07days on market $99,900 Active 46 DOM
-
2026-06-05days on market $99,900 Active 43 DOM
-
2026-06-03days on market $99,900 Active 42 DOM
-
2026-06-02days on market $99,900 Active 41 DOM
-
2026-06-01days on market $99,900 Active 40 DOM
-
2026-05-31days on market $99,900 Active 39 DOM
-
2026-04-21$99,900 Active 1177-char remark
Show marketing remark (1177 chars)
Own a Piece of Perry’s History! Welcome to 317 N Orange Street — a captivating 1903 historic gem nestled in the heart of downtown Perry, Florida. With 2,880 square feet of space and nearly an acre of land (. 92 acres across four city lots), this rare property is brimming with potential for restoration, expansion, and income generation. Originally built as a pastorium, this storied structure has also served as a church youth center and meeting hall, preserving over a century of local history within its walls. Now, it's ready for its next chapter — whether reimagined as a charming income-producing duplex, converted into office or event space, or lovingly restored into a stunning single-family home. Located just steps from shopping, restaurants, the public library, and other downtown conveniences, this prime location offers walkability and visibility in a growing community. The additional three city lots offer room to expand or develop further, making it a standout investment opportunity. Don’t miss your chance to bring this piece of Perry’s past back to life — opportunities like this are rare, and the potential is limitless.
-
2026-02-27historical
-
2026-01-28price $110,000
-
2025-09-04price $120,000
-
2025-08-06$130,000 Active
ⓘ Source: listings_history table (triggers on properties + properties_extension) + one-shot
backfill from property_details.listing_events for pre-trigger history.
Climate risk First Street
- Flood 6/10 Major FEMA zone X (shaded) · 70% chance over 30 yrs
- Wildfire 7/10 Severe
- Heat 9/10 Extreme 7 d/yr ≥109°F today · 22 d/yr by 30 yrs out
- Wind 9/10 Extreme 99% chance of damaging wind over 30 yrs
- Air quality 2/10 Low 0 unhealthy d/yr today · 2 by 30 yrs out
Nearby sold comps map
Loading sold comps map…
Walkable amenities ~0.75 mi
Loading nearby amenities…
Taxation est. · year 1
- Rental income
- $15,503
- − Mortgage interest
- −$5,596
- − Property taxes
- −$1,498
- − Insurance
- −$500
- − Repairs & maintenance
- −$1,240
- − Management
- −$1,240
- − Depreciation
- −$2,906
- Taxable income
- $2,523
- Est. tax owed @ 24.0%
- −$605
- After-tax cash flow
- $3,358/yr
For passive investors: Depreciation is non-cash, so a rental often shows a tax loss while cash-flowing — sheltering income. Rental losses are passive: they offset passive income freely, and up to $25,000/yr can offset ordinary (W-2) income if you actively participate and your MAGI is under $100k (phasing out to $0 by $150k); unused losses carry forward. On sale, claimed depreciation is recaptured at up to 25%, and gains may owe capital-gains tax (a 1031 exchange can defer both). Figures are a year-1 estimate at your 24.0% rate — not tax advice; consult a CPA.
Condition & rehab AI · 12 photos
This property requires extensive renovation and repair to bring it up to modern standards, significantly increasing its resale and rental value.
Repairs flagged
- Major kitchen cabinets — severely damaged and outdated
- Major bathroom fixtures — severely damaged and outdated
- Major roof — visible wear and tear
- Major exterior siding — severely damaged and peeling
- Major flooring — damaged and uneven
- Major interior walls — paint peeling and walls in need of repair
- Major windows — broken and missing
- Major HVAC/mechanicals — outdated and in need of replacement
- Major landscaping — overgrown and unkempt
Value-add opportunities
- Both kitchen renovation — modernizing the kitchen will increase both resale and rental value
- Both bathroom renovation — modernizing the bathroom will increase both resale and rental value
- Both roof replacement — replacing the roof will increase both resale and rental value
- Both exterior siding repair — repairing the exterior siding will increase both resale and rental value
- Both flooring replacement — replacing the flooring will increase both resale and rental value
- Both interior wall repair — repairing the interior walls will increase both resale and rental value
- Both window replacement — replacing the windows will increase both resale and rental value
- Both HVAC/mechanical replacement — replacing the HVAC/mechanical system will increase both resale and rental value
- Both landscaping — improving the landscaping will increase both resale and rental value
Renovation cost estimate screening
| Repair item | Severity | Est. cost |
|---|---|---|
| kitchen cabinets · severely damaged and outdated | Major | $15,000–50,000 |
| bathroom fixtures · severely damaged and outdated | Major | $15,000–50,000 |
| roof · visible wear and tear | Major | $15,000–50,000 |
| exterior siding · severely damaged and peeling | Major | $15,000–50,000 |
| flooring · damaged and uneven | Major | $15,000–50,000 |
| interior walls · paint peeling and walls in need of repair | Major | $15,000–50,000 |
| windows · broken and missing | Major | $15,000–50,000 |
| HVAC/mechanicals · outdated and in need of replacement | Major | $15,000–50,000 |
| landscaping · overgrown and unkempt | Major | $15,000–50,000 |
| Total estimated repair cost · 9 items | $135,000–450,000 |
Value-add ROI direction
- Both kitchen renovation — modernizing the kitchen will increase both resale and rental value ↑
- Both bathroom renovation — modernizing the bathroom will increase both resale and rental value ↑
- Both roof replacement — replacing the roof will increase both resale and rental value ↑
- Both exterior siding repair — repairing the exterior siding will increase both resale and rental value ↑
- Both flooring replacement — replacing the flooring will increase both resale and rental value ↑
- Both interior wall repair — repairing the interior walls will increase both resale and rental value ↑
- Both window replacement — replacing the windows will increase both resale and rental value ↑
- Both HVAC/mechanical replacement — replacing the HVAC/mechanical system will increase both resale and rental value ↑
- Both landscaping — improving the landscaping will increase both resale and rental value ↑
ⓘ Cost ranges are severity-bucket heuristics (US national rule-of-thumb). Get contractor quotes + a written scope before underwriting a rehab budget.
Schools (NCES district)
- District
- Taylor
- NCES district ID
- 1201860
- Math proficiency
- 44% ▼ -13.00%
- Reading proficiency
- 42% ▼ -8.00%
- Median HH income
- $36,539
- Composite
- 35.71/100
- National rank
- #4862
- State rank
- #59 of 73 in FL
Livability — Perry
- Score
- 70/100
- State rank
- #420
- US rank
- #7497
Category grades
Schools grade is shown separately in the Schools card above.
Census & demographics
- Census place
- Perry, FL
- Population (ZIP)
- 7,174
Population outlook (Taylor County) Hauer SSP2
- Today (2025)
- 21,562 people
- By 2030
- 20,985 · -2.7%
- By 2040
- 19,823 · -8.1%
- By 2050
- 18,628 · -13.6%
- By 2075
- 15,609 · -27.6%
- By 2100
- 11,338 · -47.4%
Race, ethnicity, and origin ACS 2023
- Neighborhood character
- Predominantly White (81%)
- Race & ethnicity
- White 81% Two or more races 7% Black 7% Hispanic / Latino 3% Native American 1% Pacific Islander 1%
- Common ancestry
- Slovak 1% Italian 1% Lithuanian 1%
- Foreign-born
- 2% · Canada
- Languages at home
- 97% English-only · Spanish 2%
Political lean MEDSL · Taylor
- 2024 margin
- Solid R (+59.6) · D 19.9% · R 79.6%
- 2008→2024 swing
- -20.6pp toward R · 2008: -39.0pp · 2024: -59.6pp
- All cycles
- 2024: R+59.6 2020: R+53.8 2016: R+51.5 2012: R+38.3 2008: R+39.0
Not yet ingested
- Civics
- —
Market trends
- HPI YoY
- ▼ -56.08%
- Current HPI
- 182.6827
- Rent YoY
- —
- Metro
- —
- State GDP YoY
- ▲ 3.28%
- F500 in state
- 36
Industry mix (Fortune 500 HQ in FL)
| Industry | F500 HQs | Revenue |
|---|---|---|
| Industrial Technology | 2 | $29B |
|
||
| Insurance | 2 | $17B |
|
||
| Retail | 1 | $60B |
|
||
| Technology Distribution | 1 | $58B |
|
||
| Homebuilding | 1 | $35B |
|
||
| Technology Manufacturing | 1 | $35B |
|
||
Price history
-23.2% since first listed5 events — show timeline
- 2026-04-21 Listed $99,900 CATRS
- 2026-02-27 Listing Removed — CATRS
- 2026-01-28 Price Changed $110,000 CATRS
- 2025-09-04 Price Changed $120,000 CATRS
- 2025-08-06 Listed $130,000 CATRS
Cash-flow waterfall
monthlySold comps — $/sqft
last 12 mo · ≤1 miLoading sold comps…