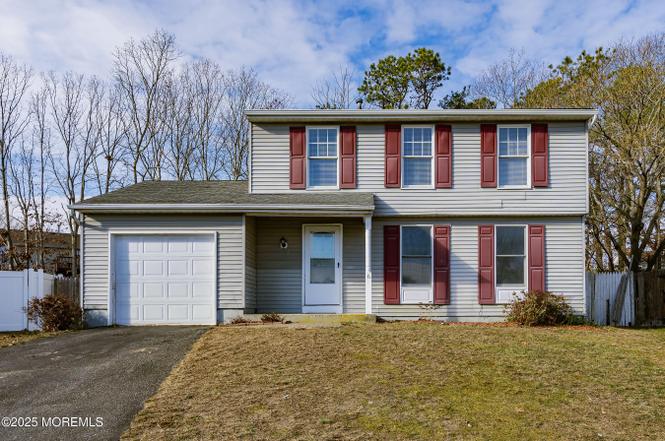
6 Surf Ct · Barnegat, NJ
Flood risk 1/10 · Minimal
- FEMA flood zone
- X (unshaded)
- Chance of flooding over 30 yrs
- 0.0%
- Est. flood insurance / yr
- $507 – $1,088
Fire risk 3/10 · Minor
- Est. fire insurance / yr
- $526 – $976
Heat risk 7/10 · Major
- Hot days now (above 98°F)
- 7 days/yr
- Hot days in 30 yrs
- 15 days/yr
Wind risk 8/10 · Major
- Chance of severe wind over 30 yrs
- 80.0%
Air-quality risk 2/10 · Minimal
- Unhealthy air days now
- 1 days/yr
- Unhealthy air days in 30 yrs
- 3 days/yr
Risk factors via First Street. Map © Google.
Why this score? — see what drove the D- grade
The composite is a weighted blend of 9 inputs, each scored 0–100. Each bar is that input's sub-score; the figure is the points it added to the 100-point composite (weight × sub-score).
- ARV discount +15.0/15.0
- Cash flow +7.6/30.0
- Livability +3.4/5.0
- Schools +3.1/10.0
- Rent growth +2.5/5.0
- Condition / age +2.5/5.0
- 1% rule +2.4/10.0
- DSCR +1.7/10.0
- Appreciation +0.0/10.0
$420,000
🖨 Deal sheet 📄 Offer letter ✓ Due diligence
Listing remarks MLS
Great cul-de-sac location highlights this updated home, complete with a brand new kitchen & appliances, carpet, vinyl, rear slider and fresh interior paint. Very convenient to schools, shopping centers and the Parkway. This is a Fannie Mae HomePath property. Purchase this property for as little as 5% down! This property is approved for HomePath Mortgage Financing and HomePath Renovation Mortgage Financing.
Key facts
- 9,583 sq ft lot
- Built 1987
- Listed 14 days
Neighborhood map
What this means for you Summary
Snapshot
- This is a 3-bed/2.0-bath single-family listed at $420k.
Deal economics
- At list price, monthly cash flow is $-497 ($-6k/yr) — negative.
- To cash-flow at today's rent, offer at most $332k (20.9% below list).
- To meet the 1% rule (rent ≥ 1% of price), the offer needs to be $311k (26.0% below list).
- Recommended offer: $311k (26.0% below list) — sets the bar for 1% rule.
- Cap rate 4.9% vs local median 3.6% in Barnegat — top-decile yield for the area; either an underpriced asset or a hidden risk that comps aren't pricing in. Stress-test before assuming the spread holds.
Location & tenants
- Location reads 68/100 on livability (#310 in NJ) — a middle-class / working-renter tenant base. Strengths: crime A+, employment A+, housing A; Watch: schools C-, amenities F, commute F.
- Barnegat Township School District (suburban): math 23% / reading 46% proficiency, ranked #285 of 472 in NJ (top 60%) — families likely to look elsewhere, expect single-tenant / working-renter base with shorter leases.
- Market conditions: 253 active listings in the ZIP; 1 comparable units currently listed for rent nearby; solid renter incomes; 4,434 units permitted in Ocean County in 2024 (868 in 5+ unit buildings).
- This rent runs 40% of the median local income ($94k/yr) — at the standard rent-burdened threshold; future hikes will face affordability resistance.
Forward outlook
- Local home prices are declining (-3.0%/yr); year-one equity from $3k of loan paydown is wiped out by about $13k of value loss. Plan a longer hold.
- Ocean County population projected to shrink 8% by 2050 — rents likely to lag national; underwrite the cash flow, not the appreciation.
Negotiation context
- Only 14 days on market — expect competitive offers; lowballing is unlikely to land.
- 4 sale attempts since 31y ago with the ask held roughly flat each time — persistent listings suggest the price (not the market) is what's stuck; bring a comps-based counter.
- Current owner paid $156k; list at $420k implies a 169% gain — meaningful room to come down on a strong offer.
Risks & watch-outs
- Climate carrying-cost: severe wind risk, 80% chance of damaging wind over 30y; extreme-heat days projected 7→15/yr by 2055 (HVAC capex compounding) — expect insurance premiums to compound above CPI over the hold.
Questions for the listing agent
- What do current leases actually rent for vs. the listed asking? Can we see a recent rent roll and the last 12 months of T-12 income?
- Is there a deadline driving the sale (1031 exchange, divorce, estate, relocation)? That informs how much negotiation room exists.
- The area grade is low — what's the realistic commute time and amenity access for the typical tenant pool here? Any planned neighborhood developments (good or bad) we should know about?
- What's the average days-on-market for RENTAL listings here right now (not sales)? A rising rental-DOM trend means longer vacancies and softer asking-rent achievability than the comps imply.
- What's the recent tenant-quality profile in this submarket — average credit score on applications, eviction rate, late-payment / NSF rate, and stable-employment percentage? A property-management company in the area should have these aggregated.
- How much new for-sale + rental construction is in the pipeline within 1–3 miles? Heavy new supply typically softens prices + rents 12–24 months out; constrained supply supports both.
Investment metrics
- 1% rule
- 0.74% ✗
- Cap rate
- 4.87%
- Cash-on-cash
- -5.07%
- DSCR
- 0.77
- GRM
- 11.3
CMA / ARV
- ARV (on-the-fly)
- $569,244
- Comps found
- 12
Show comp detail 12 sales within ~0.75 mi
| Address | Dist | Beds/Ba | Sqft | Sold | Price | $/sf | Match |
|---|---|---|---|---|---|---|---|
| 122 Rockrimmon Blvd | 0.23mi | 3/3.0 | 2,124 (-0%) | 3mo | $725,000 | $341 | 82 |
| 15 Commodore Ct | 0.30mi | 4/1.5 (+1) | 2,137 (+0%) | 0mo | $465,000 | $218 | 78 |
| 33 Compass Ln | 0.16mi | 4/3.0 (+1) | 2,008 (-6%) | 3mo | $450,000 | $224 | 72 |
| 8 Compass Ln | 0.06mi | 3/3.5 | 1,943 (-9%) | 9mo | $475,000 | $244 | 69 |
| 35 Bayside Ave | 0.12mi | 3/2.5 | 1,836 (-14%) | 4mo | $500,000 | $272 | 66 |
| 19 Midship Dr | 0.26mi | 3/1.5 | 1,828 (-14%) | 2mo | $495,000 | $271 | 60 |
| 18 Cannonball Dr | 0.63mi | 3/2.5 | 2,048 (-4%) | 4mo | $460,000 | $225 | 59 |
| 112 Edenton Dr | 0.71mi | 3/2.0 | 2,043 (-4%) | 3mo | $553,000 | $271 | 57 |
| 25 Aphrodite Dr | 0.59mi | 3/3.0 | 2,310 (+8%) | 6mo | $617,000 | $267 | 50 |
| 9 Robin Ln | 0.46mi | 2/2.0 (-1) | 1,824 (-14%) | 1mo | $410,000 | $225 | 49 |
| 66 Butler Dr | 0.68mi | 2/2.0 (-1) | 1,917 (-10%) | 4mo | $615,000 | $321 | 43 |
| 133 Village Dr | 0.61mi | 4/2.5 (+1) | 1,907 (-11%) | 7mo | $400,000 | $210 | 41 |
Match score weights: distance 35% · size 25% · config 20% · recency 20%. Top-matched comps best support the ARV.
Projected returns pro-forma
-3.0% appreciation · 3.0% rent growth · sell at horizon
- IRR
- -24.9%
- Equity multiple
- 0.15×
- Total profit
- $-99,656
- Equity at exit
- $62,623
- IRR
- -20.7%
- Equity multiple
- -0.08×
- Total profit
- $-127,253
- Equity at exit
- $36,314
Cash invested: $117,600 (down + closing). Projections, not guarantees.
Landlord ↔ Tenant lean methodology
- Overall (STATE)
- 21 Tenant-Leaning
- State New Jersey
- 21 Tenant-Leaning · D+6
- County
- — inherits STATE
- City
- — inherits STATE
ZIP-level market 08005
- Active inventory
- 253
- Price-to-rent
- 11.3×
Monthly cashflow live
- Estimated rent
- $3,106 medium interval (Pro) →
- Mortgage (P&I)
- −$2,203
- Tax from tax record
- −$574 /mo · $6,884/yr
- Insurance
- −$175
- HOA
- −$0
- Vacancy / Maint / Mgmt
- −$652
- Net cashflow
- $-497
Break-even live
UW: 25.0% down · 7.5% · 30yr · 1.5% tax · 5.0% vac · 8.0% maint · 8.0% mgmt
Financing live
Cash to close
- Down payment
- $105,000
- Closing costs
- $12,600
- Reserves months
- —
- Total cash needed
- —
Loan-product check · same deal, 3 products live
Conventional
25% down · 7.5% · 30yr
- Down + closing
- —
- Monthly P&I
- —
- Monthly cashflow
- —
- DSCR
- —
- Eligible?
- —
Personal DTI + credit; lowest rate.
DSCR
20% down · 8.5% · 30yr
- Down + closing
- —
- Monthly P&I
- —
- Monthly cashflow
- —
- DSCR
- —
- Eligible?
- —
No personal income docs; deal must DSCR.
Hard money
10% down · 12.0% · 12mo
- Down + closing
- —
- Monthly P&I
- —
- Monthly cashflow
- —
- DSCR
- —
- Eligible?
- —
Short-term bridge; refi at stabilization.
Rent comps 1 comps
| Address | Beds | Baths | Sqft | Rent | $/sqft | DOM | Units | Dist |
|---|---|---|---|---|---|---|---|---|
| 67 Deer Run Dr S Barnegat, NJ | 3.0 | 2.5 | 1682 | $3,400 | $2.02 | 25d | 1 | 0.84mi |
Listing history 13 events
-
2025-02-02status Pending
-
2025-01-18$420,000 Active
-
2025-01-15historical $420,000
-
2014-09-26soldstatus $156,000 415-char remark
Show marketing remark (415 chars)
Great cul-de-sac location highlights this updated home, complete with a brand new kitchen & appliances, carpet, vinyl, rear slider and fresh interior paint. Very convenient to schools, shopping centers and the Parkway. This is a Fannie Mae HomePath property. Purchase this property for as little as 5% down! This property is approved for HomePath Mortgage Financing and HomePath Renovation Mortgage Financing.
-
2014-08-25historical 415-char remark
Show marketing remark (415 chars)
Great cul-de-sac location highlights this updated home, complete with a brand new kitchen & appliances, carpet, vinyl, rear slider and fresh interior paint. Very convenient to schools, shopping centers and the Parkway. This is a Fannie Mae HomePath property. Purchase this property for as little as 5% down! This property is approved for HomePath Mortgage Financing and HomePath Renovation Mortgage Financing.
-
2014-07-11$157,500 415-char remark
Show marketing remark (415 chars)
Great cul-de-sac location highlights this updated home, complete with a brand new kitchen & appliances, carpet, vinyl, rear slider and fresh interior paint. Very convenient to schools, shopping centers and the Parkway. This is a Fannie Mae HomePath property. Purchase this property for as little as 5% down! This property is approved for HomePath Mortgage Financing and HomePath Renovation Mortgage Financing.
-
1995-11-06soldstatus $86,000
-
1995-11-01soldstatus $86,000
-
1995-08-25historical
-
1995-01-11$89,900
-
1987-09-17soldstatus $100,490
ⓘ Source: listings_history table (triggers on properties + properties_extension) + one-shot
backfill from property_details.listing_events for pre-trigger history.
Tax reassessment forecast NJ · Partial reset (capped growth)
- Current annual tax
- $6,884 · $574/mo
- Projected year-2 tax
- $8,671 · $723/mo
- Expected delta
- +$1,787/yr (+$149/mo · 26.0%)
ⓘ Screening estimate from a state-policy table — verify with the county assessor before closing.
Climate risk First Street
- Flood 1/10 Low FEMA zone X (unshaded) · 0% chance over 30 yrs
- Wildfire 3/10 Moderate
- Heat 7/10 Severe 7 d/yr ≥98°F today · 15 d/yr by 30 yrs out
- Wind 8/10 Severe 80% chance of damaging wind over 30 yrs
- Air quality 2/10 Low 1 unhealthy d/yr today · 3 by 30 yrs out
Nearby sold comps map
Loading sold comps map…
Walkable amenities ~0.75 mi
Loading nearby amenities…
Taxation est. · year 1
- Rental income
- $37,274
- − Mortgage interest
- −$23,527
- − Property taxes
- −$6,884
- − Insurance
- −$2,100
- − Repairs & maintenance
- −$2,982
- − Management
- −$2,982
- − Depreciation
- −$12,218
- Taxable loss
- −$13,419
- Est. tax savings @ 24.0%
- +$3,220
- After-tax cash flow
- $-2,747/yr
For passive investors: Depreciation is non-cash, so a rental often shows a tax loss while cash-flowing — sheltering income. Rental losses are passive: they offset passive income freely, and up to $25,000/yr can offset ordinary (W-2) income if you actively participate and your MAGI is under $100k (phasing out to $0 by $150k); unused losses carry forward. On sale, claimed depreciation is recaptured at up to 25%, and gains may owe capital-gains tax (a 1031 exchange can defer both). Figures are a year-1 estimate at your 24.0% rate — not tax advice; consult a CPA.
Schools (NCES district)
- District
- Barnegat Township School District
- NCES district ID
- 3416470
- Math proficiency
- 23% ▼ -14.00%
- Reading proficiency
- 46% ▼ -5.00%
- Median HH income
- $63,645
- Composite
- 31.15/100
- National rank
- #6059
- State rank
- #285 of 472 in NJ
Livability — Barnegat
- Score
- 68/100
- State rank
- #310
- US rank
- #9556
Category grades
Schools grade is shown separately in the Schools card above.
Census & demographics
- County
- Ocean County · 439,426 people
- City population
- 26,866
- Metro
- New York-Newark-Jersey City, NY-NJ-PA
- Population (ZIP)
- 26,866
- Household income
- $93,584
- Rent vs Own
- Severe rent burden
- 384.0
Population outlook (Ocean County) Hauer SSP2
- Today (2025)
- 586,991 people
- By 2030
- 581,403 · -1.0%
- By 2040
- 564,913 · -3.8%
- By 2050
- 538,149 · -8.3%
- By 2075
- 468,845 · -20.1%
- By 2100
- 350,297 · -40.3%
Race, ethnicity, and origin ACS 2023
- Neighborhood character
- Predominantly White (86%)
- Race & ethnicity
- White 86% Two or more races 7% Hispanic / Latino 6% Black 3% Asian 1%
- Hispanic origin (detail)
- Puerto Rican 3%
- Common ancestry
- Romanian 9% Scotch-Irish 2% Serbian 1%
- Foreign-born
- 5% · Canada, Vietnam, China
- Languages at home
- 94% English-only · Spanish 2% Other Indo-European 1% Arabic 1%
Political lean MEDSL · Ocean
- 2024 margin
- Solid R (+36.0) · D 31.4% · R 67.4% · Other 1.2%
- 2008→2024 swing
- -17.6pp toward R · 2008: -18.4pp · 2024: -36.0pp
- All cycles
- 2024: R+36.0 2020: R+28.7 2016: R+34.0 2012: R+17.7 2008: R+18.4
Not yet ingested
- Civics
- —
Market trends
- HPI YoY
- ▼ -204.01%
- Current HPI
- 344.3189
- Rent YoY
- —
- Metro
- New York-Newark-Jersey City, NY-NJ-PA
- State GDP YoY
- ▲ 2.05%
- F500 in state
- 34
Industry mix (Fortune 500 HQ in NJ)
| Industry | F500 HQs | Revenue |
|---|---|---|
| Consumer Goods | 3 | $31B |
|
||
| Pharmaceuticals | 2 | $153B |
|
||
| Technology | 2 | $21B |
|
||
| Insurance | 2 | $20B |
|
||
| Healthcare | 2 | $19B |
|
||
| Financial Services | 1 | $70B |
|
||
Price history
+318.0% since first listed13 events — show timeline
- 2025-02-02 Pending — MOMLS
- 2025-01-18 Listed $420,000 MOMLS
- 2025-01-15 Coming Soon $420,000 MOMLS
- 2014-09-26 Sold (MLS) $156,000 SJSRMLS
- 2014-09-26 Sold (MLS) $156,000 BRIGHT MLS
- 2014-08-25 Listing Removed — SJSRMLS
- 2014-07-11 Listed $157,500 SJSRMLS
- 2014-07-11 Listed $157,500 BRIGHT MLS
- 1995-11-06 Sold (Public Records) $86,000 Public Records
- 1995-11-01 Sold (MLS) $86,000 MOMLS
- 1995-08-25 Delisted — MOMLS
- 1995-01-11 Listed $89,900 MOMLS
- 1987-09-17 Sold (Public Records) $100,490 Public Records
Property tax history
+2.1%/yrLatest (2025): $6,884 · +3.6% YoY. Source: county tax records.
Cash-flow waterfall
monthlySold comps — $/sqft
last 12 mo · ≤1 miLoading sold comps…