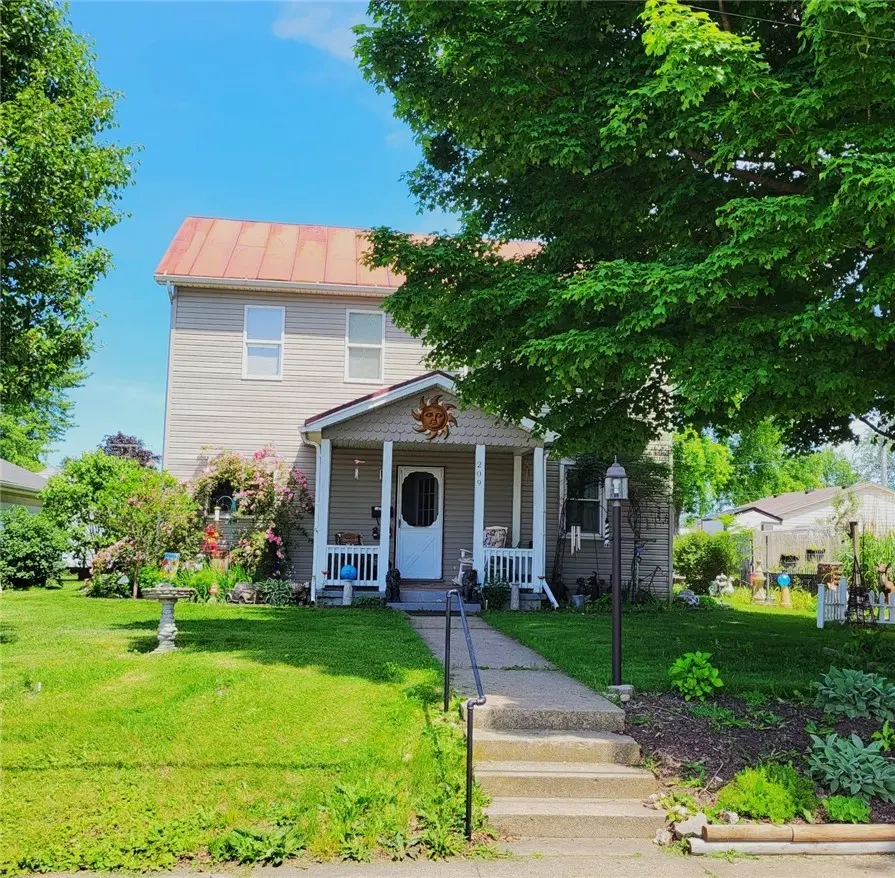
209 Hiddeson Ave · Greenville, OH
Flood risk 1/10 · Minimal
- FEMA flood zone
- X (unshaded)
- Chance of flooding over 30 yrs
- 0.0%
- Est. flood insurance / yr
- $473 – $860
Fire risk 1/10 · Minimal
- Est. fire insurance / yr
- $713 – $1,323
Heat risk 3/10 · Minor
- Hot days now (above 100°F)
- 7 days/yr
- Hot days in 30 yrs
- 18 days/yr
Wind risk 2/10 · Minimal
- Chance of severe wind over 30 yrs
- —
Air-quality risk 3/10 · Minor
- Unhealthy air days now
- 2 days/yr
- Unhealthy air days in 30 yrs
- 3 days/yr
Risk factors via First Street. Map © Google.
Why this score? — see what drove the B+ grade
The composite is a weighted blend of 9 inputs, each scored 0–100. Each bar is that input's sub-score; the figure is the points it added to the 100-point composite (weight × sub-score).
- Cash flow +30.0/30.0
- ARV discount +15.0/15.0
- DSCR +10.0/10.0
- 1% rule +8.1/10.0
- Schools +4.1/10.0
- Livability +3.5/5.0
- Rent growth +2.5/5.0
- Condition / age +2.5/5.0
- Appreciation +0.0/10.0
$100,000
🖨 Deal sheet 📄 Offer letter ✓ Due diligence
Listing remarks MLS
Total Makeover
Key facts
- Covered front porch
- Durable metal roof
- Wood siding
Tags
Property features AI
Finance
- Financial info: Offered for sale
Exterior
- Parking: No garage
- Utilities: Central air conditioning; Forced-air heating
- Home design: Two-story home; Vinyl siding exterior
- Construction: Vinyl siding construction
- Exterior features: Residential lot (approx. 0.344 acres); Lot dimensions approximately 118 x 127
Interior
- Kitchen: Kitchen on main level (15 x 10)
- Bedrooms: Main-level bedroom (11 x 10); Main-level bedroom (18 x 18); Second-level bedroom (10 x 12); Second-level bedroom (10 x 10)
- Bathrooms: 2 full bathrooms; 1 main-level bathroom
- Heating & cooling: Forced-air heating; Central air conditioning
- Interior features: Unfinished basement
- Laundry & utility: Main-level laundry room (10 x 8); Utility room on main level (13 x 11)
Neighborhood map
What this means for you Summary
Snapshot
- This is a 4-bed/2.0-bath single-family listed at $100k.
Deal economics
- At list price, monthly cash flow is $381 ($5k/yr) — positive.
- The deal already cash-flows at list — no discount required.
- Meets the 1% rule at list price ($1k rent vs $100k).
- Recommended offer: $98k (1.5% below list) — sets the bar for market timing.
- Cap rate 10.9% vs local median 3.9% in Greenville — top-decile yield for the area; either an underpriced asset or a hidden risk that comps aren't pricing in. Stress-test before assuming the spread holds.
Location & tenants
- Location reads 69/100 on livability (#514 in OH) — a middle-class / working-renter tenant base. Strengths: cost of living A+, housing A+; Watch: health & safety C-, amenities F, commute F.
- Greenville City (town): math 49% / reading 50% proficiency, ranked #456 of 656 in OH (top 70%) — families likely to look elsewhere, expect single-tenant / working-renter base with shorter leases.
- Market conditions: 73 active listings in the ZIP; 43 units permitted in Darke County in 2024 (0 in 5+ unit buildings).
Forward outlook
- Local home prices are declining (-3.0%/yr); year-one equity from $691 of loan paydown is wiped out by about $3k of value loss. Plan a longer hold.
- Darke County population projected at -20% by 2050 — secular population decline; favor cash flow + early exit over multi-decade hold.
- At projected returns (-3.0% appreciation + 3.0% rent growth), your $28k cash investment doubles in ~8 years — after that, you're playing with house money.
Negotiation context
- It's been on market 20 days — a 2% lower offer ($98k) is reasonable based on typical stale-listing flexibility.
- 4 sale attempts since 18y ago with the ask held roughly flat each time — persistent listings suggest the price (not the market) is what's stuck; bring a comps-based counter.
- Current owner paid $86k; 16% above their basis — modest negotiation headroom, anchor on the comps not their cost.
Risks & watch-outs
- Watch-outs: built in 1900 — expect roof / HVAC / electrical / plumbing capex.
Questions for the listing agent
- Built in 1900 — when were the roof, HVAC, electrical panel, plumbing, and water heater last replaced?
- Is there a deadline driving the sale (1031 exchange, divorce, estate, relocation)? That informs how much negotiation room exists.
- What's the average days-on-market for RENTAL listings here right now (not sales)? A rising rental-DOM trend means longer vacancies and softer asking-rent achievability than the comps imply.
- What's the recent tenant-quality profile in this submarket — average credit score on applications, eviction rate, late-payment / NSF rate, and stable-employment percentage? A property-management company in the area should have these aggregated.
- How much new for-sale + rental construction is in the pipeline within 1–3 miles? Heavy new supply typically softens prices + rents 12–24 months out; constrained supply supports both.
Investment metrics
- 1% rule
- 1.31% ✓
- Cap rate
- 10.86%
- Cash-on-cash
- 16.32%
- DSCR
- 1.73
- GRM
- 6.4
CMA / ARV
- ARV (on-the-fly)
- $133,365
- Comps found
- 12
Show comp detail 12 sales within ~0.75 mi
| Address | Dist | Beds/Ba | Sqft | Sold | Price | $/sf | Match |
|---|---|---|---|---|---|---|---|
| 220 Anderson Ave | 0.11mi | 4/1.0 | 1,676 (+7%) | 5mo | $120,000 | $72 | 76 |
| 210 Central Ave | 0.44mi | 3/2.0 (-1) | 1,672 (+7%) | 2mo | $140,000 | $84 | 62 |
| 319 Locust St | 0.47mi | 3/1.5 (-1) | 1,680 (+7%) | 7mo | $140,000 | $83 | 54 |
| 537 E 3rd St | 0.49mi | 3/1.0 (-1) | 1,694 (+8%) | 1mo | $70,000 | $41 | 54 |
| 624 E 3rd St | 0.56mi | 3/1.5 (-1) | 1,664 (+6%) | 4mo | $77,000 | $46 | 54 |
| 322 Sweitzer St | 0.60mi | 4/1.0 | 1,440 (-8%) | 2mo | $175,000 | $122 | 52 |
| 318 E Water St | 0.57mi | 3/1.5 (-1) | 1,461 (-7%) | 4mo | $195,000 | $133 | 52 |
| 337 W Main St | 0.58mi | 3/1.0 (-1) | 1,458 (-7%) | 3mo | $149,500 | $103 | 50 |
| 524 Gray Ave | 0.34mi | 3/1.0 (-1) | 1,368 (-13%) | 6mo | $60,000 | $44 | 49 |
| 209 Chestnut St | 0.60mi | 3/2.0 (-1) | 1,433 (-9%) | 5mo | $161,000 | $112 | 48 |
| 156 Pine St | 0.54mi | 3/1.0 (-1) | 1,358 (-13%) | 1mo | $115,000 | $85 | 43 |
| 723 Gray Ave | 0.53mi | 3/1.5 (-1) | 1,338 (-15%) | 3mo | $119,000 | $89 | 41 |
Match score weights: distance 35% · size 25% · config 20% · recency 20%. Top-matched comps best support the ARV.
Projected returns pro-forma
-3.0% appreciation · 3.0% rent growth · sell at horizon
- IRR
- 7.4%
- Equity multiple
- 1.29×
- Total profit
- $8,045
- Equity at exit
- $14,910
- IRR
- 16.6%
- Equity multiple
- 2.37×
- Total profit
- $38,220
- Equity at exit
- $8,646
Cash invested: $28,000 (down + closing). Projections, not guarantees.
Landlord ↔ Tenant lean methodology
- Overall (STATE)
- 73 Landlord-Friendly
- State Ohio
- 73 Landlord-Friendly · R+6
- County
- — inherits STATE
- City
- — inherits STATE
ZIP-level market 45331
- Active inventory
- 73
- Price-to-rent
- 6.4×
Monthly cashflow live
- Estimated rent
- $1,308 medium interval (Pro) →
- Mortgage (P&I)
- −$524
- Tax from tax record
- −$87 /mo · $1,041/yr
- Insurance
- −$42
- HOA
- −$0
- Vacancy / Maint / Mgmt
- −$275
- Net cashflow
- $381
Break-even live
UW: 25.0% down · 7.5% · 30yr · 1.5% tax · 5.0% vac · 8.0% maint · 8.0% mgmt
Financing live
Cash to close
- Down payment
- $25,000
- Closing costs
- $3,000
- Reserves months
- —
- Total cash needed
- —
Loan-product check · same deal, 3 products live
Conventional
25% down · 7.5% · 30yr
- Down + closing
- —
- Monthly P&I
- —
- Monthly cashflow
- —
- DSCR
- —
- Eligible?
- —
Personal DTI + credit; lowest rate.
DSCR
20% down · 8.5% · 30yr
- Down + closing
- —
- Monthly P&I
- —
- Monthly cashflow
- —
- DSCR
- —
- Eligible?
- —
No personal income docs; deal must DSCR.
Hard money
10% down · 12.0% · 12mo
- Down + closing
- —
- Monthly P&I
- —
- Monthly cashflow
- —
- DSCR
- —
- Eligible?
- —
Short-term bridge; refi at stabilization.
Listing history 24 events
-
2026-06-18days on market $100,000 Active 20 DOM
-
2026-06-17days on market $100,000 Active 19 DOM
-
2026-06-16days on market $100,000 Active 18 DOM
-
2026-06-15days on market $100,000 Active 17 DOM
-
2026-06-13days on market $100,000 Active 15 DOM
-
2026-06-12days on market $100,000 Active 14 DOM
-
2026-06-09days on market $100,000 Active 11 DOM
-
2026-06-08days on market $100,000 Active 10 DOM
-
2026-06-08days on market $100,000 Active 9 DOM
-
2026-06-07days on market $100,000 Active 8 DOM
-
2026-06-04days on market $100,000 Active 5 DOM
-
2026-06-02days on market $100,000 Active 4 DOM
-
2026-06-01days on market $100,000 Active 3 DOM
-
2026-05-31days on market $100,000 Active 2 DOM
-
2026-05-01$100,000 Active
-
2011-03-21soldstatus $85,900
-
2011-03-15soldstatus $85,900 14-char remark
Show marketing remark (14 chars)
Total Makeover
-
2010-12-31$83,900 14-char remark
Show marketing remark (14 chars)
Total Makeover
-
2008-05-09soldstatus $23,500 141-char remark
Show marketing remark (141 chars)
Could be coverted back to 3 bedroom home. Large kitchen. Storage room off kitchen could be small dining room. Utility in enclosed back porch.
-
2008-05-01$23,900 141-char remark
Show marketing remark (141 chars)
Could be coverted back to 3 bedroom home. Large kitchen. Storage room off kitchen could be small dining room. Utility in enclosed back porch.
-
2008-04-18historical
-
2008-01-11$23,900
-
2003-07-31soldstatus $65,000
-
1997-08-11soldstatus $42,000
ⓘ Source: listings_history table (triggers on properties + properties_extension) + one-shot
backfill from property_details.listing_events for pre-trigger history.
Tax reassessment forecast OH · Partial reset (capped growth)
- Current annual tax
- $1,041 · $87/mo
- Projected year-2 tax
- $1,300 · $108/mo
- Expected delta
- +$260/yr (+$22/mo · 25.0%)
ⓘ Screening estimate from a state-policy table — verify with the county assessor before closing.
Climate risk First Street
- Flood 1/10 Low FEMA zone X (unshaded) · 0% chance over 30 yrs
- Wildfire 1/10 Low
- Heat 3/10 Moderate 7 d/yr ≥100°F today · 18 d/yr by 30 yrs out
- Wind 2/10 Low
- Air quality 3/10 Moderate 2 unhealthy d/yr today · 3 by 30 yrs out
Nearby sold comps map
Loading sold comps map…
Walkable amenities ~0.75 mi
Loading nearby amenities…
Taxation est. · year 1
- Rental income
- $15,700
- − Mortgage interest
- −$5,602
- − Property taxes
- −$1,041
- − Insurance
- −$500
- − Repairs & maintenance
- −$1,256
- − Management
- −$1,256
- − Depreciation
- −$2,909
- Taxable income
- $3,137
- Est. tax owed @ 24.0%
- −$753
- After-tax cash flow
- $3,817/yr
For passive investors: Depreciation is non-cash, so a rental often shows a tax loss while cash-flowing — sheltering income. Rental losses are passive: they offset passive income freely, and up to $25,000/yr can offset ordinary (W-2) income if you actively participate and your MAGI is under $100k (phasing out to $0 by $150k); unused losses carry forward. On sale, claimed depreciation is recaptured at up to 25%, and gains may owe capital-gains tax (a 1031 exchange can defer both). Figures are a year-1 estimate at your 24.0% rate — not tax advice; consult a CPA.
Schools (NCES district)
- District
- Greenville City
- NCES district ID
- 3904409
- Math proficiency
- 49% ▼ -15.00%
- Reading proficiency
- 50% ▼ -7.00%
- Median HH income
- $39,578
- Composite
- 41.38/100
- National rank
- #3488
- State rank
- #456 of 656 in OH
Livability — Greenville
- Score
- 69/100
- State rank
- #514
- US rank
- #8744
Category grades
Schools grade is shown separately in the Schools card above.
Census & demographics
- Census place
- Greenville, OH
- County
- Darke · 50,606 people
- Population (ZIP)
- 22,298
- Household income
- $53,797
- Rent vs Own
- Severe rent burden
- 13.3
Population outlook (Darke County) Hauer SSP2
- Today (2025)
- 49,377 people
- By 2030
- 47,494 · -3.8%
- By 2040
- 43,553 · -11.8%
- By 2050
- 39,320 · -20.4%
- By 2075
- 30,091 · -39.1%
- By 2100
- 21,110 · -57.2%
Race, ethnicity, and origin ACS 2023
- Neighborhood character
- Predominantly White (95%)
- Race & ethnicity
- White 95% Two or more races 3% Hispanic / Latino 2%
- Common ancestry
- Lithuanian 2% Italian 1% Iranian 1%
- Foreign-born
- 1% · Canada
- Languages at home
- 98% English-only · Spanish 1%
Political lean MEDSL · Darke
- 2024 margin
- Solid R (+65.4) · D 17.0% · R 82.3%
- 2008→2024 swing
- -29.2pp toward R · 2008: -36.1pp · 2024: -65.4pp
- All cycles
- 2024: R+65.4 2020: R+63.6 2016: R+61.2 2012: R+44.9 2008: R+36.1
Not yet ingested
- Civics
- —
Market trends
- HPI YoY
- ▼ -110.47%
- Current HPI
- 201.8715
- Rent YoY
- —
- Metro
- —
- State GDP YoY
- ▲ 1.98%
- F500 in state
- 48
Industry mix (Fortune 500 HQ in OH)
| Industry | F500 HQs | Revenue |
|---|---|---|
| Insurance | 3 | $145B |
|
||
| Industrial Machinery | 3 | $49B |
|
||
| Financial Services | 3 | $24B |
|
||
| Consumer Goods | 2 | $93B |
|
||
| Aerospace / Defense | 2 | $47B |
|
||
| Utilities | 2 | $33B |
|
||
Price history
+138.1% since first listed10 events — show timeline
- 2026-05-01 Listed $100,000 Dayton MLS
- 2011-03-21 Sold (Public Records) $85,900 Public Records
- 2011-03-15 Sold (MLS) $85,900 WRIST
- 2010-12-31 Listed $83,900 WRIST
- 2008-05-09 Sold (MLS) $23,500 WRIST
- 2008-05-01 Listed $23,900 WRIST
- 2008-04-18 Listing Removed — WRIST
- 2008-01-11 Listed $23,900 WRIST
- 2003-07-31 Sold (Public Records) $65,000 Public Records
- 1997-08-11 Sold (Public Records) $42,000 Public Records
Property tax history
+0.1%/yrLatest (2025): $1,041 · +0.1% YoY. Source: county tax records.
Cash-flow waterfall
monthlySold comps — $/sqft
last 12 mo · ≤1 miLoading sold comps…