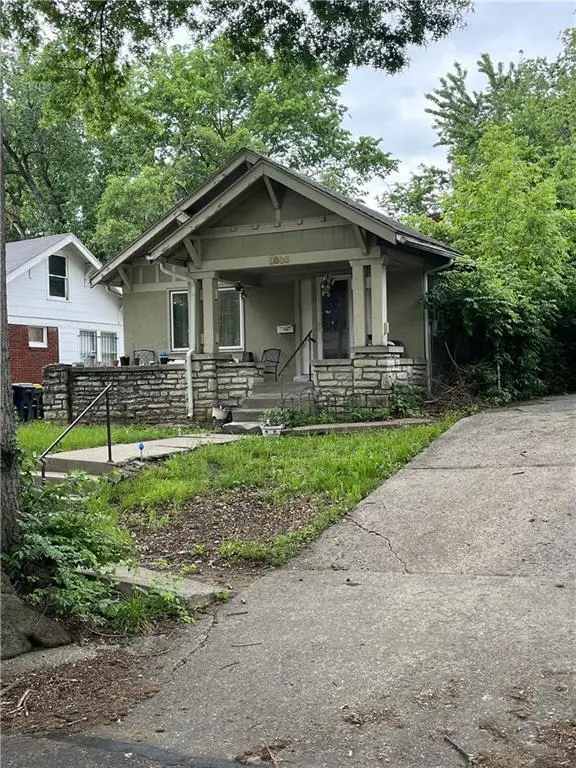
5808 Garfield Ave · Kansas City, MO
Flood risk 1/10 · Minimal
- FEMA flood zone
- X (unshaded)
- Chance of flooding over 30 yrs
- 0.0%
- Est. flood insurance / yr
- $473 – $860
Fire risk 1/10 · Minimal
- Est. fire insurance / yr
- $1,054 – $1,958
Heat risk 4/10 · Minor
- Hot days now (above 106°F)
- 7 days/yr
- Hot days in 30 yrs
- 17 days/yr
Wind risk 2/10 · Minimal
- Chance of severe wind over 30 yrs
- —
Air-quality risk 3/10 · Minor
- Unhealthy air days now
- 2 days/yr
- Unhealthy air days in 30 yrs
- 4 days/yr
Risk factors via First Street. Map © Google.
Why this score? — see what drove the B+ grade
The composite is a weighted blend of 9 inputs, each scored 0–100. Each bar is that input's sub-score; the figure is the points it added to the 100-point composite (weight × sub-score).
- Cash flow +30.0/30.0
- ARV discount +15.0/15.0
- 1% rule +10.0/10.0
- DSCR +10.0/10.0
- Livability +3.9/5.0
- Rent growth +3.6/5.0
- Condition / age +2.5/5.0
- Schools +1.5/10.0
- Appreciation +0.0/10.0
$80,250
🖨 Deal sheet 📄 Offer letter ✓ Due diligence
Listing remarks MLS
Pc6786 Corporate Owned Property * Being Sold In "As Is" Condition * Bring Your Investors.
Key facts
- 5,227 sq ft lot
- Built 1924
- Listed 8 days
Property features AI
Finance
- HOA & community: No association fees
Exterior
- Parking: Off-street parking; Shared driveway
- Utilities: Public water; Public sewer
- Home design: Single-family residential; Bungalow floor plan; Approximately 960 above-grade living area
- Construction: Metal siding; Composition roof
- Exterior features: Not in a flood plain; Lot about 5,227 square feet
Interior
- Kitchen: Cooktop; Refrigerator
- Bedrooms: 2 bedrooms (both on the first floor)
- Flooring: Carpet; Luxury vinyl
- Bathrooms: 1 full bathroom (first floor)
- Heating & cooling: Forced air heating; Window AC unit(s)
- Interior features: Living/dining combo; Full unfinished basement
- Laundry & utility: Laundry located in the basement
Neighborhood map
What this means for you Summary
Snapshot
- This is a 2-bed/1.0-bath single-family listed at $80k.
Deal economics
- At list price, monthly cash flow is $463 ($6k/yr) — positive.
- The deal already cash-flows at list — no discount required.
- Meets the 1% rule at list price ($1k rent vs $80k).
- Cap rate 13.2% vs local median 3.9% in Kansas City — top-decile yield for the area; either an underpriced asset or a hidden risk that comps aren't pricing in. Stress-test before assuming the spread holds.
Location & tenants
- Location reads 78/100 on livability (#28 in MO, #2,671 nationally) — a middle-class / working-renter tenant base. Strengths: amenities A+, commute A+, cost of living A+; Watch: schools C-, crime F.
- Kansas City 33 (urban): math 12% / reading 24% proficiency, ranked #308 of 324 in MO (top 95%) — low school quality limits family demand, transient renter base, plan for 1-2y turnover; 75% free/reduced lunch — lower-income household profile, screen leases tightly.
- Market conditions: Rents rising fast (+4.4%/yr); 187 active listings in the ZIP; 40 comparable units currently listed for rent nearby; rentals at typical pace (median 24d on market — plan ~3-4 weeks tenant-placement turnaround); lower-income renter base — watch delinquency; 4,002 units permitted in Jackson County in 2024 (2,271 in 5+ unit buildings).
- This rent runs 35% of the median local income ($42k/yr) — at the standard rent-burdened threshold; future hikes will face affordability resistance.
Forward outlook
- Local home prices are declining (-3.0%/yr); year-one equity from $554 of loan paydown is wiped out by about $2k of value loss. Plan a longer hold.
- Jackson County population projected at +4% by 2050 — modest demand growth; plan on rents tracking national, not racing it.
- At projected returns (-3.0% appreciation + 4.4% rent growth), your $22k cash investment doubles in ~5 years — after that, you're playing with house money.
Negotiation context
- Only 8 days on market — expect competitive offers; lowballing is unlikely to land.
- 3 sale attempts since 26y ago with the ask held roughly flat each time — persistent listings suggest the price (not the market) is what's stuck; bring a comps-based counter.
Risks & watch-outs
- Watch-outs: built in 1924 — expect roof / HVAC / electrical / plumbing capex.
Questions for the listing agent
- Built in 1924 — when were the roof, HVAC, electrical panel, plumbing, and water heater last replaced?
- Is there a deadline driving the sale (1031 exchange, divorce, estate, relocation)? That informs how much negotiation room exists.
- Crime grade is F in this area — have there been break-ins, vandalism, or insurance claims at this property in the last 3 years? What carrier currently insures it and at what premium?
- What's the average days-on-market for RENTAL listings here right now (not sales)? A rising rental-DOM trend means longer vacancies and softer asking-rent achievability than the comps imply.
- What's the recent tenant-quality profile in this submarket — average credit score on applications, eviction rate, late-payment / NSF rate, and stable-employment percentage? A property-management company in the area should have these aggregated.
- How much new for-sale + rental construction is in the pipeline within 1–3 miles? Heavy new supply typically softens prices + rents 12–24 months out; constrained supply supports both.
Investment metrics
- 1% rule
- 1.55% ✓
- Cap rate
- 13.21%
- Cash-on-cash
- 24.71%
- DSCR
- 2.10
- GRM
- 5.4
CMA / ARV
- ARV (on-the-fly)
- $134,400
- Comps found
- 12
Show comp detail 12 sales within ~0.75 mi
| Address | Dist | Beds/Ba | Sqft | Sold | Price | $/sf | Match |
|---|---|---|---|---|---|---|---|
| 5808 Garfield Ave | 0.00mi | 2/1.0 | 960 (0%) | 0mo | $80,250 | $84 | 100 |
| 5415 Highland Ave | 0.54mi | 2/1.0 | 928 (-3%) | 1mo | $129,900 | $140 | 68 |
| 5306 Olive St | 0.66mi | 2/1.0 | 946 (-2%) | 0mo | $154,900 | $164 | 67 |
| 5507 Park Ave | 0.41mi | 2/1.0 | 874 (-9%) | 5mo | $94,900 | $109 | 62 |
| 5728 Forest Ave | 0.70mi | 2/1.0 | 1,020 (+6%) | 4mo | $95,000 | $93 | 54 |
| 5737 Virginia Ave | 0.48mi | 2/1.0 | 1,086 (+13%) | 6mo | $150,000 | $138 | 50 |
| 6131 Tracy Ave | 0.67mi | 3/1.5 (+1) | 1,023 (+7%) | 2mo | $199,900 | $195 | 49 |
| 5842 Bellefontaine Ave | 0.62mi | 3/1.0 (+1) | 864 (-10%) | 1mo | $89,900 | $104 | 49 |
| 6207 Forest Ave | 0.75mi | 2/1.0 | 874 (-9%) | 6mo | $130,000 | $149 | 46 |
| 6205 Forest Ave | 0.74mi | 2/1.0 | 1,055 (+10%) | 6mo | $150,000 | $142 | 44 |
| 2816 E 63rd St | 0.73mi | 3/1.0 (+1) | 1,056 (+10%) | 1mo | $139,900 | $132 | 44 |
| 5400 Paseo Blvd | 0.65mi | 3/2.0 (+1) | 864 (-10%) | 4mo | $159,000 | $184 | 41 |
Match score weights: distance 35% · size 25% · config 20% · recency 20%. Top-matched comps best support the ARV.
Projected returns pro-forma
-3.0% appreciation · 4.42% rent growth · sell at horizon
- IRR
- 19.6%
- Equity multiple
- 1.81×
- Total profit
- $18,269
- Equity at exit
- $11,966
- IRR
- 28.8%
- Equity multiple
- 3.74×
- Total profit
- $61,458
- Equity at exit
- $6,939
Cash invested: $22,470 (down + closing). Projections, not guarantees.
Landlord ↔ Tenant lean methodology
- Overall (STATE)
- 81 Strongly Landlord-Friendly
- State Missouri
- 81 Strongly Landlord-Friendly · R+10
- County
- — inherits STATE
- City
- — inherits STATE
ZIP-level market 64130
- Home prices YoY
- -21.5%
- Rents YoY
- 4.4%
- Active inventory
- 187
- Price-to-rent
- 5.4×
Monthly cashflow live
- Estimated rent
- $1,243 high interval (Pro) →
- Mortgage (P&I)
- −$421
- Tax from tax record
- −$65 /mo · $780/yr
- Insurance
- −$33
- HOA
- −$0
- Vacancy / Maint / Mgmt
- −$261
- Net cashflow
- $463
Break-even live
UW: 25.0% down · 7.5% · 30yr · 1.5% tax · 5.0% vac · 8.0% maint · 8.0% mgmt
Financing live
Cash to close
- Down payment
- $20,062
- Closing costs
- $2,408
- Reserves months
- —
- Total cash needed
- —
Loan-product check · same deal, 3 products live
Conventional
25% down · 7.5% · 30yr
- Down + closing
- —
- Monthly P&I
- —
- Monthly cashflow
- —
- DSCR
- —
- Eligible?
- —
Personal DTI + credit; lowest rate.
DSCR
20% down · 8.5% · 30yr
- Down + closing
- —
- Monthly P&I
- —
- Monthly cashflow
- —
- DSCR
- —
- Eligible?
- —
No personal income docs; deal must DSCR.
Hard money
10% down · 12.0% · 12mo
- Down + closing
- —
- Monthly P&I
- —
- Monthly cashflow
- —
- DSCR
- —
- Eligible?
- —
Short-term bridge; refi at stabilization.
Rent comps 40 comps
| Address | Beds | Baths | Sqft | Rent | $/sqft | DOM | Units | Dist |
|---|---|---|---|---|---|---|---|---|
| 2100 E 58th St Kansas City, MO | 2.0 | 1.0 | 1030 | $1,500 | $1.46 | 43d | 1 | 0.06mi |
| 5730 Garfield Ave Kansas City, MO | 3.0 | 1.0 | 866 | $1,195 | $1.38 | 16d | 1 | 0.06mi |
| 5702 Euclid Ave Kansas City, MO | 2.0 | 1.0 | 683 | $1,000 | $1.46 | 43d | 1 | 0.14mi |
| 5713 Brooklyn Ave Kansas City, MO | 2.0 | 1.0 | 600 | $1,200 | $2.00 | 7d | 1 | 0.15mi |
| 2205 E 59th St Kansas City, MO | 2.0 | 1.0 | 724 | $1,025 | $1.42 | 16d | 1 | 0.16mi |
| 5529 Michigan Ave Kansas City, MO | 2.0 | 1.0 | 847 | $995 | $1.17 | 43d | 1 | 0.33mi |
| 2512 E 59th St Kansas City, MO | 2.0 | 1.0 | 750 | $1,150 | $1.53 | 43d | 1 | 0.33mi |
| 1702 Bushman Dr Kansas City, MO | 1.0–2.0 | 1.0–2.0 | 895 | $1,065 | $1.19 | 43d | 1 | 0.42mi |
| 5410 Euclid Ave Kansas City, MO | 3.0 | 2.0 | 1119 | $1,395 | $1.25 | 43d | 1 | 0.49mi |
| 6014 Virginia Ave Kansas City, MO | 2.0 | 1.0 | 1072 | $1,111 | $1.04 | 7d | 1 | 0.54mi |
| 5332 Highland Ave Kansas City, MO | 3.0 | 1.0 | 1022 | $1,350 | $1.32 | 7d | 1 | 0.61mi |
| 6024 Tracy Ave Kansas City, MO | 3.0 | 1.0 | 1000 | $1,250 | $1.25 | 16d | 1 | 0.62mi |
| 6404 The Paseo Kansas City, MO | 1.0–2.0 | 1.0–2.0 | 942 | $1,600 | $1.70 | 2d | 6 | 0.80mi |
| 5446 Harrison St Unit 2F Kansas City, MO | 2.0 | 1.0 | 960 | $1,099 | $1.14 | 14d | 1 | 0.84mi |
| 5436 Harrison St Unit 1F Kansas City, MO | 2.0 | 1.0 | 1050 | $1,195 | $1.14 | 43d | 1 | 0.85mi |
| 5411 Harrison St Unit 1F Kansas City, MO | 2.0 | 1.0 | 900 | $1,199 | $1.33 | 23d | 1 | 0.86mi |
| 5409 Harrison St Unit 5411 Kansas City, MO | 2.0 | 1.0 | 900 | $1,199 | $1.33 | 23d | 1 | 0.86mi |
| 5407 Harrison St Unit 1F Kansas City, MO | 2.0 | 1.0 | 1025 | $1,195 | $1.17 | 43d | 1 | 0.86mi |
| 5405 Harrison St Unit 2F Kansas City, MO | 2.0 | 1.0 | 1025 | $1,295 | $1.26 | 16d | 1 | 0.86mi |
| 5405 Harrison St Unit 2F Kansas City, MO | 2.0 | 1.0 | 1025 | $1,295 | $1.26 | 19d | 1 | 0.86mi |
| 5405 Harrison St Kansas City, MO | 2.0 | 1.0 | 1025 | $1,295 | $1.26 | 16d | 1 | 0.86mi |
| 5114 Brooklyn Ave Kansas City, MO | 3.0 | 1.5 | 1116 | $1,300 | $1.16 | 7d | 1 | 0.86mi |
| 5614 Indiana Ave Kansas City, MO | 3.0 | 1.0 | 900 | $1,175 | $1.31 | 43d | 1 | 0.86mi |
| 6029 Indiana Ave Kansas City, MO | 2.0 | 1.0 | 832 | $1,150 | $1.38 | 43d | 1 | 0.90mi |
| 5709 Bales Ave Kansas City, MO | 2.0 | 1.0 | 782 | $1,095 | $1.40 | 23d | 1 | 0.92mi |
| 5424 Charlotte St Kansas City, MO | 2.0 | 1.0 | 958 | $1,395 | $1.46 | 19d | 1 | 0.96mi |
| 5424 Charlotte St Kansas City, MO | 2.0 | 1.0 | 958 | $1,395 | $1.46 | 16d | 1 | 0.96mi |
| 3600 E 57th St Kansas City, MO | 3.0 | 1.0 | 1037 | $1,250 | $1.21 | 43d | 1 | 0.97mi |
| 3615 E 58th St Unit 1 Kansas City, MO | 2.0 | 1.0 | 936 | $875 | $0.93 | 43d | 1 | 0.99mi |
| 3617 E 58th St Unit 2 Kansas City, MO | 2.0 | 1.0 | 936 | $875 | $0.93 | 43d | 1 | 0.99mi |
| 3604 E 61st St Unit 3604 Kansas City, MO | 3.0 | 1.0 | 875 | $1,300 | $1.49 | 43d | 1 | 1.02mi |
| 5335 Holmes St Unit 2F Kansas City, MO | 2.0 | 1.0 | 960 | $1,295 | $1.35 | 23d | 1 | 1.05mi |
| 5335 Holmes St Unit 2F Kansas City, MO | 2.0 | 1.0 | 960 | $1,295 | $1.35 | 16d | 1 | 1.05mi |
| 1435 E 66th Ter Kansas City, MO | 3.0 | 1.0 | 988 | $1,340 | $1.36 | 12d | 1 | 1.07mi |
| 662 E 63rd St Kansas City, MO | 2.0 | 2.0 | 951 | $1,655 | $1.74 | 44d | 1 | 1.07mi |
| 4930 Park Ave Kansas City, MO | 3.0 | 1.0 | 900 | $1,300 | $1.44 | 16d | 1 | 1.07mi |
| 1805 E 67th St Kansas City, MO | 2.0 | 1.0 | 1064 | $1,200 | $1.13 | 16d | 1 | 1.09mi |
| 3017 E 51st St Kansas City, MO | 2.0 | 1.0 | 621 | $1,303 | $2.10 | 7d | 1 | 1.09mi |
| 6653 Lydia Ave Kansas City, MO | 3.0 | 1.0 | 962 | $1,500 | $1.56 | 16d | 1 | 1.12mi |
| 5013 S Benton Ave Kansas City, MO | 3.0 | 1.0 | 978 | $1,225 | $1.25 | 23d | 1 | 1.13mi |
Listing history 12 events
-
2026-05-19$80,250 Active
-
2015-09-22soldstatus
-
2009-08-27soldstatus
-
2009-06-01historical
-
2009-02-03$45,000
-
2008-10-22soldstatus $360,000
-
2008-04-25soldstatus $55,000
-
2005-02-22soldstatus
-
2005-02-22soldstatus
-
2000-03-03soldstatus 103-char remark
Show marketing remark (103 chars)
Pc6786 Corporate Owned Property * Being Sold In "As Is" Condition * Bring Your Investors.
-
2000-01-05$17,900 103-char remark
Show marketing remark (103 chars)
Pc6786 Corporate Owned Property * Being Sold In "As Is" Condition * Bring Your Investors.
-
1981-03-01soldstatus
ⓘ Source: listings_history table (triggers on properties + properties_extension) + one-shot
backfill from property_details.listing_events for pre-trigger history.
Tax reassessment forecast MO · Resets to sale price
- Current annual tax
- $780 · $65/mo
- Projected year-2 tax
- $780 · $65/mo
- Expected delta
- $0/yr ($0/mo · 0.0%)
ⓘ Screening estimate from a state-policy table — verify with the county assessor before closing.
Climate risk First Street
- Flood 1/10 Low FEMA zone X (unshaded) · 0% chance over 30 yrs
- Wildfire 1/10 Low
- Heat 4/10 Moderate 7 d/yr ≥106°F today · 17 d/yr by 30 yrs out
- Wind 2/10 Low
- Air quality 3/10 Moderate 2 unhealthy d/yr today · 4 by 30 yrs out
Nearby sold comps map
Loading sold comps map…
Walkable amenities ~0.75 mi
Loading nearby amenities…
Taxation est. · year 1
- Rental income
- $14,917
- − Mortgage interest
- −$4,495
- − Property taxes
- −$780
- − Insurance
- −$401
- − Repairs & maintenance
- −$1,193
- − Management
- −$1,193
- − Depreciation
- −$2,335
- Taxable income
- $4,520
- Est. tax owed @ 24.0%
- −$1,085
- After-tax cash flow
- $4,469/yr
For passive investors: Depreciation is non-cash, so a rental often shows a tax loss while cash-flowing — sheltering income. Rental losses are passive: they offset passive income freely, and up to $25,000/yr can offset ordinary (W-2) income if you actively participate and your MAGI is under $100k (phasing out to $0 by $150k); unused losses carry forward. On sale, claimed depreciation is recaptured at up to 25%, and gains may owe capital-gains tax (a 1031 exchange can defer both). Figures are a year-1 estimate at your 24.0% rate — not tax advice; consult a CPA.
Schools (NCES district)
- District
- Kansas City 33
- NCES district ID
- 2916400
- Math proficiency
- 12% ▼ -8.00%
- Reading proficiency
- 24% ▬ 0.00%
- Median HH income
- $35,227
- Composite
- 14.8/100
- National rank
- #9387
- State rank
- #308 of 324 in MO
Livability — Kansas City
- Score
- 78/100
- State rank
- #28
- US rank
- #2671
Category grades
Schools grade is shown separately in the Schools card above.
Census & demographics
- Census place
- Kansas City, MO
- County
- Jackson County · 687,798 people
- City population
- 439,467
- Metro
- Kansas City, MO-KS
- Population (ZIP)
- 19,644
- Household income
- $42,221
- Rent vs Own
- Severe rent burden
- 1132.0
Population outlook (Jackson County) Hauer SSP2
- Today (2025)
- 719,589 people
- By 2030
- 731,456 · +1.6%
- By 2040
- 746,689 · +3.8%
- By 2050
- 749,289 · +4.1%
- By 2075
- 736,227 · +2.3%
- By 2100
- 668,210 · -7.1%
Race, ethnicity, and origin ACS 2023
- Neighborhood character
- Predominantly Black (80%)
- Race & ethnicity
- Black 80% White 9% Hispanic / Latino 8% Two or more races 6%
- Hispanic origin (detail)
- Mexican 5%
- Common ancestry
- Lithuanian 1% Swedish 0%
- Foreign-born
- 6% · Canada
- Languages at home
- 92% English-only · Spanish 7%
Political lean MEDSL · Jackson
- 2024 margin
- D (+19.3) · D 58.9% · R 39.5% · Other 1.6%
- 2008→2024 swing
- -6.1pp toward R · 2008: 25.4pp · 2024: 19.3pp
- All cycles
- 2024: D+19.3 2020: D+22.0 2016: D+16.6 2012: D+19.0 2008: D+25.4
Not yet ingested
- Civics
- —
Market trends
- HPI YoY
- ▼ -73.32%
- Current HPI
- 267.491
- Rent YoY
- ▲ 4.42%
- Metro
- Kansas City, MO-KS
- State GDP YoY
- ▲ 1.84%
- F500 in state
- 20
Industry mix (Fortune 500 HQ in MO)
| Industry | F500 HQs | Revenue |
|---|---|---|
| Healthcare | 1 | $163B |
|
||
| Insurance | 1 | $21B |
|
||
| Industrial Technology | 1 | $17B |
|
||
| Retail | 1 | $16B |
|
||
| Industrial Distribution | 1 | $10B |
|
||
| Utilities | 1 | $9B |
|
||
Price history
+348.3% since first listed12 events — show timeline
- 2026-05-19 Listed $80,250 Heartland MLS as Distributed by MLS Grid
- 2015-09-22 Sold (Public Records) — Public Records
- 2009-08-27 Sold (Public Records) — Public Records
- 2009-06-01 Listing Removed — Heartland MLS as Distributed by MLS Grid
- 2009-02-03 Listed $45,000 Heartland MLS as Distributed by MLS Grid
- 2008-10-22 Sold (Public Records) $360,000 Public Records
- 2008-04-25 Sold (Public Records) $55,000 Public Records
- 2005-02-22 Sold (Public Records) — Public Records
- 2005-02-22 Sold (Public Records) — Public Records
- 2000-03-03 Sold (MLS) — Heartland MLS as Distributed by MLS Grid
- 2000-01-05 Listed $17,900 Heartland MLS as Distributed by MLS Grid
- 1981-03-01 Sold (Public Records) — Public Records
Property tax history
-1.6%/yrLatest (2025): $780 · +19.7% YoY. Source: county tax records.
Cash-flow waterfall
monthlySold comps — $/sqft
last 12 mo · ≤1 miLoading sold comps…