 25-Plex
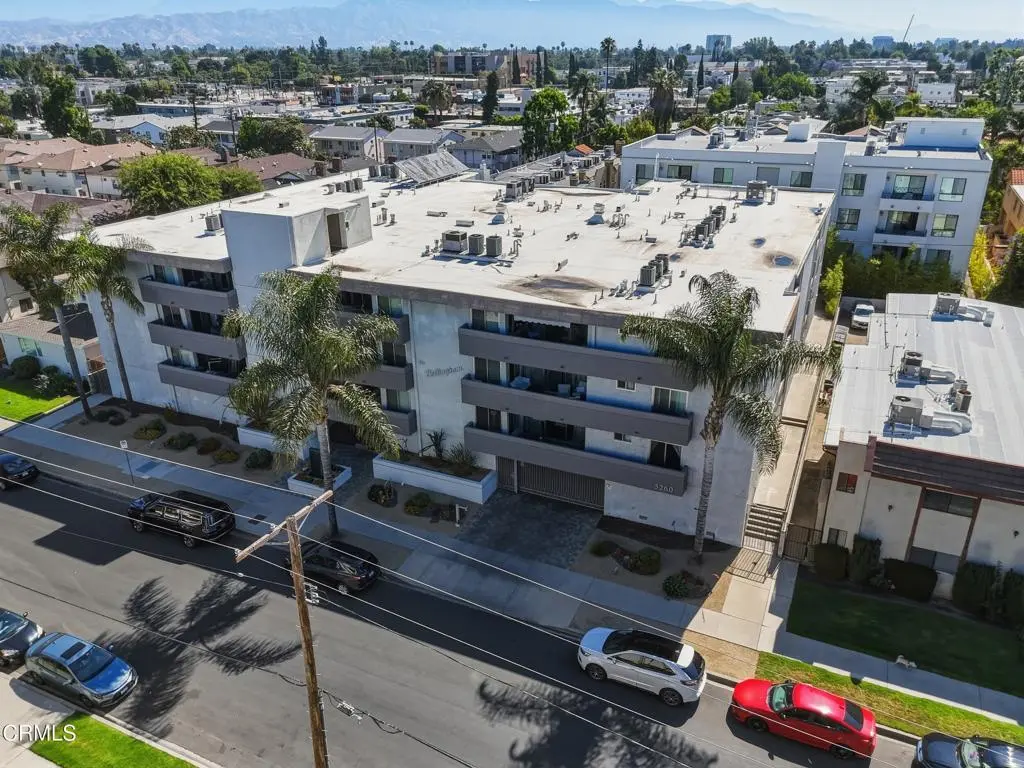
5260 Bellingham Ave · Los Angeles, CA
Flood risk 1/10 · Minimal
- FEMA flood zone
- X (unshaded)
- Chance of flooding over 30 yrs
- 0.0%
- Est. flood insurance / yr
- $507 – $1,088
Fire risk 1/10 · Minimal
- Est. fire insurance / yr
- $659 – $1,223
Heat risk 6/10 · Moderate
- Hot days now (above 97°F)
- 7 days/yr
- Hot days in 30 yrs
- 23 days/yr
Wind risk 1/10 · Minimal
- Chance of severe wind over 30 yrs
- —
Air-quality risk 5/10 · Moderate
- Unhealthy air days now
- 7 days/yr
- Unhealthy air days in 30 yrs
- 9 days/yr
Risk factors via First Street. Map © Google.
Why this score? — see what drove the C- grade
The composite is a weighted blend of 9 inputs, each scored 0–100. Each bar is that input's sub-score; the figure is the points it added to the 100-point composite (weight × sub-score).
- Cash flow +22.5/30.0
- ARV discount +7.5/15.0
- DSCR +7.2/10.0
- 1% rule +5.0/10.0
- Schools +3.6/10.0
- Livability +3.4/5.0
- Condition / age +2.5/5.0
- Rent growth +2.2/5.0
- Appreciation +0.0/10.0
$8,750,000
🖨 Deal sheet 📄 Offer letter ✓ Due diligence
Multi-family units
County records classify this as Multi-Family (5+ Unit). Listing-text estimate: 25 units. confirmed
5+ unit building — per-unit beds/baths from public records are typically unavailable; the breakdown below (if shown) is an estimate from the listing text.
Listing remarks
Exceptional investment opportunity in the heart of Valley Village featuring a 25-unit apartment community offering an attractive unit mix of twelve 2 bedroom / 2 bathroom units, twelve 1 bedroom / 1 bathroom units, and one spacious 3 bedroom / 3 bathroom unit. This well-maintained property combines strong income potential with desirable amenities in one of the San Fernando Valley's most sought-after rental markets. Residents enjoy controlled entry access, elevator service, a quiet community pool with adjoining patio area, fitness center, on-site storage, and a large community garage with assigned parking for each unit. The property is also equipped with solar panels and 11 electric vehicle
Key facts
- Elevator service
- Fitness center
- On-site storage
Tags
Property features AI
Finance
- Other: Multiple separate utility meters (examples: 1 water meter, 25 gas meters, 25 electric meters); One building on site; Access via paved city streets; directions: north of Magnolia Blvd, south of Chandler Blvd, west of Laurel Canyon Blvd, east of Whitsett Ave
- Financial info: Rent control applies; Tenants pay gas, phone, cable TV, and electricity; Reported gross income, expenses, and NOI available for the multi-unit property (investment details provided)
- HOA & community: Monthly association fees; Association amenities include gym/exercise room, onsite property management, pool, controlled access, and grounds maintenance; Community features include street lighting, sidewalks, and suburban setting
Exterior
- Parking: Community garage with controlled entrance and gated access; Garage spaces available (total garage spaces noted); Garage - single door and front-entry garage stalls; Street parking and driveway access
- Security: Controlled access; Card/code entry; Intercom; Smoke and carbon monoxide detectors
- Utilities: Public/district water; Public sewer (sewer paid); Natural gas connected; Electricity connected
- Home design: Attached property; Four-story building; Faces west; Turnkey condition; No ADU
- Construction: Stucco construction; Flat/common roof; Raised foundation; Year built source: public records
- Exterior features: In-ground community pool; Satellite dish; Fenced yard (block wall, chain link, wrought iron; good condition); Sprinklers none; Level with street; Landscaped front yard; Rectangular lot shape; Has view
Interior
- Kitchen: Refrigerator; Gas range; Dishwasher; Water heater unit; Stone counters
- Bedrooms: Units include 1-, 2- and 3-bedroom layouts (examples: 1 bed, 2 bed, 3 bed units listed)
- Flooring: Tile; Carpet
- Bathrooms: Units include 1-, 2- and 3-bathroom layouts (examples: 1 bath, 2 bath, 3 bath units listed)
- Heating & cooling: Central cooling; Central furnace heating
- Interior features: Intercom; Balcony (living room balcony); Elevator; Storage space; Stone counters; Card/code access; Carbon monoxide detector(s); Smoke detector
- Laundry & utility: In-unit laundry inside closet; Washer included; Dryer included
Neighborhood map
What this means for you Summary
Snapshot
- This is a 12×2bd/2ba + 12×1bd/1ba + 1×3bd/3ba units multifamily listed at $8.75M.
Deal economics
- At list price, monthly cash flow is $15k ($177k/yr) — positive. Per door: $591/mo.
- The deal already cash-flows at list — no discount required.
- To meet the 1% rule (rent ≥ 1% of price), the offer needs to be $8.71M (0.4% below list).
- Recommended offer: $8.62M (1.5% below list) — sets the bar for market timing.
- Cap rate 8.3% vs local median 2.1% in Los Angeles — top-decile yield for the area; either an underpriced asset or a hidden risk that comps aren't pricing in. Stress-test before assuming the spread holds.
Location & tenants
- Location reads 68/100 on livability (#273 in CA) — a middle-class / working-renter tenant base. Strengths: amenities A+, commute A+, employment B; Watch: health & safety C-, schools D+, crime F.
- Los Angeles Unified (urban): math 29% / reading 54% proficiency, ranked #223 of 517 in CA (top 43%) — families likely to look elsewhere, expect single-tenant / working-renter base with shorter leases; 67% free/reduced lunch — lower-income household profile, screen leases tightly.
- Market conditions: Rents soft (-1.1%/yr); 90 active listings in the ZIP; solid renter incomes; 19,697 units permitted in Los Angeles County in 2024 (9,426 in 5+ unit buildings).
- At $87,113/mo this rent would consume 1190% of the median local household income ($88k/yr) (locally 3099% of renters already pay >50% of income on rent) — very limited rent-growth headroom before tenants either downsize or default.
Forward outlook
- Local home prices are declining (-3.0%/yr); year-one equity from $60k of loan paydown is wiped out by about $262k of value loss. Plan a longer hold.
- Los Angeles County population projected at +9% by 2050 — modest demand growth; plan on rents tracking national, not racing it.
Negotiation context
- It's been on market 30 days — a 2% lower offer ($8.62M) is reasonable based on typical stale-listing flexibility.
- Current owner paid $2.84M; list at $8.75M implies a 209% gain — meaningful room to come down on a strong offer.
Risks & watch-outs
- Climate carrying-cost: extreme-heat days projected 7→23/yr by 2055 (HVAC capex compounding) — expect insurance premiums to compound above CPI over the hold.
Questions for the listing agent
- Can we see the unit-by-unit rent roll, current vacancy, and any below-market leases? What's the average tenancy length?
- What capital expenditures (roof, boiler, parking lot, exteriors) have been made in the last 5 years, and what's planned in the next 2?
- Built in 1977 — when were the roof, HVAC, electrical panel, plumbing, and water heater last replaced?
- Is there a deadline driving the sale (1031 exchange, divorce, estate, relocation)? That informs how much negotiation room exists.
- Schools are D-rated, which usually means shorter tenancies and higher turnover. Who's the typical renter profile here, and what's been the actual vacancy rate?
- Crime grade is F in this area — have there been break-ins, vandalism, or insurance claims at this property in the last 3 years? What carrier currently insures it and at what premium?
- What's the average days-on-market for RENTAL listings here right now (not sales)? A rising rental-DOM trend means longer vacancies and softer asking-rent achievability than the comps imply.
- What's the recent tenant-quality profile in this submarket — average credit score on applications, eviction rate, late-payment / NSF rate, and stable-employment percentage? A property-management company in the area should have these aggregated.
- How much new apartment / multifamily construction is in the pipeline within 1–3 miles? Heavy new supply (>2% of stock underway) typically softens rents 12–24 months out; light construction supports rent growth.
Investment metrics
- 1% rule
- 1.00% ✗
- Cap rate
- 8.32%
- Cash-on-cash
- 7.24%
- DSCR
- 1.32
- GRM
- 8.4
CMA / ARV
No comps found within radius.
Projected returns pro-forma
-3.0% appreciation · 0.0% rent growth · sell at horizon
- IRR
- -8.4%
- Equity multiple
- 0.70×
- Total profit
- $-734,873
- Equity at exit
- $1,304,653
- IRR
- -3.0%
- Equity multiple
- 0.83×
- Total profit
- $-425,624
- Equity at exit
- $756,540
Cash invested: $2,450,000 (down + closing). Projections, not guarantees.
Landlord ↔ Tenant lean methodology
- Overall (CITY)
- 0 Strongly Tenant-Friendly
- State California
- 18 Strongly Tenant-Friendly · D+13
- County
- — inherits STATE
- City Los Angeles
- 0 Strongly Tenant-Friendly · D+22
ZIP-level market 91607
- Rents YoY
- -1.1%
- Active inventory
- 90
- Price-to-rent
- 185.5×
Monthly cashflow live
- Estimated rent
- $87,113 high interval (Pro) →
- Mortgage (P&I)
- −$45,886
- Tax from tax record
- −$4,514 /mo · $54,168/yr
- Insurance
- −$3,646
- HOA
- −$0
- Vacancy / Maint / Mgmt
- −$18,294
- Net cashflow
- $14,773
Break-even live
25-unit breakdown (identical units grouped — click to expand)
| Units | Beds | Baths | Est. rent |
|---|---|---|---|
| 12× units | 2 | 2 | $47,160 |
| #1 | 2 | 2 | $3,930 |
| #2 | 2 | 2 | $3,930 |
| #3 | 2 | 2 | $3,930 |
| #4 | 2 | 2 | $3,930 |
| #5 | 2 | 2 | $3,930 |
| #6 | 2 | 2 | $3,930 |
| #7 | 2 | 2 | $3,930 |
| #8 | 2 | 2 | $3,930 |
| #9 | 2 | 2 | $3,930 |
| #10 | 2 | 2 | $3,930 |
| #11 | 2 | 2 | $3,930 |
| #12 | 2 | 2 | $3,930 |
| 12× units | 1 | 1 | $35,796 |
| #13 | 1 | 1 | $2,983 |
| #14 | 1 | 1 | $2,983 |
| #15 | 1 | 1 | $2,983 |
| #16 | 1 | 1 | $2,983 |
| #17 | 1 | 1 | $2,983 |
| #18 | 1 | 1 | $2,983 |
| #19 | 1 | 1 | $2,983 |
| #20 | 1 | 1 | $2,983 |
| #21 | 1 | 1 | $2,983 |
| #22 | 1 | 1 | $2,983 |
| #23 | 1 | 1 | $2,983 |
| #24 | 1 | 1 | $2,983 |
| 1× unit | 3 | 3 | $4,152 |
| Total (25 units) | $87,113 | ||
UW: 25.0% down · 7.5% · 30yr · 1.5% tax · 5.0% vac · 8.0% maint · 8.0% mgmt
Financing live
Cash to close
- Down payment
- $2,187,500
- Closing costs
- $262,500
- Reserves months
- —
- Total cash needed
- —
Loan-product check · same deal, 3 products live
Conventional
25% down · 7.5% · 30yr
- Down + closing
- —
- Monthly P&I
- —
- Monthly cashflow
- —
- DSCR
- —
- Eligible?
- —
Personal DTI + credit; lowest rate.
DSCR
20% down · 8.5% · 30yr
- Down + closing
- —
- Monthly P&I
- —
- Monthly cashflow
- —
- DSCR
- —
- Eligible?
- —
No personal income docs; deal must DSCR.
Hard money
10% down · 12.0% · 12mo
- Down + closing
- —
- Monthly P&I
- —
- Monthly cashflow
- —
- DSCR
- —
- Eligible?
- —
Short-term bridge; refi at stabilization.
Listing history 16 events
-
2026-06-18days on market $8,750,000 Active 30 DOM
-
2026-06-17days on market $8,750,000 Active 29 DOM
-
2026-06-16days on market $8,750,000 Active 28 DOM
-
2026-06-15days on market $8,750,000 Active 27 DOM
-
2026-06-13days on market $8,750,000 Active 25 DOM
-
2026-06-09days on market $8,750,000 Active 21 DOM
-
2026-06-08days on market $8,750,000 Active 20 DOM
-
2026-06-07days on market $8,750,000 Active 19 DOM
-
2026-06-04days on market $8,750,000 Active 16 DOM
-
2026-06-03days on market $8,750,000 Active 15 DOM
-
2026-06-02days on market $8,750,000 Active 14 DOM
-
2026-06-01days on market $8,750,000 Active 13 DOM
-
2026-05-31days on market $8,750,000 Active 12 DOM
-
2026-05-20$8,750,000 Active
-
2002-11-22soldstatus $2,835,020
-
1998-06-02soldstatus $1,700,000
ⓘ Source: listings_history table (triggers on properties + properties_extension) + one-shot
backfill from property_details.listing_events for pre-trigger history.
Tax reassessment forecast CA · Resets to sale price
- Current annual tax
- $54,168 · $4,514/mo
- Projected year-2 tax
- $66,500 · $5,542/mo
- Expected delta
- +$12,332/yr (+$1,028/mo · 22.8%)
ⓘ Screening estimate from a state-policy table — verify with the county assessor before closing.
Climate risk First Street
- Flood 1/10 Low FEMA zone X (unshaded) · 0% chance over 30 yrs
- Wildfire 1/10 Low
- Heat 6/10 Major 7 d/yr ≥97°F today · 23 d/yr by 30 yrs out
- Wind 1/10 Low
- Air quality 5/10 Major 7 unhealthy d/yr today · 9 by 30 yrs out
Nearby sold comps map
Loading sold comps map…
Walkable amenities ~0.75 mi
Loading nearby amenities…
Taxation est. · year 1
- Rental income
- $1,045,356
- − Mortgage interest
- −$490,136
- − Property taxes
- −$54,168
- − Insurance
- −$43,750
- − Repairs & maintenance
- −$83,628
- − Management
- −$83,628
- − Depreciation
- −$254,545
- Taxable income
- $35,499
- Est. tax owed @ 24.0%
- −$8,520
- After-tax cash flow
- $168,762/yr
For passive investors: Depreciation is non-cash, so a rental often shows a tax loss while cash-flowing — sheltering income. Rental losses are passive: they offset passive income freely, and up to $25,000/yr can offset ordinary (W-2) income if you actively participate and your MAGI is under $100k (phasing out to $0 by $150k); unused losses carry forward. On sale, claimed depreciation is recaptured at up to 25%, and gains may owe capital-gains tax (a 1031 exchange can defer both). Figures are a year-1 estimate at your 24.0% rate — not tax advice; consult a CPA.
Schools (NCES district)
- District
- Los Angeles Unified
- NCES district ID
- 0622710
- Math proficiency
- 29% ▼ -4.00%
- Reading proficiency
- 54% ▲ 10.00%
- Median HH income
- $50,403
- Composite
- 35.67/100
- National rank
- #4875
- State rank
- #223 of 517 in CA
Livability — Los Angeles
- Score
- 68/100
- State rank
- #273
- US rank
- #9237
Category grades
Schools grade is shown separately in the Schools card above.
Census & demographics
- Census place
- Los Angeles, CA
- County
- Los Angeles County · 9,444,647 people
- City population
- 3,838,149
- Metro
- Los Angeles-Long Beach-Anaheim, CA
- Population (ZIP)
- 31,890
- Household income
- $87,874
- Rent vs Own
- Severe rent burden
- 3099.0
Population outlook (Los Angeles County) Hauer SSP2
- Today (2025)
- 10,940,515 people
- By 2030
- 11,256,481 · +2.9%
- By 2040
- 11,729,929 · +7.2%
- By 2050
- 11,948,407 · +9.2%
- By 2075
- 11,818,114 · +8.0%
- By 2100
- 10,842,928 · -0.9%
Race, ethnicity, and origin ACS 2023
- Neighborhood character
- Diverse neighborhood (Simpson 0.62)
- Race & ethnicity
- White 57% Hispanic / Latino 21% Two or more races 15% Asian 8% Black 7%
- Hispanic origin (detail)
- Mexican 11%
- Common ancestry
- Scotch-Irish 4% Romanian 3% Subsaharan African 2%
- Foreign-born
- 29% · Canada, Vietnam, Jamaica
- Languages at home
- 61% English-only · Spanish 16% Other Indo-European 9% Russian/Polish/Slavic 7%
Political lean MEDSL · Los Angeles
- 2024 margin
- Solid D (+32.9) · D 64.8% · R 31.9% · Other 3.3%
- 2008→2024 swing
- -7.4pp toward R · 2008: 40.4pp · 2024: 32.9pp
- All cycles
- 2024: D+32.9 2020: D+44.2 2016: D+48.0 2012: D+40.0 2008: D+40.4
Not yet ingested
- Civics
- —
Market trends
- HPI YoY
- ▼ -861.04%
- Current HPI
- 464.0519
- Rent YoY
- ▼ -1.13%
- Metro
- Los Angeles-Long Beach-Anaheim, CA
- State GDP YoY
- ▲ 3.21%
- F500 in state
- 116
Industry mix (Fortune 500 HQ in CA)
| Industry | F500 HQs | Revenue |
|---|---|---|
| Technology | 27 | $1,492B |
|
||
| Financial Services | 3 | $174B |
|
||
| Retail | 3 | $44B |
|
||
| Insurance | 3 | $26B |
|
||
| Media / Entertainment | 2 | $115B |
|
||
| Pharmaceuticals / Biotech | 2 | $62B |
|
||
Price history
+414.7% since first listed3 events — show timeline
- 2026-05-20 Listed $8,750,000 CRMLS
- 2002-11-22 Sold (Public Records) $2,835,020 Public Records
- 1998-06-02 Sold (Public Records) $1,700,000 Public Records
Property tax history
+1.7%/yrLatest (2025): $54,168 · +1.9% YoY. Source: county tax records.
Cash-flow waterfall
monthlySold comps — $/sqft
last 12 mo · ≤1 miLoading sold comps…