40 Walley Dr · Arab, AL
Flood risk 1/10 · Minimal
- FEMA flood zone
- X (unshaded)
- Chance of flooding over 30 yrs
- 0.0%
- Est. flood insurance / yr
- $507 – $1,088
Fire risk 4/10 · Minor
- Est. fire insurance / yr
- $916 – $1,700
Heat risk 5/10 · Moderate
- Hot days now (above 104°F)
- 7 days/yr
- Hot days in 30 yrs
- 21 days/yr
Wind risk 4/10 · Minor
- Chance of severe wind over 30 yrs
- 21.0%
Air-quality risk 2/10 · Minimal
- Unhealthy air days now
- 0 days/yr
- Unhealthy air days in 30 yrs
- 2 days/yr
Risk factors via First Street. Map © Google.
Why this score? — see what drove the D- grade
The composite is a weighted blend of 9 inputs, each scored 0–100. Each bar is that input's sub-score; the figure is the points it added to the 100-point composite (weight × sub-score).
- ARV discount +13.1/15.0
- Cash flow +10.4/30.0
- Livability +3.2/5.0
- DSCR +3.0/10.0
- Rent growth +2.5/5.0
- Condition / age +2.5/5.0
- Schools +2.2/10.0
- 1% rule +1.8/10.0
- Appreciation +0.0/10.0
$210,000
🖨 Deal sheet (PDF) 📄 Offer letter ✓ Due diligence
Listing remarks MLS
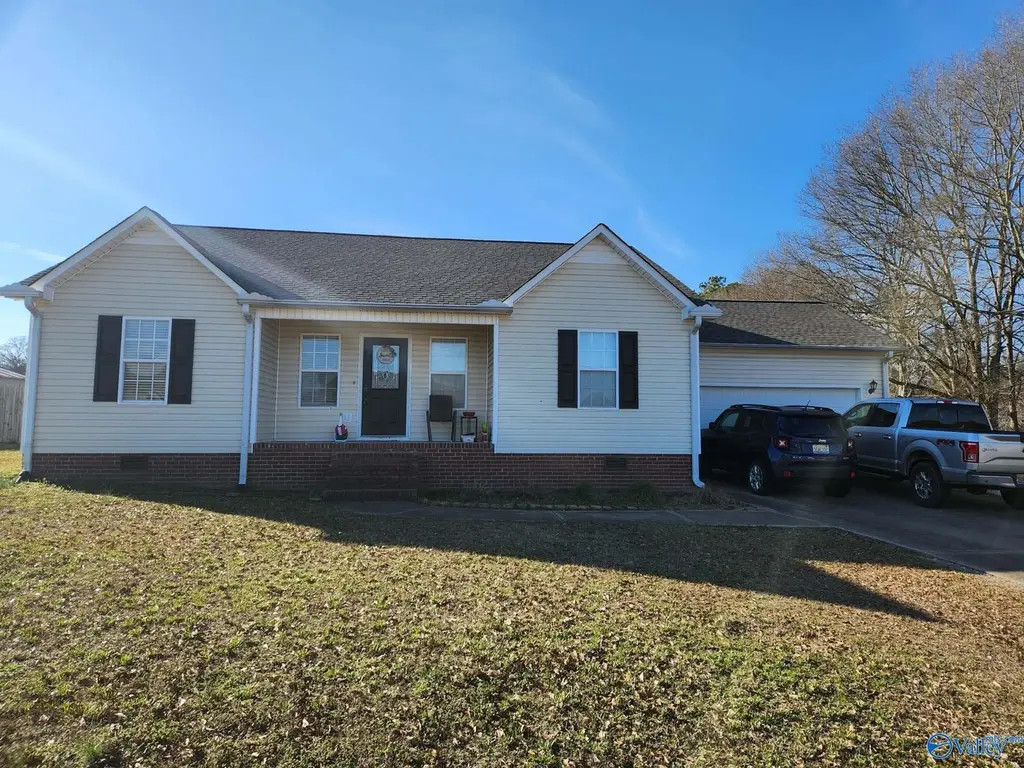
Charming 3BR, 2BA home with an attached garage. The interior boasts a soaring vaulted ceiling in the great room, an eat-in kitchen with a designated dining area, and a private, isolated master suite. Enjoy outdoor living with a covered front porch, back deck, and a fenced in backyard. Includes underground utilities. Call today and make it yours!
Key facts
- Covered front porch
- Private master suite
- Vaulted ceiling
Tags
Property features AI
Finance
- HOA & community: No homeowners association
Exterior
- Parking: Attached two-car garage that faces the front
- Utilities: Septic tank sewer
- Home design: Single-family residence; One level; Built in 2005
- Construction: Vinyl siding exterior
- Exterior features: Lot approximately 0.39 acres (about 100 x 170); Subdivision: Walley Estates
Interior
- Kitchen: Range; Dishwasher; Microwave; Refrigerator
- Bathrooms: 2 full bathrooms
- Heating & cooling: Central heating; Central cooling
- Interior features: Crawl space basement; Total of 8 rooms
Neighborhood map
What this means for you Summary
Snapshot
- This is a 3-bed/2.0-bath single-family listed at $210k.
Deal economics
- At list price, monthly cash flow is $-112 ($-1k/yr) — negative.
- To cash-flow at today's rent, offer at most $190k (9.4% below list).
- To meet the 1% rule (rent ≥ 1% of price), the offer needs to be $142k (32.5% below list).
- Recommended offer: $142k (32.5% below list) — sets the bar for 1% rule.
- Cap rate 5.7% vs local median 3.0% in Arab — top-decile yield for the area; either an underpriced asset or a hidden risk that comps aren't pricing in. Stress-test before assuming the spread holds.
Location & tenants
- Location reads 64/100 on livability (#149 in AL) — a middle-class / working-renter tenant base. Strengths: cost of living A+, housing A+; Watch: employment C-, crime D, amenities F.
- Marshall County (rural): math 14% / reading 38% proficiency, ranked #86 of 129 in AL (top 67%) — low school quality limits family demand, transient renter base, plan for 1-2y turnover; 63% free/reduced lunch — lower-income household profile, screen leases tightly.
- Zoned schools: Brindlee Mountain Elementary School (math 25% / reading 41%, grade F, #323 of 627 statewide, top 52%, 236 students, 46% FRL); Brindlee Mountain High School (math 7% / reading 27%, grade F, #195 of 305 statewide, top 68%, 553 students, 51% FRL).
- Market conditions: 178 active listings in the ZIP; 163 units permitted in Marshall County in 2024 (0 in 5+ unit buildings).
Forward outlook
- Local home prices are declining (-3.0%/yr); year-one equity from $1k of loan paydown is wiped out by about $6k of value loss. Plan a longer hold.
Negotiation context
- It's been on market 22 days — a 2% lower offer ($207k) is reasonable based on typical stale-listing flexibility.
- 6 sale attempts since 4y ago with the ask held roughly flat each time — persistent listings suggest the price (not the market) is what's stuck; bring a comps-based counter.
- Current owner paid $150k; 40% above their basis — modest negotiation headroom, anchor on the comps not their cost.
Risks & watch-outs
- Climate carrying-cost: extreme-heat days projected 7→21/yr by 2055 (HVAC capex compounding) — expect insurance premiums to compound above CPI over the hold.
Questions for the listing agent
- What do current leases actually rent for vs. the listed asking? Can we see a recent rent roll and the last 12 months of T-12 income?
- Is there a deadline driving the sale (1031 exchange, divorce, estate, relocation)? That informs how much negotiation room exists.
- Crime grade is D in this area — have there been break-ins, vandalism, or insurance claims at this property in the last 3 years? What carrier currently insures it and at what premium?
- The area grade is low — what's the realistic commute time and amenity access for the typical tenant pool here? Any planned neighborhood developments (good or bad) we should know about?
- What's the average days-on-market for RENTAL listings here right now (not sales)? A rising rental-DOM trend means longer vacancies and softer asking-rent achievability than the comps imply.
- What's the recent tenant-quality profile in this submarket — average credit score on applications, eviction rate, late-payment / NSF rate, and stable-employment percentage? A property-management company in the area should have these aggregated.
- How much new for-sale + rental construction is in the pipeline within 1–3 miles? Heavy new supply typically softens prices + rents 12–24 months out; constrained supply supports both.
Investment metrics
- 1% rule
- 0.68% ✗
- Cap rate
- 5.65%
- Cash-on-cash
- -2.28%
- DSCR
- 0.90
- GRM
- 12.3
CMA / ARV
- ARV (median comp)
- $239,678
- List price
- $210,000
- Delta
- -12.38%
- Verdict
- UNDERPRICED
- Comps
- 20 within 1.0 mi
Show comp detail 12 sales within ~0.75 mi
| Address | Dist | Beds/Ba | Sqft | Sold | Price | $/sf | Match |
|---|---|---|---|---|---|---|---|
| 1898 Lowery Rd NE | 0.18mi | 3/2.0 | 1,350 (+1%) | 2mo | $224,000 | $166 | 88 |
| 160 Walley Dr | 0.11mi | 3/2.0 | 1,423 (+7%) | 4mo | $240,000 | $169 | 80 |
| 74 Mary Jo Isom Ln | 0.15mi | 3/2.0 | 1,365 (+2%) | 16mo | $248,000 | $182 | 76 |
| 300 Temple Xing | 0.36mi | 3/2.0 | 1,360 (+2%) | 5mo | $225,000 | $165 | 76 |
| 222 Mary Jo Isom Ln | 0.22mi | 3/2.0 | 1,462 (+10%) | 5mo | $255,000 | $174 | 70 |
| 77 Temple Xing | 0.27mi | 3/2.0 | 1,451 (+9%) | 6mo | $245,500 | $169 | 68 |
| 223 Mary Jo Isom Ln | 0.24mi | 3/2.0 | 1,400 (+5%) | 22mo | $238,900 | $171 | 62 |
| 3629 Eddy Scant City Rd | 0.74mi | 2/1.0 (-1) | 1,322 (-1%) | 4mo | $129,000 | $98 | 51 |
| 295 Temple Xing | 0.32mi | 3/2.0 | 1,464 (+10%) | 22mo | $235,000 | $161 | 50 |
| 3516 Eddy Scant City Rd | 0.63mi | 3/2.0 | 1,398 (+5%) | 18mo | $220,000 | $157 | 48 |
| 653 Halston Rd | 0.72mi | 3/2.0 | 1,243 (-7%) | 13mo | $217,900 | $175 | 44 |
| 335 Maple Cir | 0.73mi | 3/2.0 | 1,280 (-4%) | 23mo | $260,000 | $203 | 40 |
Match score weights: distance 35% · size 25% · config 20% · recency 20%. Top-matched comps best support the ARV.
Projected returns pro-forma
-3.0% appreciation · 3.0% rent growth · sell at horizon
- IRR
- -20.2%
- Equity multiple
- 0.30×
- Total profit
- $-41,257
- Equity at exit
- $31,312
- IRR
- -13.3%
- Equity multiple
- 0.23×
- Total profit
- $-45,549
- Equity at exit
- $18,157
Cash invested: $58,800 (down + closing). Projections, not guarantees.
Landlord ↔ Tenant lean methodology
- Overall (STATE)
- 90 Strongly Landlord-Friendly
- State Alabama
- 90 Strongly Landlord-Friendly · R+15
- County
- — inherits STATE
- City
- — inherits STATE
ZIP-level market 35016
- Home prices YoY
- -28.0%
- Active inventory
- 178
- Price-to-rent
- 12.3×
Monthly cashflow live
- Estimated rent
- $1,418 medium interval (Pro) →
- Mortgage (P&I)
- −$1,101
- Tax from tax record
- −$43 /mo · $518/yr
- Insurance
- −$88
- HOA
- −$0
- Vacancy / Maint / Mgmt
- −$298
- Net cashflow
- $-112
Break-even live
Sensitivity live
| Price | -10% $7 | -5% $-52 | +0% $-112 | +5% $-171 | +10% $-231 |
|---|---|---|---|---|---|
| Rent | -10% $-224 | -5% $-168 | +0% $-112 | +5% $-56 | +10% $0 |
| Rate | -1.0pp $-6 | -0.5pp $-58 | base $-112 | +0.5pp $-166 | +1.0pp $-221 |
UW: 25.0% down · 7.5% · 30yr · 1.5% tax · 5.0% vac · 8.0% maint · 8.0% mgmt
Financing live
Cash to close
- Down payment
- $52,500
- Closing costs
- $6,300
- Reserves months
- —
- Total cash needed
- —
Loan-product check · same deal, 3 products live
Conventional
25% down · 7.5% · 30yr
- Down + closing
- —
- Monthly P&I
- —
- Monthly cashflow
- —
- DSCR
- —
- Eligible?
- —
Personal DTI + credit; lowest rate.
DSCR
20% down · 8.5% · 30yr
- Down + closing
- —
- Monthly P&I
- —
- Monthly cashflow
- —
- DSCR
- —
- Eligible?
- —
No personal income docs; deal must DSCR.
Hard money
10% down · 12.0% · 12mo
- Down + closing
- —
- Monthly P&I
- —
- Monthly cashflow
- —
- DSCR
- —
- Eligible?
- —
Short-term bridge; refi at stabilization.
Listing history 38 events
-
2026-06-18days on market $210,000 Active 22 DOM
-
2026-06-17days on market $210,000 Active 21 DOM
-
2026-06-16days on market $210,000 Active 20 DOM
-
2026-06-15days on market $210,000 Active 19 DOM
-
2026-06-14days on market $210,000 Active 17 DOM
-
2026-06-13days on market $210,000 Active 16 DOM
-
2026-06-10days on market $210,000 Active 14 DOM
-
2026-06-09days on market $210,000 Active 13 DOM
-
2026-06-08days on market $210,000 Active 12 DOM
-
2026-06-07days on market $210,000 Active 11 DOM
-
2026-06-05days on market $210,000 Active 8 DOM
-
2026-06-03days on market $210,000 Active 7 DOM
-
2026-06-02days on market $210,000 Active 6 DOM
-
2026-06-01days on market $210,000 Active 5 DOM
-
2026-05-31days on market $210,000 Active 4 DOM
-
2026-05-30days on market $210,000 Active 3 DOM
-
2026-05-19$210,000 Active 347-char remark
Show marketing remark (347 chars)
Charming 3BR, 2BA home with an attached garage. The interior boasts a soaring vaulted ceiling in the great room, an eat-in kitchen with a designated dining area, and a private, isolated master suite. Enjoy outdoor living with a covered front porch, back deck, and a fenced in backyard. Includes underground utilities. Call today and make it yours!
-
2026-05-06price $210,000
-
2026-05-06price $210,000
-
2026-05-06price $210,000
-
2026-03-31price $214,900
-
2026-03-31price $214,900
-
2026-03-31price $214,900
-
2026-03-04price $229,900
-
2026-03-04price $229,900
-
2026-03-04price $229,900
-
2026-02-22price $232,400
-
2026-02-22price $232,400
-
2026-02-22price $232,400
-
2026-02-12$239,900 Active
-
2026-01-20$239,900 Active
-
2022-09-30soldstatus $150,000
-
2022-09-28soldstatus $150,000 Sold
-
2022-09-13status Pending
-
2022-08-29price $145,000
-
2022-08-03$165,000 Active
-
2022-04-26soldstatus $132,000
ⓘ Source: listings_history table (triggers on properties + properties_extension) + one-shot
backfill from property_details.listing_events for pre-trigger history.
Tax reassessment forecast AL · Resets to sale price
- Current annual tax
- $518 · $43/mo
- Projected year-2 tax
- $861 · $72/mo
- Expected delta
- +$343/yr (+$29/mo · 66.3%)
ⓘ Screening estimate from a state-policy table — verify with the county assessor before closing.
Climate risk First Street
- Flood 1/10 Low FEMA zone X (unshaded) · 0% chance over 30 yrs
- Wildfire 4/10 Moderate
- Heat 5/10 Major 7 d/yr ≥104°F today · 21 d/yr by 30 yrs out
- Wind 4/10 Moderate 21% chance of damaging wind over 30 yrs
- Air quality 2/10 Low 0 unhealthy d/yr today · 2 by 30 yrs out
Nearby sold comps map
Loading sold comps map…
Walkable amenities ~0.75 mi
Loading nearby amenities…
Taxation est. · year 1
- Rental income
- $17,016
- − Mortgage interest
- −$11,763
- − Property taxes
- −$518
- − Insurance
- −$1,050
- − Repairs & maintenance
- −$1,361
- − Management
- −$1,361
- − Depreciation
- −$6,109
- Taxable loss
- −$5,147
- Est. tax savings @ 24.0%
- +$1,235
- After-tax cash flow
- $-105/yr
For passive investors: Depreciation is non-cash, so a rental often shows a tax loss while cash-flowing — sheltering income. Rental losses are passive: they offset passive income freely, and up to $25,000/yr can offset ordinary (W-2) income if you actively participate and your MAGI is under $100k (phasing out to $0 by $150k); unused losses carry forward. On sale, claimed depreciation is recaptured at up to 25%, and gains may owe capital-gains tax (a 1031 exchange can defer both). Figures are a year-1 estimate at your 24.0% rate — not tax advice; consult a CPA.
Schools (NCES district)
- District
- Marshall County
- NCES district ID
- 0100006
- Math proficiency
- 14% ▼ -26.00%
- Reading proficiency
- 38% ▲ 2.00%
- Median HH income
- $40,439
- Composite
- 21.88/100
- National rank
- #8234
- State rank
- #86 of 129 in AL
Livability — Arab
- Score
- 64/100
- State rank
- #149
- US rank
- #13733
Category grades
Schools grade is shown separately in the Schools card above.
Census & demographics
- City population
- 17,435
- Population (ZIP)
- 17,435
Population outlook (Marshall County) Hauer SSP2
- Today (2025)
- 97,402 people
- By 2030
- 98,138 · +0.8%
- By 2040
- 98,502 · +1.1%
- By 2050
- 97,024 · -0.4%
- By 2075
- 89,334 · -8.3%
- By 2100
- 74,749 · -23.3%
Race, ethnicity, and origin ACS 2023
- Neighborhood character
- Predominantly White (89%)
- Race & ethnicity
- White 89% Hispanic / Latino 5% Two or more races 5% Asian 1%
- Hispanic origin (detail)
- Mexican 4%
- Common ancestry
- Slovak 2% Italian 1% Serbian 1%
- Foreign-born
- 2% · Canada, China
- Languages at home
- 97% English-only · Spanish 2%
Political lean MEDSL · Marshall
- 2024 margin
- Solid R (+71.7) · D 13.8% · R 85.5%
- 2008→2024 swing
- -15.4pp toward R · 2008: -56.4pp · 2024: -71.7pp
- All cycles
- 2024: R+71.7 2020: R+68.7 2016: R+69.5 2012: R+60.1 2008: R+56.4
Not yet ingested
- Civics
- —
Market trends
- HPI YoY
- ▼ -70.17%
- Current HPI
- 180.2225
- Rent YoY
- —
- Metro
- —
- State GDP YoY
- ▲ 2.94%
- F500 in state
- 4
Industry mix (Fortune 500 HQ in AL)
| Industry | F500 HQs | Revenue |
|---|---|---|
| Financial Services | 1 | $8B |
|
||
| Healthcare | 1 | $5B |
|
||
Price history
+59.1% since first listed23 events — show timeline
- 2026-05-27 Listed $210,000 VMLS
- 2026-05-19 Listed $210,000 SAARMLS
- 2026-05-19 Listed $210,000 Walker County Area MLS
- 2026-05-06 Price Changed $210,000 Walker County Area MLS
- 2026-05-06 Price Changed $210,000 SAARMLS
- 2026-05-06 Price Changed $210,000 VMLS
- 2026-03-31 Price Changed $214,900 Walker County Area MLS
- 2026-03-31 Price Changed $214,900 SAARMLS
- 2026-03-31 Price Changed $214,900 VMLS
- 2026-03-04 Price Changed $229,900 VMLS
- 2026-03-04 Price Changed $229,900 Walker County Area MLS
- 2026-03-04 Price Changed $229,900 SAARMLS
- 2026-02-22 Price Changed $232,400 Walker County Area MLS
- 2026-02-22 Price Changed $232,400 SAARMLS
- 2026-02-22 Price Changed $232,400 VMLS
- 2026-02-12 Listed $239,900 VMLS
- 2026-01-20 Listed $239,900 SAARMLS
- 2022-09-30 Sold (Public Records) $150,000 Public Records
- 2022-09-28 Sold (MLS) $150,000 VMLS
- 2022-09-13 Pending — VMLS
- 2022-08-29 Price Changed $145,000 VMLS
- 2022-08-03 Listed $165,000 VMLS
- 2022-04-26 Sold (Public Records) $132,000 Public Records
Property tax history
+3.7%/yrLatest (2025): $518 · -10.4% YoY. Source: county tax records.
Cash-flow waterfall
monthlySold comps — $/sqft
last 12 mo · ≤1 miLoading sold comps…