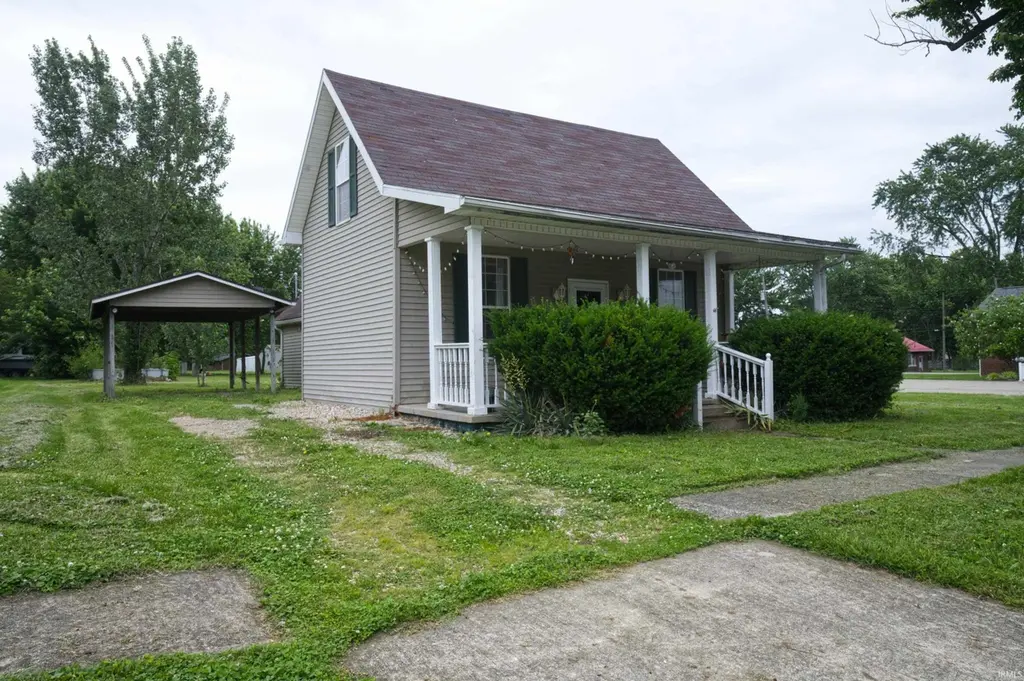
250 W Franklin St · Lyons, IN
Flood risk 1/10 · Minimal
- FEMA flood zone
- X (unshaded)
- Chance of flooding over 30 yrs
- 0.0%
- Est. flood insurance / yr
- $473 – $860
Fire risk 1/10 · Minimal
- Est. fire insurance / yr
- $717 – $1,331
Heat risk 4/10 · Minor
- Hot days now (above 105°F)
- 7 days/yr
- Hot days in 30 yrs
- 19 days/yr
Wind risk 2/10 · Minimal
- Chance of severe wind over 30 yrs
- 2.0%
Air-quality risk 4/10 · Minor
- Unhealthy air days now
- 3 days/yr
- Unhealthy air days in 30 yrs
- 5 days/yr
Risk factors via First Street. Map © Google.
Why this score? — see what drove the B grade
The composite is a weighted blend of 9 inputs, each scored 0–100. Each bar is that input's sub-score; the figure is the points it added to the 100-point composite (weight × sub-score).
- Cash flow +28.7/30.0
- DSCR +10.0/10.0
- Appreciation +8.2/10.0
- 1% rule +8.0/10.0
- ARV discount +7.5/15.0
- Livability +3.2/5.0
- Schools +3.1/10.0
- Rent growth +2.5/5.0
- Condition / age +2.2/5.0
$84,900
🖨 Deal sheet (PDF) 📄 Offer letter ✓ Due diligence
Listing remarks
Looking to own your own home? Want functionality but still want to put your own finishing touches on it? This is your chance. Conveniently located on over a 1/4 of an acre lot with city utilities. It is close to the city park, and has quick highway access. This 2 bedroom, 1 bath home has some hardwood floors, and an inviting front porch. Make your appointment today!
Key facts
- City utilities
- Inviting front porch
- Quick highway access
Tags
Property features AI
Exterior
- Parking: 2-car garage; Off-street parking; Carport
- Utilities: Public water; Public sewer
- Home design: Single-family residence; Site-built home; One story
- Construction: Vinyl siding; Shingle roof
- Exterior features: Covered porch
Interior
- Kitchen: Refrigerator
- Bedrooms: 6 total rooms (includes bedrooms and living spaces)
- Flooring: Carpet; Laminate; Vinyl
- Bathrooms: 1 full bathroom
- Heating & cooling: Central air
- Interior features: Refrigerator included; Full basement with sump pump
- Laundry & utility: Washer hookup on main level; Electric dryer hookup on main level
Neighborhood map
What this means for you Summary
Snapshot
- This is a 2-bed/1.0-bath single-family listed at $85k. Condition is rated fair.
Deal economics
- At list price, monthly cash flow is $284 ($3k/yr) — positive.
- The deal already cash-flows at list — no discount required.
- Meets the 1% rule at list price ($1k rent vs $85k).
- Recommended offer: $84k (1.5% below list) — sets the bar for market timing.
Location & tenants
- Location reads 64/100 on livability (#366 in IN) — a middle-class / working-renter tenant base. Strengths: cost of living A+, housing A+; Watch: crime C-, health & safety C-, employment D+.
- White River Valley School District (rural): math 33% / reading 39% proficiency, ranked #187 of 301 in IN (top 62%) — families likely to look elsewhere, expect single-tenant / working-renter base with shorter leases.
- Zoned schools: White River Valley Elementary Sch (math 52% / reading 42%, grade D-, #325 of 994 statewide, top 36%, 326 students, 64% FRL); White River Valley Middle School (math 29% / reading 35%, grade F, #190 of 330 statewide, top 59%, 209 students, 60% FRL); White River Valley High School (math 22% / reading 47%, grade F, #270 of 369 statewide, top 77%, 210 students, 56% FRL) — zoned schools average 60% FRL vs 42% district-wide (18 pts higher); higher-poverty schools than district average — tighter screening recommended.
- Market conditions: 5 active listings in the ZIP.
Forward outlook
- In year one you build about $6k of equity ($587 loan paydown + $5k appreciation (6.4% local appreciation)).
- Greene County population projected at -22% by 2050 — secular population decline; favor cash flow + early exit over multi-decade hold.
- At projected returns (6.4% appreciation + 3.0% rent growth), your $24k cash investment doubles in ~3 years — after that, you're playing with house money.
- By year 6, paydown + projected appreciation supports a ~$33k cash-out refi (75% LTV) — recoverable capital for the next deal without selling this one.
Negotiation context
- It's been on market 21 days — a 2% lower offer ($84k) is reasonable based on typical stale-listing flexibility.
Risks & watch-outs
- Watch-outs: built in 1895 — expect roof / HVAC / electrical / plumbing capex.
Questions for the listing agent
- Have any recent inspections been done? Can we get a copy of the seller's disclosures and any deferred-maintenance estimates?
- Built in 1895 — when were the roof, HVAC, electrical panel, plumbing, and water heater last replaced?
- Is there a deadline driving the sale (1031 exchange, divorce, estate, relocation)? That informs how much negotiation room exists.
- Schools are F-rated, which usually means shorter tenancies and higher turnover. Who's the typical renter profile here, and what's been the actual vacancy rate?
- What's the average days-on-market for RENTAL listings here right now (not sales)? A rising rental-DOM trend means longer vacancies and softer asking-rent achievability than the comps imply.
- What's the recent tenant-quality profile in this submarket — average credit score on applications, eviction rate, late-payment / NSF rate, and stable-employment percentage? A property-management company in the area should have these aggregated.
- How much new for-sale + rental construction is in the pipeline within 1–3 miles? Heavy new supply typically softens prices + rents 12–24 months out; constrained supply supports both.
Investment metrics
- 1% rule
- 1.30% ✓
- Cap rate
- 10.30%
- Cash-on-cash
- 14.33%
- DSCR
- 1.64
- GRM
- 6.4
CMA / ARV
- ARV (on-the-fly)
- $194,878
- Comps found
- 2
Show comp detail 2 sales within ~0.75 mi
| Address | Dist | Beds/Ba | Sqft | Sold | Price | $/sf | Match |
|---|---|---|---|---|---|---|---|
| 210 S Meridian St | 0.23mi | 2/1.0 | 1,261 (-10%) | 3mo | $99,900 | $79 | 70 |
| 215 N Jefferson St | 0.12mi | 3/2.0 (+1) | 1,296 (-8%) | 6mo | $179,900 | $139 | 68 |
Match score weights: distance 35% · size 25% · config 20% · recency 20%. Top-matched comps best support the ARV.
Projected returns pro-forma
6.4% appreciation · 3.0% rent growth · sell at horizon
- IRR
- 28.1%
- Equity multiple
- 2.88×
- Total profit
- $44,626
- Equity at exit
- $55,521
- IRR
- 26.0%
- Equity multiple
- 5.91×
- Total profit
- $116,657
- Equity at exit
- $102,593
Cash invested: $23,772 (down + closing). Projections, not guarantees.
Landlord ↔ Tenant lean methodology
- Overall (STATE)
- 90 Strongly Landlord-Friendly
- State Indiana
- 90 Strongly Landlord-Friendly · R+11
- County
- — inherits STATE
- City
- — inherits STATE
ZIP-level market 47443
- Home prices YoY
- 3.7%
- Active inventory
- 5
- Price-to-rent
- 6.4×
Monthly cashflow live
- Estimated rent
- $1,102 medium interval (Pro) →
- Mortgage (P&I)
- −$445
- Tax est. 1.5%
- −$106 /mo · $1,274/yr
- Insurance
- −$35
- HOA
- −$0
- Vacancy / Maint / Mgmt
- −$231
- Net cashflow
- $284
Break-even live
Sensitivity live
| Price | -10% $342 | -5% $313 | +0% $284 | +5% $254 | +10% $225 |
|---|---|---|---|---|---|
| Rent | -10% $197 | -5% $240 | +0% $284 | +5% $327 | +10% $371 |
| Rate | -1.0pp $327 | -0.5pp $305 | base $284 | +0.5pp $262 | +1.0pp $239 |
UW: 25.0% down · 7.5% · 30yr · 1.5% tax · 5.0% vac · 8.0% maint · 8.0% mgmt
Financing live
Cash to close
- Down payment
- $21,225
- Closing costs
- $2,547
- Reserves months
- —
- Total cash needed
- —
Loan-product check · same deal, 3 products live
Conventional
25% down · 7.5% · 30yr
- Down + closing
- —
- Monthly P&I
- —
- Monthly cashflow
- —
- DSCR
- —
- Eligible?
- —
Personal DTI + credit; lowest rate.
DSCR
20% down · 8.5% · 30yr
- Down + closing
- —
- Monthly P&I
- —
- Monthly cashflow
- —
- DSCR
- —
- Eligible?
- —
No personal income docs; deal must DSCR.
Hard money
10% down · 12.0% · 12mo
- Down + closing
- —
- Monthly P&I
- —
- Monthly cashflow
- —
- DSCR
- —
- Eligible?
- —
Short-term bridge; refi at stabilization.
Listing history 16 events
-
2026-06-19days on market $84,900 Active 21 DOM
-
2026-06-18days on market $84,900 Active 20 DOM
-
2026-06-17days on market $84,900 Active 19 DOM
-
2026-06-16days on market $84,900 Active 18 DOM
-
2026-06-15days on market $84,900 Active 17 DOM
-
2026-06-14days on market $84,900 Active 15 DOM
-
2026-06-12days on market $84,900 Active 14 DOM
-
2026-06-09days on market $84,900 Active 11 DOM
-
2026-06-08days on market $84,900 Active 10 DOM
-
2026-06-07days on market $84,900 Active 9 DOM
-
2026-06-05days on market $84,900 Active 6 DOM
-
2026-06-03days on market $84,900 Active 5 DOM
-
2026-06-02days on market $84,900 Active 4 DOM
-
2026-06-01days on market $84,900 Active 3 DOM
-
2026-05-31days on market $84,900 Active 2 DOM
-
2026-05-27$84,900 Active
ⓘ Source: listings_history table (triggers on properties + properties_extension) + one-shot
backfill from property_details.listing_events for pre-trigger history.
Climate risk First Street
- Flood 1/10 Low FEMA zone X (unshaded) · 0% chance over 30 yrs
- Wildfire 1/10 Low
- Heat 4/10 Moderate 7 d/yr ≥105°F today · 19 d/yr by 30 yrs out
- Wind 2/10 Low 2% chance of damaging wind over 30 yrs
- Air quality 4/10 Moderate 3 unhealthy d/yr today · 5 by 30 yrs out
Nearby sold comps map
Loading sold comps map…
Walkable amenities ~0.75 mi
Loading nearby amenities…
Taxation est. · year 1
- Rental income
- $13,224
- − Mortgage interest
- −$4,756
- − Property taxes
- −$1,274
- − Insurance
- −$424
- − Repairs & maintenance
- −$1,058
- − Management
- −$1,058
- − Depreciation
- −$2,470
- Taxable income
- $2,184
- Est. tax owed @ 24.0%
- −$524
- After-tax cash flow
- $2,882/yr
For passive investors: Depreciation is non-cash, so a rental often shows a tax loss while cash-flowing — sheltering income. Rental losses are passive: they offset passive income freely, and up to $25,000/yr can offset ordinary (W-2) income if you actively participate and your MAGI is under $100k (phasing out to $0 by $150k); unused losses carry forward. On sale, claimed depreciation is recaptured at up to 25%, and gains may owe capital-gains tax (a 1031 exchange can defer both). Figures are a year-1 estimate at your 24.0% rate — not tax advice; consult a CPA.
Condition & rehab AI · 7 photos
This 2-bedroom, 1-bath home requires moderate renovations to improve its condition and appeal to buyers and renters. Key areas for improvement include painting, updating cabinets, and replacing flooring.
Repairs flagged
- Moderate Kitchen cabinets — Worn and dated
- Moderate Bathroom cabinets — Worn and dated
- Moderate Flooring — Worn and dated
- Moderate Paint — Worn and dated
Value-add opportunities
- Both Painting and updating the kitchen and bathroom cabinets — Fresh paint and updated cabinets would enhance both resale and rental value
- Both Flooring replacement — New flooring would improve both the aesthetic and functionality of the home
- Both Painting and updating the interior walls — Fresh paint and updated wallpaper would enhance both resale and rental value
Renovation cost estimate screening
| Repair item | Severity | Est. cost |
|---|---|---|
| Kitchen cabinets · Worn and dated | Moderate | $3,000–15,000 |
| Bathroom cabinets · Worn and dated | Moderate | $3,000–15,000 |
| Flooring · Worn and dated | Moderate | $3,000–15,000 |
| Paint · Worn and dated | Moderate | $3,000–15,000 |
| Total estimated repair cost · 4 items | $12,000–60,000 |
Value-add ROI direction
- Both Painting and updating the kitchen and bathroom cabinets — Fresh paint and updated cabinets would enhance both resale and rental value ↑
- Both Flooring replacement — New flooring would improve both the aesthetic and functionality of the home ↑
- Both Painting and updating the interior walls — Fresh paint and updated wallpaper would enhance both resale and rental value ↑
ⓘ Cost ranges are severity-bucket heuristics (US national rule-of-thumb). Get contractor quotes + a written scope before underwriting a rehab budget.
Schools (NCES district)
- District
- White River Valley School District
- NCES district ID
- 1800008
- Math proficiency
- 33% ▼ -19.00%
- Reading proficiency
- 39% ▼ -15.00%
- Median HH income
- $44,074
- Composite
- 30.59/100
- National rank
- #6199
- State rank
- #187 of 301 in IN
Livability — Lyons
- Score
- 64/100
- State rank
- #366
- US rank
- #13740
Category grades
Schools grade is shown separately in the Schools card above.
Census & demographics
- Census place
- Lyons, IN
- Population (ZIP)
- 1,336
Population outlook (Greene County) Hauer SSP2
- Today (2025)
- 30,724 people
- By 2030
- 29,506 · -4.0%
- By 2040
- 26,744 · -13.0%
- By 2050
- 23,879 · -22.3%
- By 2075
- 18,341 · -40.3%
- By 2100
- 13,976 · -54.5%
Race, ethnicity, and origin ACS 2023
- Neighborhood character
- Predominantly White (85%)
- Race & ethnicity
- White 85% Hispanic / Latino 8% Two or more races 8% Asian 2%
- Hispanic origin (detail)
- Mexican 2%
- Common ancestry
- Italian 1% Romanian 1%
- Foreign-born
- 6% · Canada
- Languages at home
- 90% English-only · Spanish 7% Other Asian/Pacific 2%
Political lean MEDSL · Greene
- 2024 margin
- Solid R (+53.7) · D 22.4% · R 76.1% · Other 1.6%
- 2008→2024 swing
- -39.2pp toward R · 2008: -14.5pp · 2024: -53.7pp
- All cycles
- 2024: R+53.7 2020: R+52.2 2016: R+53.4 2012: R+31.4 2008: R+14.5
Not yet ingested
- Civics
- —
Market trends
- HPI YoY
- ▲ 6.40%
- Current HPI
- 179.8879
- Rent YoY
- —
- Metro
- —
- State GDP YoY
- ▲ 2.90%
- F500 in state
- 18
Industry mix (Fortune 500 HQ in IN)
| Industry | F500 HQs | Revenue |
|---|---|---|
| Industrial Machinery | 2 | $37B |
|
||
| Healthcare | 1 | $177B |
|
||
| Pharmaceuticals | 1 | $45B |
|
||
| Metals / Steel | 1 | $18B |
|
||
| Agriculture | 1 | $17B |
|
||
| Packaging | 1 | $12B |
|
||
Price history
1 event — show timeline
- 2026-05-27 Listed $84,900 IRMLS
Cash-flow waterfall
monthlySold comps — $/sqft
last 12 mo · ≤1 miLoading sold comps…