 Duplex
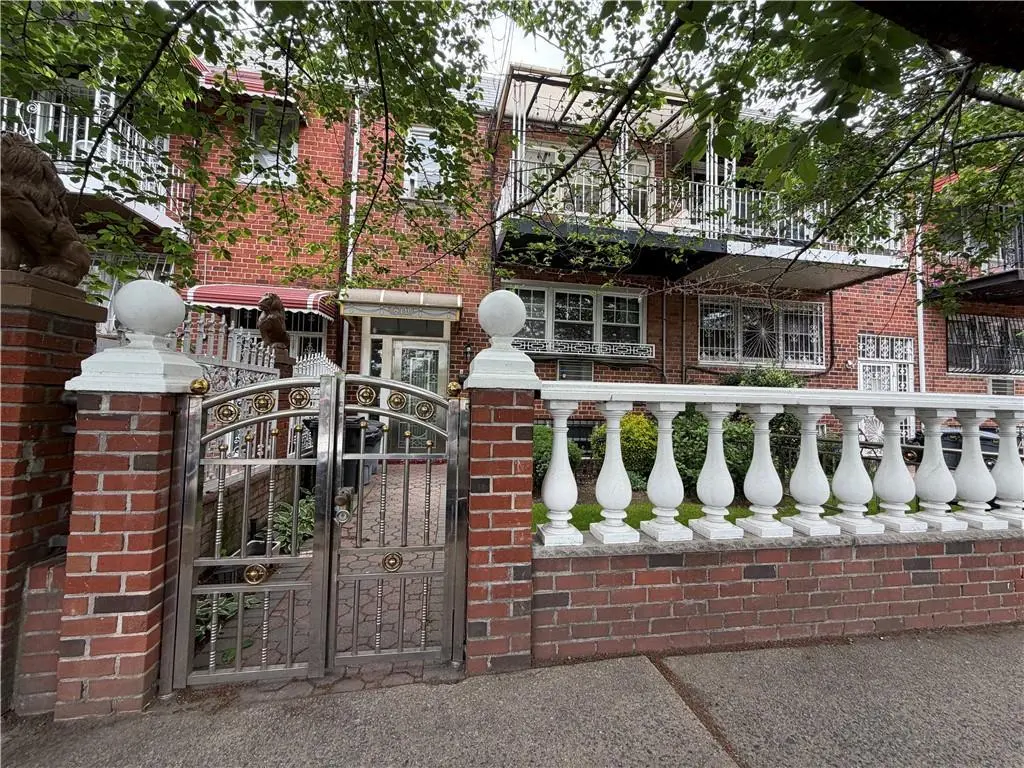
819 Hegeman Ave · New York, NY
Flood risk 8/10 · Major
- FEMA flood zone
- X (unshaded)
- Chance of flooding over 30 yrs
- 0.78%
- Est. flood insurance / yr
- $507 – $1,088
Fire risk 1/10 · Minimal
- Est. fire insurance / yr
- $691 – $1,283
Heat risk 7/10 · Major
- Hot days now (above 99°F)
- 7 days/yr
- Hot days in 30 yrs
- 15 days/yr
Wind risk 6/10 · Moderate
- Chance of severe wind over 30 yrs
- 68.0%
Air-quality risk 5/10 · Moderate
- Unhealthy air days now
- 6 days/yr
- Unhealthy air days in 30 yrs
- 8 days/yr
Risk factors via First Street. Map © Google.
Why this score? — see what drove the D grade
The composite is a weighted blend of 9 inputs, each scored 0–100. Each bar is that input's sub-score; the figure is the points it added to the 100-point composite (weight × sub-score).
- Cash flow +12.3/30.0
- ARV discount +6.5/15.0
- Schools +5.0/10.0
- Rent growth +3.8/5.0
- Livability +3.8/5.0
- DSCR +3.7/10.0
- 1% rule +2.6/10.0
- Condition / age +2.5/5.0
- Appreciation +0.0/10.0
$899,000
🖨 Deal sheet 📄 Offer letter ✓ Due diligence
Multi-family units
County records classify this as Multi-Family (2-4 Unit). Listing-text estimate: 2 units. confirmed
Listing remarks
A rare Brooklyn 2-family with space, flexibility, outdoor charm, and everyday convenience. Welcome to 819 Hegeman Avenue — a spacious 2-family home offering approximately 2,750 square feet of livable space, including a finished basement. The second-floor apartment is vacant, while the owner currently occupies the first floor, creating flexibility for an owner-user or investor. The second-floor apartment features a gorgeous front terrace shaded by a mature tree canopy — an inviting outdoor space that adds charm, privacy, and a wonderful place to relax. The finished basement offers approximately 750 square feet with 2 finished rooms and a half bath, creating bonus space for recrea
Key facts
- Near shopping
- Rear garage
- Finished basement
Tags
Property features AI
Finance
- Other: Zoning: R5
- Financial info: No financing offered
Exterior
- Parking: Private drive with 2 parking spaces
- Utilities: Electric: Other; Hot water: Other; Heating fuel: Other; Heat delivery: Other
- Home design: Attached building; Residential property; Unit described with 3 bedrooms on floor 2
- Construction: Brick exterior; Flat roof; Block foundation; Building footprint approximately 1,000 (dimensions 50.00 x 20.00)
- Exterior features: Front yard
Interior
- Kitchen: Dishwasher; Oven/Range; Refrigerator; Appliances included
- Bedrooms: Two bedrooms on the first level; Three bedrooms on the second level
- Flooring: Hardwood floors; Ceramic floors
- Bathrooms: Two full bathrooms; One half bathroom; One full bath on level 1; One full bath on level 2; One half bath on level 3
- Heating & cooling: No AC units listed
- Interior features: Dishwasher; Refrigerator; Laundry area; Patio/garden; Finished, partial, walk-in basement
- Laundry & utility: Laundry area
Neighborhood map
What this means for you Summary
Snapshot
- This is a 2 × 2-bed/1.8-bath units multifamily listed at $899k.
Deal economics
- At list price, monthly cash flow is $-227 ($-3k/yr) — negative. Per door: $-113/mo.
- To cash-flow at today's rent, offer at most $859k (4.5% below list).
- To meet the 1% rule (rent ≥ 1% of price), the offer needs to be $687k (23.5% below list).
- Recommended offer: $687k (23.5% below list) — sets the bar for 1% rule.
- Cap rate 6.1% vs local median 2.6% in New York — top-decile yield for the area; either an underpriced asset or a hidden risk that comps aren't pricing in. Stress-test before assuming the spread holds.
Location & tenants
- Location reads 75/100 on livability (#268 in NY, #4,188 nationally) — a middle-class / working-renter tenant base. Strengths: amenities A+, commute A+, health & safety A; Watch: crime F, cost of living F.
- Market conditions: Rents rising fast (+5.3%/yr); 251 active listings in the ZIP; 10,063 units permitted in Kings County in 2024 (9,789 in 5+ unit buildings).
- At $6,873/mo this rent would consume 146% of the median local household income ($57k/yr) (locally 7510% of renters already pay >50% of income on rent) — very limited rent-growth headroom before tenants either downsize or default.
Forward outlook
- Local home prices are declining (-3.0%/yr); year-one equity from $6k of loan paydown is wiped out by about $27k of value loss. Plan a longer hold.
- Kings County population projected at +13% by 2050 — modest demand growth; plan on rents tracking national, not racing it.
Negotiation context
- It's been on market 35 days — a 3% lower offer ($872k) is reasonable based on typical stale-listing flexibility.
- Current owner paid $90k; list at $899k implies a 899% gain — meaningful room to come down on a strong offer.
Risks & watch-outs
- Watch-outs: flood insurance adds $66/mo.
- Climate carrying-cost: severe flood risk; major wind risk, 68% chance of damaging wind over 30y; extreme-heat days projected 7→15/yr by 2055 (HVAC capex compounding) — expect insurance premiums to compound above CPI over the hold.
Questions for the listing agent
- What do current leases actually rent for vs. the listed asking? Can we see a recent rent roll and the last 12 months of T-12 income?
- It's been on market 35 days. Have you received any prior offers? Is the seller open to a 24% concession, seller financing, or rate buy-down credit?
- Can we see the unit-by-unit rent roll, current vacancy, and any below-market leases? What's the average tenancy length?
- What capital expenditures (roof, boiler, parking lot, exteriors) have been made in the last 5 years, and what's planned in the next 2?
- Built in 1970 — when were the roof, HVAC, electrical panel, plumbing, and water heater last replaced?
- What's the actual annual flood-insurance premium (NFIP or private), and is the property in a SFHA with mandatory coverage?
- Is there a deadline driving the sale (1031 exchange, divorce, estate, relocation)? That informs how much negotiation room exists.
- Schools are B-rated — typically a magnet for longer-tenancy family renters. What's the average tenant stay here, and is there a school-zone premium baked into asking?
- Crime grade is F in this area — have there been break-ins, vandalism, or insurance claims at this property in the last 3 years? What carrier currently insures it and at what premium?
- The area grade is low — what's the realistic commute time and amenity access for the typical tenant pool here? Any planned neighborhood developments (good or bad) we should know about?
- What's the average days-on-market for RENTAL listings here right now (not sales)? A rising rental-DOM trend means longer vacancies and softer asking-rent achievability than the comps imply.
- What's the recent tenant-quality profile in this submarket — average credit score on applications, eviction rate, late-payment / NSF rate, and stable-employment percentage? A property-management company in the area should have these aggregated.
- How much new apartment / multifamily construction is in the pipeline within 1–3 miles? Heavy new supply (>2% of stock underway) typically softens rents 12–24 months out; light construction supports rent growth.
Investment metrics
- 1% rule
- 0.76% ✗
- Cap rate
- 6.08%
- Cash-on-cash
- -0.76%
- DSCR
- 0.97
- GRM
- 10.9
CMA / ARV
- ARV (on-the-fly)
- $880,000
- Comps found
- 7
Show comp detail 7 sales within ~0.75 mi
| Address | Dist | Beds/Ba | Sqft | Sold | Price | $/sf | Match |
|---|---|---|---|---|---|---|---|
| 664 New Jersey Ave | 0.56mi | 5/3.0 (+1) | 2,700 (-2%) | 3mo | $641,000 | $237 | 61 |
| 346 Van Siclen Ave | 0.64mi | 5/3.0 (+1) | 2,700 (-2%) | 6mo | $1,090,740 | $404 | 55 |
| 504 Vermont St | 0.59mi | 5/3.0 (+1) | 3,000 (+9%) | 3mo | $810,000 | $270 | 48 |
| 471 Shepherd Ave | 0.62mi | 5/3.5 (+1) | 2,800 (+2%) | 20mo | $989,000 | $353 | 46 |
| 637 Blake Ave | 0.74mi | 5/3.0 (+1) | 2,922 (+6%) | 4mo | $935,000 | $320 | 45 |
| 551 Egan St | 0.71mi | 5/3.0 (+1) | 2,460 (-10%) | 11mo | $865,000 | $352 | 33 |
| 626 Blake Ave | 0.74mi | 5/3.0 (+1) | 3,126 (+14%) | 8mo | $925,000 | $296 | 28 |
Match score weights: distance 35% · size 25% · config 20% · recency 20%. Top-matched comps best support the ARV.
Projected returns pro-forma
-3.0% appreciation · 5.29% rent growth · sell at horizon
- IRR
- -15.8%
- Equity multiple
- 0.43×
- Total profit
- $-144,164
- Equity at exit
- $134,044
- IRR
- -4.2%
- Equity multiple
- 0.70×
- Total profit
- $-75,446
- Equity at exit
- $77,729
Cash invested: $251,720 (down + closing). Projections, not guarantees.
Landlord ↔ Tenant lean methodology
- Overall (CITY)
- 0 Strongly Tenant-Friendly
- State New York
- 15 Strongly Tenant-Friendly · D+10
- County
- — inherits STATE
- City New York
- 0 Strongly Tenant-Friendly · D+34
ZIP-level market 11207
- Home prices YoY
- -26.3%
- Rents YoY
- 5.3%
- Active inventory
- 251
- Price-to-rent
- 21.8×
Monthly cashflow live
- Estimated rent
- $6,873 medium interval (Pro) →
- Mortgage (P&I)
- −$4,714
- Tax from tax record
- −$501 /mo · $6,012/yr
- Insurance
- −$375
- Flood insurance flood zone
- −$66 /mo · $798/yr
- HOA
- −$0
- Vacancy / Maint / Mgmt
- −$1,443
- Net cashflow
- $-227
Break-even live
2-unit breakdown (identical units grouped — click to expand)
| Units | Beds | Baths | Est. rent |
|---|---|---|---|
| 2× units | 2 | 1.8 | $6,872 |
| #1 | 2 | 1.8 | $3,436 |
| #2 | 2 | 1.8 | $3,436 |
| Total (2 units) | $6,873 | ||
UW: 25.0% down · 7.5% · 30yr · 1.5% tax · 5.0% vac · 8.0% maint · 8.0% mgmt
Financing live
Cash to close
- Down payment
- $224,750
- Closing costs
- $26,970
- Reserves months
- —
- Total cash needed
- —
Loan-product check · same deal, 3 products live
Conventional
25% down · 7.5% · 30yr
- Down + closing
- —
- Monthly P&I
- —
- Monthly cashflow
- —
- DSCR
- —
- Eligible?
- —
Personal DTI + credit; lowest rate.
DSCR
20% down · 8.5% · 30yr
- Down + closing
- —
- Monthly P&I
- —
- Monthly cashflow
- —
- DSCR
- —
- Eligible?
- —
No personal income docs; deal must DSCR.
Hard money
10% down · 12.0% · 12mo
- Down + closing
- —
- Monthly P&I
- —
- Monthly cashflow
- —
- DSCR
- —
- Eligible?
- —
Short-term bridge; refi at stabilization.
Listing history 15 events
-
2026-06-18days on market $899,000 Active 35 DOM
-
2026-06-17days on market $899,000 Active 34 DOM
-
2026-06-16days on market $899,000 Active 33 DOM
-
2026-06-15days on market $899,000 Active 32 DOM
-
2026-06-13days on market $899,000 Active 30 DOM
-
2026-06-10days on market $899,000 Active 26 DOM
-
2026-06-08days on market $899,000 Active 25 DOM
-
2026-06-08days on market $899,000 Active 24 DOM
-
2026-06-04days on market $899,000 Active 21 DOM
-
2026-06-03days on market $899,000 Active 20 DOM
-
2026-06-02days on market $899,000 Active 19 DOM
-
2026-06-01days on market $899,000 Active 18 DOM
-
2026-05-31days on market $899,000 Active 17 DOM
-
2026-05-14$899,000 Active
-
1987-12-24soldstatus $90,000
ⓘ Source: listings_history table (triggers on properties + properties_extension) + one-shot
backfill from property_details.listing_events for pre-trigger history.
Tax reassessment forecast NY · Partial reset (capped growth)
- Current annual tax
- $6,012 · $501/mo
- Projected year-2 tax
- $10,603 · $884/mo
- Expected delta
- +$4,591/yr (+$383/mo · 76.4%)
ⓘ Screening estimate from a state-policy table — verify with the county assessor before closing.
Climate risk First Street
- Flood 8/10 Severe FEMA zone X (unshaded) · 78% chance over 30 yrs
- Wildfire 1/10 Low
- Heat 7/10 Severe 7 d/yr ≥99°F today · 15 d/yr by 30 yrs out
- Wind 6/10 Major 68% chance of damaging wind over 30 yrs
- Air quality 5/10 Major 6 unhealthy d/yr today · 8 by 30 yrs out
Nearby sold comps map
Loading sold comps map…
Walkable amenities ~0.75 mi
Loading nearby amenities…
Taxation est. · year 1
- Rental income
- $82,476
- − Mortgage interest
- −$50,358
- − Property taxes
- −$6,012
- − Insurance
- −$5,292
- − Repairs & maintenance
- −$6,598
- − Management
- −$6,598
- − Depreciation
- −$26,153
- Taxable loss
- −$18,535
- Est. tax savings @ 24.0%
- +$4,448
- After-tax cash flow
- $1,727/yr
For passive investors: Depreciation is non-cash, so a rental often shows a tax loss while cash-flowing — sheltering income. Rental losses are passive: they offset passive income freely, and up to $25,000/yr can offset ordinary (W-2) income if you actively participate and your MAGI is under $100k (phasing out to $0 by $150k); unused losses carry forward. On sale, claimed depreciation is recaptured at up to 25%, and gains may owe capital-gains tax (a 1031 exchange can defer both). Figures are a year-1 estimate at your 24.0% rate — not tax advice; consult a CPA.
Schools (NCES district)
No district data.
Livability — New York
- Score
- 75/100
- State rank
- #268
- US rank
- #4188
Category grades
Schools grade is shown separately in the Schools card above.
Census & demographics
- Census place
- New York, NY
- County
- Kings County · 2,614,986 people
- City population
- 7,731,280
- Metro
- New York-Newark-Jersey City, NY-NJ-PA
- Population (ZIP)
- 93,198
- Household income
- $56,523
- Rent vs Own
- Severe rent burden
- 7510.0
Population outlook (Kings County) Hauer SSP2
- Today (2025)
- 2,847,441 people
- By 2030
- 2,937,006 · +3.1%
- By 2040
- 3,095,491 · +8.7%
- By 2050
- 3,228,968 · +13.4%
- By 2075
- 3,321,723 · +16.7%
- By 2100
- 3,111,387 · +9.3%
Race, ethnicity, and origin ACS 2023
- Neighborhood character
- Diverse neighborhood (Simpson 0.59)
- Race & ethnicity
- Black 54% Hispanic / Latino 33% Two or more races 10% White 5% Asian 2%
- Hispanic origin (detail)
- Mexican 3% Puerto Rican 11% Dominican 11%
- Common ancestry
- Hispanic 1% Swiss 1%
- Foreign-born
- 31% · Canada, Mexico, Jamaica
- Languages at home
- 67% English-only · Spanish 27% French/Haitian/Cajun 2% Other Indo-European 1%
Political lean MEDSL · Kings
- 2024 margin
- Solid D (+44.0) · D 72.0% · R 28.0%
- 2008→2024 swing
- -15.5pp toward R · 2008: 59.4pp · 2024: 44.0pp
- All cycles
- 2024: D+44.0 2020: D+54.8 2016: D+61.8 2012: D+63.9 2008: D+59.4
Not yet ingested
- Civics
- —
Market trends
- HPI YoY
- ▼ -138.76%
- Current HPI
- 388.434
- Rent YoY
- ▲ 5.29%
- Metro
- New York-Newark-Jersey City, NY-NJ-PA
- State GDP YoY
- ▲ 2.60%
- F500 in state
- 92
Industry mix (Fortune 500 HQ in NY)
| Industry | F500 HQs | Revenue |
|---|---|---|
| Financial Services | 10 | $950B |
|
||
| Consumer Goods | 9 | $162B |
|
||
| Insurance | 4 | $225B |
|
||
| Telecommunications | 2 | $144B |
|
||
| Pharmaceuticals | 2 | $112B |
|
||
| Media / Entertainment | 2 | $69B |
|
||
Price history
+898.9% since first listed2 events — show timeline
- 2026-05-14 Listed $899,000 BNYMLS
- 1987-12-24 Sold (Public Records) $90,000 Public Records
Property tax history
+5.1%/yrLatest (2025): $6,012 · -2.4% YoY. Source: county tax records.
Cash-flow waterfall
monthlySold comps — $/sqft
last 12 mo · ≤1 miLoading sold comps…