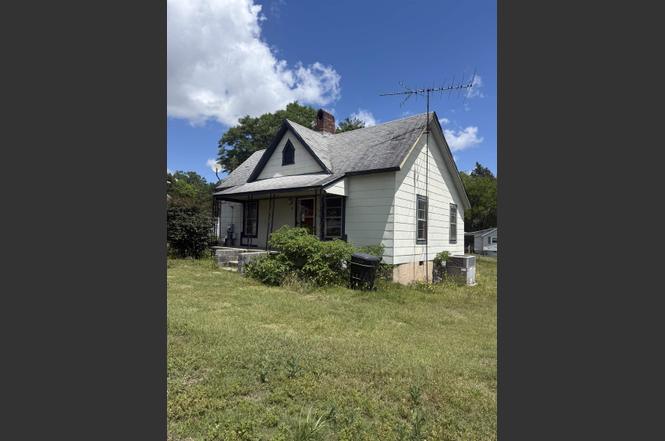
8 Ansel St · Drayton, SC
Flood risk 1/10 · Minimal
- FEMA flood zone
- X (unshaded)
- Chance of flooding over 30 yrs
- 0.0%
- Est. flood insurance / yr
- $507 – $1,088
Fire risk 2/10 · Minimal
- Est. fire insurance / yr
- $783 – $1,453
Heat risk 6/10 · Moderate
- Hot days now (above 105°F)
- 7 days/yr
- Hot days in 30 yrs
- 16 days/yr
Wind risk 2/10 · Minimal
- Chance of severe wind over 30 yrs
- 2.0%
Air-quality risk 4/10 · Minor
- Unhealthy air days now
- 3 days/yr
- Unhealthy air days in 30 yrs
- 4 days/yr
Risk factors via First Street. Map © Google.
Why this score? — see what drove the B grade
The composite is a weighted blend of 9 inputs, each scored 0–100. Each bar is that input's sub-score; the figure is the points it added to the 100-point composite (weight × sub-score).
- Cash flow +30.0/30.0
- 1% rule +10.0/10.0
- DSCR +10.0/10.0
- ARV discount +7.5/15.0
- Appreciation +4.5/10.0
- Schools +3.1/10.0
- Rent growth +2.5/5.0
- Livability +2.5/5.0
- Condition / age +2.5/5.0
$59,900
🖨 Deal sheet 📄 Offer letter ✓ Due diligence
Listing remarks
Investor opportunity in the heart of Spartanburg’s rapidly growing mill district! Situated on a corner lot just steps from Drayton Mills, this charming 2-bedroom, 1-bath bungalow offers incredible potential as a rental property, renovation project, or addition to your investment portfolio. The home features classic bungalow character, a functional floor plan, and a highly desirable location surrounded by ongoing redevelopment, local dining, shopping, and entertainment. With convenient access to Downtown Spartanburg, major employers, and popular community destinations, this property is perfectly positioned to capitalize on the area's continued growth. Whether you're looking for your ne
Key facts
- Incredible potential
- Corner lot
- 0.32 acre lot
Tags
Property features AI
Finance
- Financial info: Annual property tax listed
Exterior
- Home design: Single-family residence; One story
- Exterior features: Corner, level lot
Interior
- Bedrooms: 2 bedrooms on the main level
- Bathrooms: 1 full bathroom on the main level
- Interior features: One-level living
Neighborhood map
What this means for you Summary
Snapshot
- This is a 2-bed/1.0-bath single-family listed at $60k.
Deal economics
- At list price, monthly cash flow is $587 ($7k/yr) — positive.
- The deal already cash-flows at list — no discount required.
- Meets the 1% rule at list price ($1k rent vs $60k).
- Cap rate 18.1% vs local median 3.3% in Drayton — top-decile yield for the area; either an underpriced asset or a hidden risk that comps aren't pricing in. Stress-test before assuming the spread holds.
Location & tenants
- Location reads: area grade B — affects rentability + tenant quality, not the cash-flow math above.
- Spartanburg 07 (urban): math 34% / reading 41% proficiency, ranked #39 of 80 in SC (top 49%) — families likely to look elsewhere, expect single-tenant / working-renter base with shorter leases; 62% free/reduced lunch — lower-income household profile, screen leases tightly.
- Zoned schools: Drayton Mills Elementary (math 20% / reading 22%, grade F, #488 of 597 statewide, top 82%, 751 students, 100% FRL); Mccracken Middle (math 41% / reading 49%, grade D, #48 of 229 statewide, top 22%, 926 students, 78% FRL); Spartanburg High (math 67% / reading 79%, grade B+, #44 of 196 statewide, top 23%, 2,056 students, 85% FRL) — zoned schools average 88% FRL vs 62% district-wide (26 pts higher); higher-poverty schools than district average — tighter screening recommended.
- Market conditions: 6 active listings in the ZIP; 14 comparable units currently listed for rent nearby; rentals leasing fast (median 14d on market — plan ~1-2 weeks tenant-placement turnaround); 3,129 units permitted in Spartanburg County in 2024 (40 in 5+ unit buildings).
Forward outlook
- Local home prices are declining (-0.9%/yr); year-one equity from $414 of loan paydown is wiped out by about $557 of value loss. Plan a longer hold.
- Spartanburg County population projected at +18% by 2050 — long-run rental-demand tailwind backs the buy-and-hold thesis.
- At projected returns (-0.9% appreciation + 3.0% rent growth), your $17k cash investment doubles in ~3 years — after that, you're playing with house money.
Negotiation context
- Only 1 days on market — expect competitive offers; lowballing is unlikely to land.
Risks & watch-outs
- Watch-outs: built in 1935 — expect roof / HVAC / electrical / plumbing capex.
- Climate carrying-cost: extreme-heat days projected 7→16/yr by 2055 (HVAC capex compounding) — expect insurance premiums to compound above CPI over the hold.
Questions for the listing agent
- Built in 1935 — when were the roof, HVAC, electrical panel, plumbing, and water heater last replaced?
- Is there a deadline driving the sale (1031 exchange, divorce, estate, relocation)? That informs how much negotiation room exists.
- What's the average days-on-market for RENTAL listings here right now (not sales)? A rising rental-DOM trend means longer vacancies and softer asking-rent achievability than the comps imply.
- What's the recent tenant-quality profile in this submarket — average credit score on applications, eviction rate, late-payment / NSF rate, and stable-employment percentage? A property-management company in the area should have these aggregated.
- How much new for-sale + rental construction is in the pipeline within 1–3 miles? Heavy new supply typically softens prices + rents 12–24 months out; constrained supply supports both.
Investment metrics
- 1% rule
- 2.16% ✓
- Cap rate
- 18.06%
- Cash-on-cash
- 42.03%
- DSCR
- 2.87
- GRM
- 3.9
CMA / ARV
- ARV (on-the-fly)
- $170,140
- Comps found
- 12
Show comp detail 12 sales within ~0.75 mi
| Address | Dist | Beds/Ba | Sqft | Sold | Price | $/sf | Match |
|---|---|---|---|---|---|---|---|
| 143 Skyuka St | 0.09mi | 2/1.0 | 940 (0%) | 2mo | $170,000 | $181 | 94 |
| 1232 Spring St | 0.11mi | 2/1.0 | 940 (0%) | 11mo | $185,000 | $197 | 86 |
| 142 Skyuka St | 0.10mi | 2/2.0 | 875 (-7%) | 9mo | $185,000 | $211 | 72 |
| 469 Barnwell Rd | 0.48mi | 2/1.0 | 1,026 (+9%) | 2mo | $165,000 | $161 | 61 |
| 791 Southern St | 0.70mi | 2/1.0 | 975 (+4%) | 1mo | $189,999 | $195 | 60 |
| 437 Sloan St | 0.74mi | 2/1.0 | 932 (-1%) | 6mo | $115,000 | $123 | 58 |
| 410 Gentry St St | 0.68mi | 2/2.0 | 932 (-1%) | 14mo | $115,000 | $123 | 51 |
| 426 Gentry St | 0.68mi | 2/1.5 | 1,006 (+7%) | 4mo | $189,900 | $189 | 51 |
| 446 Gentry St | 0.69mi | 2/1.0 | 1,012 (+8%) | 12mo | $175,000 | $173 | 45 |
| 513 Beverly Rd | 0.56mi | 3/1.5 (+1) | 840 (-11%) | 5mo | $80,000 | $95 | 45 |
| 119 Phifer Dr | 0.60mi | 2/1.0 | 842 (-10%) | 13mo | $160,000 | $190 | 44 |
| 121 Phifer Dr | 0.60mi | 2/1.0 | 803 (-15%) | 8mo | $140,000 | $174 | 42 |
Match score weights: distance 35% · size 25% · config 20% · recency 20%. Top-matched comps best support the ARV.
Projected returns pro-forma
-0.93% appreciation · 3.0% rent growth · sell at horizon
- IRR
- 41.8%
- Equity multiple
- 2.97×
- Total profit
- $33,123
- Equity at exit
- $14,660
- IRR
- 45.8%
- Equity multiple
- 5.90×
- Total profit
- $82,223
- Equity at exit
- $15,566
Cash invested: $16,772 (down + closing). Projections, not guarantees.
Landlord ↔ Tenant lean methodology
- Overall (STATE)
- 90 Strongly Landlord-Friendly
- State South Carolina
- 90 Strongly Landlord-Friendly · R+6
- County
- — inherits STATE
- City
- — inherits STATE
ZIP-level market 29333
- Home prices YoY
- -0.3%
- Active inventory
- 6
- Price-to-rent
- 3.9×
Monthly cashflow live
- Estimated rent
- $1,294 high interval (Pro) →
- Mortgage (P&I)
- −$314
- Tax from tax record
- −$96 /mo · $1,152/yr
- Insurance
- −$25
- HOA
- −$0
- Vacancy / Maint / Mgmt
- −$272
- Net cashflow
- $587
Break-even live
UW: 25.0% down · 7.5% · 30yr · 1.5% tax · 5.0% vac · 8.0% maint · 8.0% mgmt
Financing live
Cash to close
- Down payment
- $14,975
- Closing costs
- $1,797
- Reserves months
- —
- Total cash needed
- —
Loan-product check · same deal, 3 products live
Conventional
25% down · 7.5% · 30yr
- Down + closing
- —
- Monthly P&I
- —
- Monthly cashflow
- —
- DSCR
- —
- Eligible?
- —
Personal DTI + credit; lowest rate.
DSCR
20% down · 8.5% · 30yr
- Down + closing
- —
- Monthly P&I
- —
- Monthly cashflow
- —
- DSCR
- —
- Eligible?
- —
No personal income docs; deal must DSCR.
Hard money
10% down · 12.0% · 12mo
- Down + closing
- —
- Monthly P&I
- —
- Monthly cashflow
- —
- DSCR
- —
- Eligible?
- —
Short-term bridge; refi at stabilization.
Rent comps 14 comps
| Address | Beds | Baths | Sqft | Rent | $/sqft | DOM | Units | Dist |
|---|---|---|---|---|---|---|---|---|
| 103 Drayton Crossing Dr Drayton, SC | 1.0–2.0 | 1.0–2.0 | 1054 | $1,728 | $1.64 | 13d | 21 | 0.30mi |
| 3900 Taggart Dr Spartanburg, SC | 1.0–3.0 | 1.0–2.0 | 854 | $1,148 | $1.34 | 21d | 3 | 0.30mi |
| 225 Milliken St Spartanburg, SC | 1.0–3.0 | 1.0–2.0 | 1020 | $1,729 | $1.70 | 13d | 20 | 0.39mi |
| 320 Spruce St Spartanburg, SC | 1.0–3.0 | 1.0–1.5 | 830 | $962 | $1.16 | 21d | 1 | 0.58mi |
| 200 Heywood Ave Spartanburg, SC | 1.0–2.0 | 1.0–2.0 | 829 | $1,425 | $1.72 | 13d | 14 | 0.68mi |
| 119 Bonner Rd Spartanburg, SC | 2.0 | 1.0 | 900 | $845 | $0.94 | 21d | 1 | 0.68mi |
| 1000 E Main St Spartanburg, SC | 2.0 | 1.5 | 938 | $950 | $1.01 | 13d | 2 | 0.82mi |
| 692 Southern St Spartanburg, SC | 2.0 | 1.0 | 1000 | $1,100 | $1.10 | 13d | 1 | 0.86mi |
| 135 Oakwood Ave Spartanburg, SC | 1.0–2.0 | 1.0–1.5 | 850 | $995 | $1.17 | 21d | 2 | 1.08mi |
| 121 Garner Rd Spartanburg, SC | 1.0–2.0 | 1.0–2.0 | 940 | $1,465 | $1.56 | 21d | 32 | 1.14mi |
| 152 Avant St Unit A Spartanburg, SC | 2.0 | 1.0 | 850 | $1,250 | $1.47 | 13d | 1 | 1.14mi |
| 152 Avant St Unit B Spartanburg, SC | 1.0 | 1.0 | 750 | $1,450 | $1.93 | 21d | 1 | 1.14mi |
| 701 E Main St Spartanburg, SC | 1.0 | 1.0 | 525 | $960 | $1.83 | 13d | 2 | 1.19mi |
| 2096 E Main St Spartanburg, SC | 1.0–3.0 | 1.0–1.5 | 859 | $1,137 | $1.32 | 13d | 25 | 1.46mi |
Listing history 2 events
-
2026-06-17remarks 693-char remark
-
2026-06-17$59,900 Active 1 DOM
ⓘ Source: listings_history table (triggers on properties + properties_extension) + one-shot
backfill from property_details.listing_events for pre-trigger history.
Tax reassessment forecast SC · Resets to sale price
- Current annual tax
- $1,152 · $96/mo
- Projected year-2 tax
- $1,152 · $96/mo
- Expected delta
- $0/yr ($0/mo · 0.0%)
ⓘ Screening estimate from a state-policy table — verify with the county assessor before closing.
Climate risk First Street
- Flood 1/10 Low FEMA zone X (unshaded) · 0% chance over 30 yrs
- Wildfire 2/10 Low
- Heat 6/10 Major 7 d/yr ≥105°F today · 16 d/yr by 30 yrs out
- Wind 2/10 Low 2% chance of damaging wind over 30 yrs
- Air quality 4/10 Moderate 3 unhealthy d/yr today · 4 by 30 yrs out
Nearby sold comps map
Loading sold comps map…
Walkable amenities ~0.75 mi
Loading nearby amenities…
Taxation est. · year 1
- Rental income
- $15,531
- − Mortgage interest
- −$3,355
- − Property taxes
- −$1,152
- − Insurance
- −$300
- − Repairs & maintenance
- −$1,242
- − Management
- −$1,242
- − Depreciation
- −$1,743
- Taxable income
- $6,497
- Est. tax owed @ 24.0%
- −$1,559
- After-tax cash flow
- $5,489/yr
For passive investors: Depreciation is non-cash, so a rental often shows a tax loss while cash-flowing — sheltering income. Rental losses are passive: they offset passive income freely, and up to $25,000/yr can offset ordinary (W-2) income if you actively participate and your MAGI is under $100k (phasing out to $0 by $150k); unused losses carry forward. On sale, claimed depreciation is recaptured at up to 25%, and gains may owe capital-gains tax (a 1031 exchange can defer both). Figures are a year-1 estimate at your 24.0% rate — not tax advice; consult a CPA.
Schools (NCES district)
- District
- Spartanburg 07
- NCES district ID
- 4503660
- Math proficiency
- 34% ▼ -1.00%
- Reading proficiency
- 41% ▼ -1.00%
- Median HH income
- $35,825
- Composite
- 31.04/100
- National rank
- #6087
- State rank
- #39 of 80 in SC
Livability — Drayton
No livability data for this city. (Only ~50 U.S. cities are tracked.)
Census & demographics
- Census place
- Drayton, SC
- City population
- 227
- Population (ZIP)
- 227
Population outlook (Spartanburg County) Hauer SSP2
- Today (2025)
- 325,495 people
- By 2030
- 338,800 · +4.1%
- By 2040
- 363,471 · +11.7%
- By 2050
- 384,156 · +18.0%
- By 2075
- 430,137 · +32.1%
- By 2100
- 442,733 · +36.0%
Race, ethnicity, and origin ACS 2023
- Neighborhood character
- Predominantly White (75%)
- Race & ethnicity
- White 75% Black 25%
Political lean MEDSL · Spartanburg
- 2024 margin
- Solid R (+33.6) · D 32.6% · R 66.2% · Other 1.2%
- 2008→2024 swing
- -12.0pp toward R · 2008: -21.6pp · 2024: -33.6pp
- All cycles
- 2024: R+33.6 2020: R+27.3 2016: R+30.0 2012: R+23.1 2008: R+21.6
Not yet ingested
- Civics
- —
Market trends
- HPI YoY
- ▼ -0.93%
- Current HPI
- 278.0086
- Rent YoY
- —
- Metro
- —
- State GDP YoY
- ▲ 4.51%
- F500 in state
- 2
Industry mix (Fortune 500 HQ in SC)
| Industry | F500 HQs | Revenue |
|---|---|---|
| Packaging | 1 | $7B |
|
||
Price history
1 event — show timeline
- 2026-06-17 Listed $59,900 SPMLS
Property tax history
+4.5%/yrLatest (2025): $1,152 · +24.5% YoY. Source: county tax records.
Cash-flow waterfall
monthlySold comps — $/sqft
last 12 mo · ≤1 miLoading sold comps…