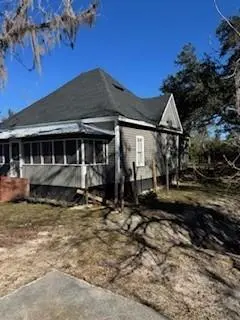
701/703 Johnson Ave · Valdosta, GA
Flood risk No data
- FEMA flood zone
- —
- Chance of flooding over 30 yrs
- —
- Est. flood insurance / yr
- —
Fire risk No data
- Est. fire insurance / yr
- —
Heat risk No data
- Hot days now (above threshold)
- —
- Hot days in 30 yrs
- —
Wind risk No data
- Chance of severe wind over 30 yrs
- —
Air-quality risk No data
- Unhealthy air days now
- —
- Unhealthy air days in 30 yrs
- —
Risk factors via First Street. Map © Google.
Why this score? — see what drove the C- grade
The composite is a weighted blend of 9 inputs, each scored 0–100. Each bar is that input's sub-score; the figure is the points it added to the 100-point composite (weight × sub-score).
- Cash flow +17.7/30.0
- ARV discount +15.0/15.0
- DSCR +5.5/10.0
- 1% rule +4.8/10.0
- Condition / age +4.0/5.0
- Rent growth +3.5/5.0
- Livability +3.0/5.0
- Schools +1.5/10.0
- Appreciation +0.0/10.0
$179,000
🖨 Deal sheet 📄 Offer letter ✓ Due diligence
Key facts
- 0.29 acre lot
- Listed 42 days
Property features AI
Finance
- Other: Located off West Gordon Street on Johnson Street (directions available)
- HOA & community: Homeowners association with monthly fee
Exterior
- Utilities: Public water; Public sewer
- Home design: Single-family residence (house); One-story
- Construction: Frame construction
- Exterior features: R6 zoning
Interior
- Kitchen: Dishwasher; Refrigerator
- Bathrooms: 2 full bathrooms
- Interior features: Dishwasher; Refrigerator
Neighborhood map
What this means for you Summary
Snapshot
- This is a 4-bed/2.0-bath single-family listed at $179k. Condition is rated good.
Deal economics
- At list price, monthly cash flow is $143 ($2k/yr) — positive.
- The deal already cash-flows at list — no discount required.
- To meet the 1% rule (rent ≥ 1% of price), the offer needs to be $175k (2.4% below list).
- Recommended offer: $174k (3.0% below list) — sets the bar for market timing.
- Cap rate 7.3% vs local median 4.3% in Valdosta — top-decile yield for the area; either an underpriced asset or a hidden risk that comps aren't pricing in. Stress-test before assuming the spread holds.
Location & tenants
- Location reads 60/100 on livability (#392 in GA) — a middle-class / working-renter tenant base. Strengths: cost of living A+, health & safety A+, housing A-; Watch: schools F, crime F, amenities F.
- Valdosta City (urban): math 15% / reading 22% proficiency, ranked #149 of 174 in GA (top 86%) — low school quality limits family demand, transient renter base, plan for 1-2y turnover; 74% free/reduced lunch — lower-income household profile, screen leases tightly.
- Market conditions: Rents rising fast (+4.2%/yr); 267 active listings in the ZIP; 18 comparable units currently listed for rent nearby; rentals at typical pace (median 21d on market — plan ~3-4 weeks tenant-placement turnaround); 44% of comp listings sitting > 30 days — soft ceiling on asking rent; 896 units permitted in Lowndes County in 2024 (0 in 5+ unit buildings).
- This rent runs 37% of the median local income ($57k/yr) — at the standard rent-burdened threshold; future hikes will face affordability resistance.
Forward outlook
- Local home prices are declining (-3.0%/yr); year-one equity from $1k of loan paydown is wiped out by about $5k of value loss. Plan a longer hold.
- Lowndes County population projected at +10% by 2050 — modest demand growth; plan on rents tracking national, not racing it.
Negotiation context
- It's been on market 43 days — a 3% lower offer ($174k) is reasonable based on typical stale-listing flexibility.
Questions for the listing agent
- It's been on market 43 days. Have you received any prior offers? Is the seller open to a 3% concession, seller financing, or rate buy-down credit?
- Is there a deadline driving the sale (1031 exchange, divorce, estate, relocation)? That informs how much negotiation room exists.
- Schools are F-rated, which usually means shorter tenancies and higher turnover. Who's the typical renter profile here, and what's been the actual vacancy rate?
- Crime grade is F in this area — have there been break-ins, vandalism, or insurance claims at this property in the last 3 years? What carrier currently insures it and at what premium?
- What's the average days-on-market for RENTAL listings here right now (not sales)? A rising rental-DOM trend means longer vacancies and softer asking-rent achievability than the comps imply.
- What's the recent tenant-quality profile in this submarket — average credit score on applications, eviction rate, late-payment / NSF rate, and stable-employment percentage? A property-management company in the area should have these aggregated.
- How much new for-sale + rental construction is in the pipeline within 1–3 miles? Heavy new supply typically softens prices + rents 12–24 months out; constrained supply supports both.
Investment metrics
- 1% rule
- 0.98% ✗
- Cap rate
- 7.25%
- Cash-on-cash
- 3.43%
- DSCR
- 1.15
- GRM
- 8.5
CMA / ARV
- ARV (median comp)
- $226,232
- List price
- $179,000
- Delta
- -20.88%
- Verdict
- UNDERPRICED
- Comps
- 20 within 1.0 mi
Show comp detail 12 sales within ~0.75 mi
| Address | Dist | Beds/Ba | Sqft | Sold | Price | $/sf | Match |
|---|---|---|---|---|---|---|---|
| 3405 Sussex Dr | 0.55mi | 3/2.0 (-1) | 1,576 (-2%) | 1mo | $249,000 | $158 | 66 |
| 3261 Oak Garden Dr | 0.43mi | 3/2.0 (-1) | 1,519 (-5%) | 1mo | $223,500 | $147 | 65 |
| 325 Jennifer Cir | 0.39mi | 3/2.0 (-1) | 1,558 (-3%) | 10mo | $205,000 | $132 | 63 |
| 3249 Oak Garden Dr | 0.44mi | 3/2.0 (-1) | 1,573 (-2%) | 10mo | $190,000 | $121 | 62 |
| 330 Jennifer Cir | 0.41mi | 3/2.5 (-1) | 1,686 (+5%) | 6mo | $225,000 | $133 | 60 |
| 3408 Drayton Cir | 0.32mi | 3/2.0 (-1) | 1,836 (+14%) | 1mo | $290,000 | $158 | 55 |
| 2908 Fawnwood Cir | 0.73mi | 3/2.0 (-1) | 1,574 (-2%) | 4mo | $188,040 | $119 | 54 |
| 604 Justin Dr | 0.63mi | 3/2.0 (-1) | 1,643 (+2%) | 9mo | $232,000 | $141 | 54 |
| 2919 Thea Ln | 0.42mi | 3/2.0 (-1) | 1,764 (+10%) | 8mo | $242,900 | $138 | 52 |
| 2801 Walmar Pl | 0.70mi | 3/2.0 (-1) | 1,691 (+5%) | 7mo | $137,500 | $81 | 47 |
| 3118 Wingfield Way | 0.54mi | 3/2.0 (-1) | 1,443 (-10%) | 11mo | $214,000 | $148 | 43 |
| 3604 Bellhaven Dr | 0.65mi | 3/2.0 (-1) | 1,804 (+12%) | 4mo | $245,000 | $136 | 41 |
Match score weights: distance 35% · size 25% · config 20% · recency 20%. Top-matched comps best support the ARV.
Projected returns pro-forma
-3.0% appreciation · 4.19% rent growth · sell at horizon
- IRR
- -9.6%
- Equity multiple
- 0.65×
- Total profit
- $-17,742
- Equity at exit
- $26,689
- IRR
- 1.4%
- Equity multiple
- 1.11×
- Total profit
- $5,301
- Equity at exit
- $15,477
Cash invested: $50,120 (down + closing). Projections, not guarantees.
Landlord ↔ Tenant lean methodology
- Overall (STATE)
- 90 Strongly Landlord-Friendly
- State Georgia
- 90 Strongly Landlord-Friendly · R+3
- County
- — inherits STATE
- City
- — inherits STATE
ZIP-level market 31602
- Rents YoY
- 4.2%
- Active inventory
- 267
- Price-to-rent
- 8.5×
Monthly cashflow live
- Estimated rent
- $1,747 high interval (Pro) →
- Mortgage (P&I)
- −$939
- Tax est. 1.5%
- −$224 /mo · $2,685/yr
- Insurance
- −$75
- HOA
- −$0
- Vacancy / Maint / Mgmt
- −$367
- Net cashflow
- $143
Break-even live
UW: 25.0% down · 7.5% · 30yr · 1.5% tax · 5.0% vac · 8.0% maint · 8.0% mgmt
Financing live
Cash to close
- Down payment
- $44,750
- Closing costs
- $5,370
- Reserves months
- —
- Total cash needed
- —
Loan-product check · same deal, 3 products live
Conventional
25% down · 7.5% · 30yr
- Down + closing
- —
- Monthly P&I
- —
- Monthly cashflow
- —
- DSCR
- —
- Eligible?
- —
Personal DTI + credit; lowest rate.
DSCR
20% down · 8.5% · 30yr
- Down + closing
- —
- Monthly P&I
- —
- Monthly cashflow
- —
- DSCR
- —
- Eligible?
- —
No personal income docs; deal must DSCR.
Hard money
10% down · 12.0% · 12mo
- Down + closing
- —
- Monthly P&I
- —
- Monthly cashflow
- —
- DSCR
- —
- Eligible?
- —
Short-term bridge; refi at stabilization.
Rent comps 18 comps
| Address | Beds | Baths | Sqft | Rent | $/sqft | DOM | Units | Dist |
|---|---|---|---|---|---|---|---|---|
| 3261 Jordan Way Valdosta, GA | 3.0 | 2.0 | 1985 | $2,100 | $1.06 | 43d | 1 | 0.21mi |
| 302 Hartsfield Ln Valdosta, GA | 3.0 | 2.0 | 1975 | $1,775 | $0.90 | 43d | 1 | 0.44mi |
| 407 Northfield Rd Valdosta, GA | 3.0 | 2.0 | 1505 | $1,395 | $0.93 | 21d | 1 | 0.44mi |
| 360 Brookfield Rd Valdosta, GA | 3.0 | 2.5 | 1278 | $1,100 | $0.86 | 43d | 1 | 0.58mi |
| 100 Garden Dr Valdosta, GA | 1.0–3.0 | 1.0–3.0 | 885 | $2,075 | $2.34 | 21d | 13 | 0.60mi |
| 312 Eager Rd Valdosta, GA | 3.0 | 3.0 | 1959 | $1,895 | $0.97 | 43d | 1 | 0.67mi |
| 334 Sawgrass Dr Valdosta, GA | 3.0 | 2.0 | 1150 | $1,595 | $1.39 | 21d | 1 | 0.70mi |
| 3833 N Oak Street Ext Valdosta, GA | 1.0–3.0 | 1.0–2.0 | 1022 | $1,410 | $1.38 | 21d | 31 | 0.78mi |
| 420 Connell Rd Valdosta, GA | 1.0–3.0 | 1.0–2.0 | 1051 | $1,375 | $1.31 | 21d | 8 | 0.81mi |
| 3024 Will Dr Valdosta, GA | 3.0 | 2.0 | 1200 | $1,295 | $1.08 | 43d | 1 | 0.83mi |
| 3027 Schroer Dr Valdosta, GA | 3.0 | 2.0 | 1184 | $1,295 | $1.09 | 43d | 1 | 0.84mi |
| 2878 Fawnwood Cir Valdosta, GA | 3.0 | 2.0 | 1400 | $3,000 | $2.14 | 43d | 1 | 0.87mi |
| 141 Blue Pool Dr Valdosta, GA | 3.0 | 2.0 | 1109 | $1,200 | $1.08 | 21d | 1 | 1.09mi |
| 5 Kensington Cir Valdosta, GA | 3.0 | 2.0 | 1150 | $1,495 | $1.30 | 21d | 1 | 1.15mi |
| 2515 Churchill Dr Valdosta, GA | 4.0 | 2.0 | 2140 | $1,550 | $0.72 | 43d | 1 | 1.17mi |
| 2502 Berkley Dr Valdosta, GA | 3.0 | 2.0 | 1484 | $1,650 | $1.11 | 21d | 1 | 1.21mi |
| 611 Pineview Dr Valdosta, GA | 1.0–3.0 | 1.0–2.5 | 1204 | $1,600 | $1.33 | 21d | 3 | 1.42mi |
| 4112 Oak Dr Valdosta, GA | 3.0 | 2.0 | 1349 | $1,250 | $0.93 | 21d | 1 | 1.45mi |
Listing history 19 events
-
2026-06-19days on market $179,000 Active 43 DOM
-
2026-06-18days on market $179,000 Active 42 DOM
-
2026-06-17days on market $179,000 Active 41 DOM
-
2026-06-16days on market $179,000 Active 40 DOM
-
2026-06-15days on market $179,000 Active 39 DOM
-
2026-06-14days on market $179,000 Active 37 DOM
-
2026-06-13days on market $179,000 Active 36 DOM
-
2026-06-10days on market $179,000 Active 34 DOM
-
2026-06-09days on market $179,000 Active 33 DOM
-
2026-06-08days on market $179,000 Active 32 DOM
-
2026-06-07days on market $179,000 Active 31 DOM
-
2026-06-05days on market $179,000 Active 28 DOM
-
2026-06-03days on market $179,000 Active 27 DOM
-
2026-06-02days on market $179,000 Active 26 DOM
-
2026-06-01days on market $179,000 Active 25 DOM
-
2026-05-31days on market $179,000 Active 24 DOM
-
2026-05-30days on market $179,000 Active 23 DOM
-
2026-05-18price $179,000
-
2026-05-07$189,000 Active
ⓘ Source: listings_history table (triggers on properties + properties_extension) + one-shot
backfill from property_details.listing_events for pre-trigger history.
Nearby sold comps map
Loading sold comps map…
Walkable amenities ~0.75 mi
Loading nearby amenities…
Taxation est. · year 1
- Rental income
- $20,966
- − Mortgage interest
- −$10,027
- − Property taxes
- −$2,685
- − Insurance
- −$895
- − Repairs & maintenance
- −$1,677
- − Management
- −$1,677
- − Depreciation
- −$5,207
- Taxable loss
- −$1,203
- Est. tax savings @ 24.0%
- +$289
- After-tax cash flow
- $2,007/yr
For passive investors: Depreciation is non-cash, so a rental often shows a tax loss while cash-flowing — sheltering income. Rental losses are passive: they offset passive income freely, and up to $25,000/yr can offset ordinary (W-2) income if you actively participate and your MAGI is under $100k (phasing out to $0 by $150k); unused losses carry forward. On sale, claimed depreciation is recaptured at up to 25%, and gains may owe capital-gains tax (a 1031 exchange can defer both). Figures are a year-1 estimate at your 24.0% rate — not tax advice; consult a CPA.
Condition & rehab AI · 24 photos
This property is in good condition with cosmetic updates that can significantly enhance its resale and rental value.
Value-add opportunities
- Both Painting exterior and interior walls — Fresh paint enhances curb appeal and interior aesthetics.
- Both Landscaping improvements — Enhances curb appeal and adds value to the property.
- Resale New flooring in bathrooms — Modern flooring improves the look and feel of the bathrooms.
- Resale New kitchen appliances — Upgraded appliances can attract more buyers and renters.
- Both New lighting fixtures — Modern lighting enhances the interior and adds to the property's curb appeal.
Renovation cost estimate screening
Value-add ROI direction
- Both Painting exterior and interior walls — Fresh paint enhances curb appeal and interior aesthetics. ↑
- Both Landscaping improvements — Enhances curb appeal and adds value to the property. ↑
- Resale New flooring in bathrooms — Modern flooring improves the look and feel of the bathrooms. ↑
- Resale New kitchen appliances — Upgraded appliances can attract more buyers and renters. ↑
- Both New lighting fixtures — Modern lighting enhances the interior and adds to the property's curb appeal. ↑
ⓘ Cost ranges are severity-bucket heuristics (US national rule-of-thumb). Get contractor quotes + a written scope before underwriting a rehab budget.
Schools (NCES district)
- District
- Valdosta City
- NCES district ID
- 1305310
- Math proficiency
- 15% ▼ -12.00%
- Reading proficiency
- 22% ▼ -7.00%
- Median HH income
- $30,634
- Composite
- 14.79/100
- National rank
- #9388
- State rank
- #149 of 174 in GA
Livability — Valdosta
- Score
- 60/100
- State rank
- #392
- US rank
- #19544
Category grades
Schools grade is shown separately in the Schools card above.
Census & demographics
- Census place
- Valdosta, GA
- County
- Lowndes County · 107,801 people
- City population
- 91,859
- Metro
- Valdosta, GA
- Population (ZIP)
- 35,728
- Household income
- $56,939
- Rent vs Own
- Severe rent burden
- 2034.0
Population outlook (Lowndes County) Hauer SSP2
- Today (2025)
- 120,348 people
- By 2030
- 123,469 · +2.6%
- By 2040
- 128,482 · +6.8%
- By 2050
- 131,907 · +9.6%
- By 2075
- 139,080 · +15.6%
- By 2100
- 133,649 · +11.1%
Race, ethnicity, and origin ACS 2023
- Neighborhood character
- Diverse neighborhood (Simpson 0.61)
- Race & ethnicity
- White 45% Black 42% Hispanic / Latino 7% Two or more races 5% Asian 2%
- Hispanic origin (detail)
- Mexican 3% Puerto Rican 1%
- Common ancestry
- Italian 1% Slovak 1% Lithuanian 1%
- Foreign-born
- 4% · Canada
- Languages at home
- 94% English-only · Spanish 3% Other Indo-European 1% French/Haitian/Cajun 1%
Political lean MEDSL · Lowndes
- 2024 margin
- R (+18.0) · D 40.8% · R 58.8%
- 2008→2024 swing
- -8.6pp toward R · 2008: -9.4pp · 2024: -18.0pp
- All cycles
- 2024: R+18.0 2020: R+12.0 2016: R+18.2 2012: R+10.5 2008: R+9.4
Not yet ingested
- Civics
- —
Market trends
- HPI YoY
- ▼ -150.60%
- Current HPI
- 188.2012
- Rent YoY
- ▲ 4.19%
- Metro
- Valdosta, GA
- State GDP YoY
- ▲ 2.66%
- F500 in state
- 28
Industry mix (Fortune 500 HQ in GA)
| Industry | F500 HQs | Revenue |
|---|---|---|
| Paper / Packaging | 2 | $29B |
|
||
| Retail | 1 | $160B |
|
||
| Transportation / Logistics | 1 | $91B |
|
||
| Airlines | 1 | $62B |
|
||
| Consumer Goods | 1 | $47B |
|
||
| Utilities | 1 | $25B |
|
||
Price history
-5.3% since first listed2 events — show timeline
- 2026-05-18 Price Changed $179,000 SGMLS
- 2026-05-07 Listed $189,000 SGMLS
Cash-flow waterfall
monthlySold comps — $/sqft
last 12 mo · ≤1 miLoading sold comps…