1003 E Warren St · Brownfield, TX
Flood risk 1/10 · Minimal
- FEMA flood zone
- —
- Chance of flooding over 30 yrs
- 0.0%
- Est. flood insurance / yr
- —
Fire risk 1/10 · Minimal
- Est. fire insurance / yr
- $1,222 – $2,270
Heat risk 5/10 · Moderate
- Hot days now (above 99°F)
- 7 days/yr
- Hot days in 30 yrs
- 22 days/yr
Wind risk 2/10 · Minimal
- Chance of severe wind over 30 yrs
- 1.0%
Air-quality risk 1/10 · Minimal
- Unhealthy air days now
- 0 days/yr
- Unhealthy air days in 30 yrs
- 0 days/yr
Risk factors via First Street. Map © Google.
Why this score? — see what drove the B- grade
The composite is a weighted blend of 9 inputs, each scored 0–100. Each bar is that input's sub-score; the figure is the points it added to the 100-point composite (weight × sub-score).
- Cash flow +30.0/30.0
- 1% rule +10.0/10.0
- DSCR +10.0/10.0
- ARV discount +7.5/15.0
- Livability +3.6/5.0
- Rent growth +2.5/5.0
- Condition / age +2.5/5.0
- Schools +2.2/10.0
- Appreciation +0.0/10.0
$55,000
🖨 Deal sheet 📄 Offer letter ✓ Due diligence
Listing remarks
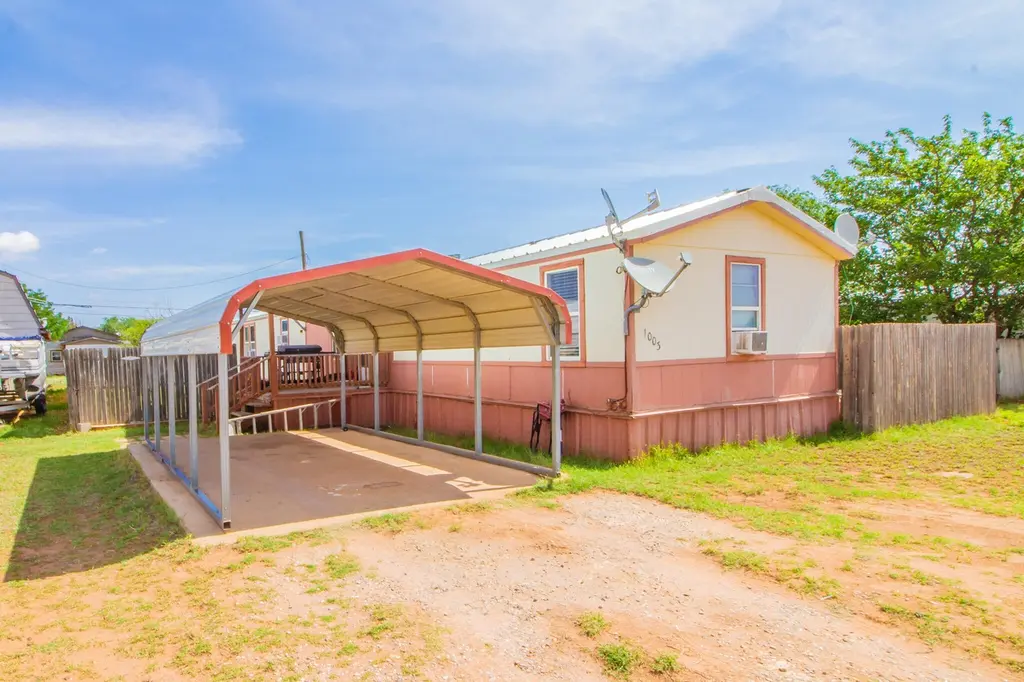
This 3 bedroom, 2 bathroom manufactured home in Brownfield offers plenty of living space as well as outdoor space with multiple covered patios, a fenced backyard, and a carport. Schedule your showing today!
Key facts
- Carport
- Fenced backyard
- 6,969 sq ft lot
Tags
Property features AI
Exterior
- Parking: Carport (1 space)
- Security: See remarks
- Utilities: Road access: dirt and gravel; Road frontage unimproved
- Home design: Manufactured home; Single-story
- Construction: Metal roof; Pillar/post/pier foundation; Other construction materials
- Exterior features: Covered porch/patio; Outdoor storage; Fenced backyard
Interior
- Bathrooms: 2 full bathrooms
- Heating & cooling: Floor furnace heating; Ceiling fans and wall/window units for cooling
- Interior features: Breakfast bar; Built-in bookcases; Ceiling fans; Interior storage
Neighborhood map
What this means for you Summary
Snapshot
- This is a 3-bed/2.0-bath manufactured listed at $55k.
Deal economics
- At list price, monthly cash flow is $527 ($6k/yr) — positive.
- The deal already cash-flows at list — no discount required.
- Meets the 1% rule at list price ($1k rent vs $55k).
- Recommended offer: $54k (1.5% below list) — sets the bar for market timing.
Location & tenants
- Location reads 71/100 on livability (#298 in TX) — a middle-class / working-renter tenant base. Strengths: cost of living A+, housing A+, health & safety A+; Watch: crime D+, amenities D, commute F.
- Brownfield ISD (town): math 26% / reading 27% proficiency, ranked #704 of 826 in TX (top 85%) — low school quality limits family demand, transient renter base, plan for 1-2y turnover; 70% free/reduced lunch — lower-income household profile, screen leases tightly.
- Zoned schools: Brownfield Middle (math 24% / reading 28%, grade F, #1,222 of 1,662 statewide, top 74%, 354 students, 83% FRL); Brownfield H S (math 37% / reading 32%, grade F, #963 of 1,632 statewide, top 61%, 443 students, 78% FRL).
- Market conditions: 89 active listings in the ZIP; 2 comparable units currently listed for rent nearby; 2 units permitted in Terry County in 2024 (0 in 5+ unit buildings).
Forward outlook
- Local home prices are declining (-3.0%/yr); year-one equity from $380 of loan paydown is wiped out by about $2k of value loss. Plan a longer hold.
- Terry County population projected at +16% by 2050 — long-run rental-demand tailwind backs the buy-and-hold thesis.
- At projected returns (-3.0% appreciation + 3.0% rent growth), your $15k cash investment doubles in ~3 years — after that, you're playing with house money.
Negotiation context
- It's been on market 20 days — a 2% lower offer ($54k) is reasonable based on typical stale-listing flexibility.
Risks & watch-outs
- Climate carrying-cost: extreme-heat days projected 7→22/yr by 2055 (HVAC capex compounding) — expect insurance premiums to compound above CPI over the hold.
Questions for the listing agent
- Is there a deadline driving the sale (1031 exchange, divorce, estate, relocation)? That informs how much negotiation room exists.
- Schools are F-rated, which usually means shorter tenancies and higher turnover. Who's the typical renter profile here, and what's been the actual vacancy rate?
- Crime grade is D in this area — have there been break-ins, vandalism, or insurance claims at this property in the last 3 years? What carrier currently insures it and at what premium?
- What's the average days-on-market for RENTAL listings here right now (not sales)? A rising rental-DOM trend means longer vacancies and softer asking-rent achievability than the comps imply.
- What's the recent tenant-quality profile in this submarket — average credit score on applications, eviction rate, late-payment / NSF rate, and stable-employment percentage? A property-management company in the area should have these aggregated.
- How much new for-sale + rental construction is in the pipeline within 1–3 miles? Heavy new supply typically softens prices + rents 12–24 months out; constrained supply supports both.
Investment metrics
- 1% rule
- 2.01% ✓
- Cap rate
- 17.79%
- Cash-on-cash
- 41.08%
- DSCR
- 2.83
- GRM
- 4.1
CMA / ARV
No comps found within radius.
Projected returns pro-forma
-3.0% appreciation · 3.0% rent growth · sell at horizon
- IRR
- 37.6%
- Equity multiple
- 2.60×
- Total profit
- $24,658
- Equity at exit
- $8,201
- IRR
- 44.1%
- Equity multiple
- 5.20×
- Total profit
- $64,689
- Equity at exit
- $4,755
Cash invested: $15,400 (down + closing). Projections, not guarantees.
Landlord ↔ Tenant lean methodology
- Overall (STATE)
- 87 Strongly Landlord-Friendly
- State Texas
- 87 Strongly Landlord-Friendly · R+5
- County
- — inherits STATE
- City
- — inherits STATE
ZIP-level market 79316
- Active inventory
- 89
- Price-to-rent
- 4.1×
Monthly cashflow live
- Estimated rent
- $1,106 medium interval (Pro) →
- Mortgage (P&I)
- −$288
- Tax from tax record
- −$35 /mo · $422/yr
- Insurance
- −$23
- HOA
- −$0
- Vacancy / Maint / Mgmt
- −$232
- Net cashflow
- $527
Break-even live
UW: 25.0% down · 7.5% · 30yr · 1.5% tax · 5.0% vac · 8.0% maint · 8.0% mgmt
Financing live
Cash to close
- Down payment
- $13,750
- Closing costs
- $1,650
- Reserves months
- —
- Total cash needed
- —
Loan-product check · same deal, 3 products live
Conventional
25% down · 7.5% · 30yr
- Down + closing
- —
- Monthly P&I
- —
- Monthly cashflow
- —
- DSCR
- —
- Eligible?
- —
Personal DTI + credit; lowest rate.
DSCR
20% down · 8.5% · 30yr
- Down + closing
- —
- Monthly P&I
- —
- Monthly cashflow
- —
- DSCR
- —
- Eligible?
- —
No personal income docs; deal must DSCR.
Hard money
10% down · 12.0% · 12mo
- Down + closing
- —
- Monthly P&I
- —
- Monthly cashflow
- —
- DSCR
- —
- Eligible?
- —
Short-term bridge; refi at stabilization.
Rent comps 2 comps
| Address | Beds | Baths | Sqft | Rent | $/sqft | DOM | Units | Dist |
|---|---|---|---|---|---|---|---|---|
| 1006 E Lons St Brownfield, TX | 3.0 | 2.0 | 1356 | $1,050 | $0.77 | 43d | 1 | 0.19mi |
| 704 E Yucca Ln Brownfield, TX | 3.0 | 2.0 | 1068 | $1,500 | $1.40 | 43d | 1 | 1.48mi |
Listing history 15 events
-
2026-06-18days on market $55,000 Active 20 DOM
-
2026-06-17days on market $55,000 Active 19 DOM
-
2026-06-16days on market $55,000 Active 18 DOM
-
2026-06-15days on market $55,000 Active 17 DOM
-
2026-06-13days on market $55,000 Active 15 DOM
-
2026-06-12days on market $55,000 Active 14 DOM
-
2026-06-09days on market $55,000 Active 11 DOM
-
2026-06-08days on market $55,000 Active 10 DOM
-
2026-06-08days on market $55,000 Active 9 DOM
-
2026-06-07days on market $55,000 Active 8 DOM
-
2026-06-03days on market $55,000 Active 5 DOM
-
2026-06-02days on market $55,000 Active 4 DOM
-
2026-06-01days on market $55,000 Active 3 DOM
-
2026-05-31days on market $55,000 Active 2 DOM
-
2026-05-28$55,000 Active
ⓘ Source: listings_history table (triggers on properties + properties_extension) + one-shot
backfill from property_details.listing_events for pre-trigger history.
Tax reassessment forecast TX · Resets to sale price
- Current annual tax
- $422 · $35/mo
- Projected year-2 tax
- $1,006 · $84/mo
- Expected delta
- +$585/yr (+$49/mo · 138.6%)
ⓘ Screening estimate from a state-policy table — verify with the county assessor before closing.
Climate risk First Street
- Flood 1/10 Low 0% chance over 30 yrs
- Wildfire 1/10 Low
- Heat 5/10 Major 7 d/yr ≥99°F today · 22 d/yr by 30 yrs out
- Wind 2/10 Low 100% chance of damaging wind over 30 yrs
- Air quality 1/10 Low 0 unhealthy d/yr today · 0 by 30 yrs out
Nearby sold comps map
Loading sold comps map…
Walkable amenities ~0.75 mi
Loading nearby amenities…
Taxation est. · year 1
- Rental income
- $13,271
- − Mortgage interest
- −$3,081
- − Property taxes
- −$422
- − Insurance
- −$275
- − Repairs & maintenance
- −$1,062
- − Management
- −$1,062
- − Depreciation
- −$1,600
- Taxable income
- $5,770
- Est. tax owed @ 24.0%
- −$1,385
- After-tax cash flow
- $4,941/yr
For passive investors: Depreciation is non-cash, so a rental often shows a tax loss while cash-flowing — sheltering income. Rental losses are passive: they offset passive income freely, and up to $25,000/yr can offset ordinary (W-2) income if you actively participate and your MAGI is under $100k (phasing out to $0 by $150k); unused losses carry forward. On sale, claimed depreciation is recaptured at up to 25%, and gains may owe capital-gains tax (a 1031 exchange can defer both). Figures are a year-1 estimate at your 24.0% rate — not tax advice; consult a CPA.
Schools (NCES district)
- District
- Brownfield ISD
- NCES district ID
- 4811610
- Math proficiency
- 26% ▼ -11.00%
- Reading proficiency
- 27% ▲ 1.00%
- Median HH income
- $37,385
- Composite
- 22.1/100
- National rank
- #8180
- State rank
- #704 of 826 in TX
Livability — Brownfield
- Score
- 71/100
- State rank
- #298
- US rank
- #6822
Category grades
Schools grade is shown separately in the Schools card above.
Census & demographics
- Census place
- Brownfield, TX
- Population (ZIP)
- 9,907
Population outlook (Terry County) Hauer SSP2
- Today (2025)
- 13,220 people
- By 2030
- 13,500 · +2.1%
- By 2040
- 14,327 · +8.4%
- By 2050
- 15,340 · +16.0%
- By 2075
- 18,459 · +39.6%
- By 2100
- 20,433 · +54.6%
Race, ethnicity, and origin ACS 2023
- Neighborhood character
- Majority Hispanic (57%)
- Race & ethnicity
- Hispanic / Latino 57% White 37% Two or more races 32% Black 5%
- Hispanic origin (detail)
- Mexican 47%
- Common ancestry
- Italian 2% Slovak 1% German 1%
- Foreign-born
- 8% · Canada
- Languages at home
- 63% English-only · Spanish 34% German/W. Germanic 2%
Political lean MEDSL · Terry
- 2024 margin
- Solid R (+65.2) · D 17.2% · R 82.3%
- 2008→2024 swing
- -30.1pp toward R · 2008: -35.0pp · 2024: -65.2pp
- All cycles
- 2024: R+65.2 2020: R+56.9 2016: R+49.4 2012: R+41.6 2008: R+35.0
Not yet ingested
- Civics
- —
Market trends
- HPI YoY
- ▼ -65.34%
- Current HPI
- 104.1813
- Rent YoY
- —
- Metro
- —
- State GDP YoY
- ▲ 3.95%
- F500 in state
- 110
Industry mix (Fortune 500 HQ in TX)
| Industry | F500 HQs | Revenue |
|---|---|---|
| Energy | 16 | $1,198B |
|
||
| Technology | 5 | $198B |
|
||
| Engineering / Construction | 4 | $72B |
|
||
| Energy Services | 3 | $60B |
|
||
| Utilities | 3 | $41B |
|
||
| Healthcare | 2 | $330B |
|
||
Price history
1 event — show timeline
- 2026-05-28 Listed $55,000 LARMLS
Property tax history
+1.5%/yrLatest (2025): $422 · -1.1% YoY. Source: county tax records.
Cash-flow waterfall
monthlySold comps — $/sqft
last 12 mo · ≤1 miLoading sold comps…