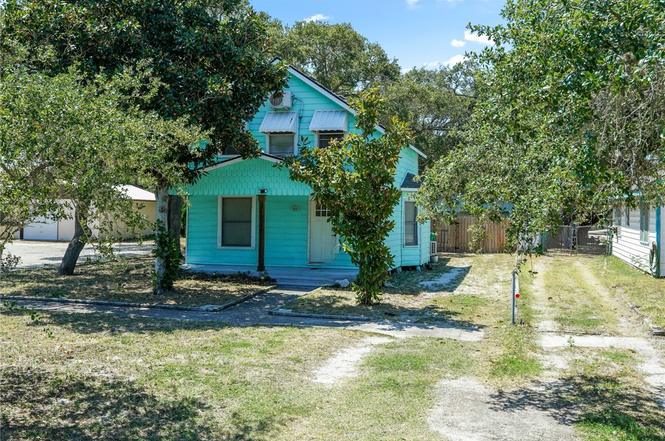
936 S Houston St · Aransas Pass, TX
Flood risk 7/10 · Major
- FEMA flood zone
- X (unshaded)
- Chance of flooding over 30 yrs
- 0.96%
- Est. flood insurance / yr
- $507 – $1,088
Fire risk 3/10 · Minor
- Est. fire insurance / yr
- $1,222 – $2,270
Heat risk 10/10 · Severe
- Hot days now (above 106°F)
- 7 days/yr
- Hot days in 30 yrs
- 29 days/yr
Wind risk 9/10 · Severe
- Chance of severe wind over 30 yrs
- 99.0%
Air-quality risk 1/10 · Minimal
- Unhealthy air days now
- 0 days/yr
- Unhealthy air days in 30 yrs
- 0 days/yr
Risk factors via First Street. Map © Google.
Why this score? — see what drove the C+ grade
The composite is a weighted blend of 9 inputs, each scored 0–100. Each bar is that input's sub-score; the figure is the points it added to the 100-point composite (weight × sub-score).
- Cash flow +27.4/30.0
- DSCR +9.6/10.0
- 1% rule +7.9/10.0
- ARV discount +7.5/15.0
- Livability +3.6/5.0
- Schools +2.7/10.0
- Rent growth +2.5/5.0
- Condition / age +2.5/5.0
- Appreciation +0.0/10.0
$229,900
🖨 Deal sheet (PDF) 📄 Offer letter ✓ Due diligence
Listing remarks
$2500 closing costs with acceptable offer!! Adorable Historic Home Just Blocks from the Ocean. Step into timeless charm with this beautifully maintained 3-bedroom, 2-bath home, perfectly blending historic character with modern comfort. Nestled on a tree-lined lot, this property offers the ideal coastal lifestyle—just blocks from the ocean. Inside, you’ll find a thoughtfully designed interior, fully furnished for immediate move-in, or perfect for an income producing Airbnb. The spacious living areas showcase classic architectural details while providing a warm, welcoming atmosphere. The updated kitchen and dining space make entertaining easy, while large windows invite in natural
Key facts
- Large windows
- Updated kitchen
- Historic home
Tags
Property features AI
Finance
- HOA & community: Short-term rentals allowed
Exterior
- Parking: Detached garage; 2 garage spaces; Rear/side/off-street parking; On-street parking; RV access/parking
- Security: Security system; Smoke detectors
- Utilities: Public water; Public sewer; Utilities available
- Home design: 2-story house; Shingle roof; Vinyl siding; Slab foundation
- Construction: Built with vinyl siding; Shingle roof; Slab foundation
- Exterior features: Covered, screened patio; Storage; Wood fencing; Landscaped, interior lot
Interior
- Kitchen: Electric oven; Electric range; Refrigerator
- Bedrooms: Primary bedroom located downstairs
- Flooring: Hardwood; Laminate; Tile
- Bathrooms: 2 full bathrooms
- Heating & cooling: Heat pump; Ductless heating and cooling; Window unit(s)
- Interior features: Open floor plan; Paneling and wainscoting; Window coverings and treatments; Primary bedroom on the downstairs level; Split bedroom layout
- Laundry & utility: Washer hookup; Dryer hookup; Washer; Dryer
Neighborhood map
What this means for you Summary
Snapshot
- This is a 3-bed/2.0-bath single-family listed at $230k.
Deal economics
- At list price, monthly cash flow is $607 ($7k/yr) — positive.
- The deal already cash-flows at list — no discount required.
- Meets the 1% rule at list price ($3k rent vs $230k).
- Recommended offer: $223k (3.0% below list) — sets the bar for market timing.
- Cap rate 9.8% vs local median 4.6% in Aransas Pass — top-decile yield for the area; either an underpriced asset or a hidden risk that comps aren't pricing in. Stress-test before assuming the spread holds.
Location & tenants
- Location reads 72/100 on livability (#253 in TX) — a middle-class / working-renter tenant base. Strengths: cost of living A+, housing A+, health & safety A+; Watch: amenities F, commute F, employment F.
- Aransas Pass ISD (town): math 28% / reading 35% proficiency, ranked #597 of 826 in TX (top 72%) — families likely to look elsewhere, expect single-tenant / working-renter base with shorter leases; 64% free/reduced lunch — lower-income household profile, screen leases tightly.
- Zoned schools: H T Faulk El (483 students, 74% FRL); A C Blunt Middle (math 23% / reading 34%, grade F, #1,122 of 1,662 statewide, top 69%, 387 students, 64% FRL); Aransas Pass H S (math 37% / reading 37%, grade F, #897 of 1,632 statewide, top 57%, 457 students, 56% FRL) — zoned schools at 65% FRL track the district average.
- Market conditions: 283 active listings in the ZIP; 3 comparable units currently listed for rent nearby; rentals lingering (median 46d on market — plan ~5-8 weeks vacancy on turnover, expect pricing pressure); 67% of comp listings sitting > 30 days — soft ceiling on asking rent; 344 units permitted in San Patricio County in 2024 (0 in 5+ unit buildings).
Forward outlook
- Local home prices are declining (-3.0%/yr); year-one equity from $2k of loan paydown is wiped out by about $7k of value loss. Plan a longer hold.
- San Patricio County population projected at +27% by 2050 — long-run rental-demand tailwind backs the buy-and-hold thesis.
- At projected returns (-3.0% appreciation + 3.0% rent growth), your $64k cash investment doubles in ~10 years — after that, you're playing with house money.
Negotiation context
- It's been on market 47 days — a 3% lower offer ($223k) is reasonable based on typical stale-listing flexibility.
- 7 sale attempts since 8y ago with the ask held roughly flat each time — persistent listings suggest the price (not the market) is what's stuck; bring a comps-based counter.
Risks & watch-outs
- Watch-outs: flood insurance adds $66/mo; built in 1950 — expect roof / HVAC / electrical / plumbing capex.
- Climate carrying-cost: major flood risk; severe wind risk, 99% chance of damaging wind over 30y; extreme-heat days projected 7→29/yr by 2055 (HVAC capex compounding) — expect insurance premiums to compound above CPI over the hold.
Questions for the listing agent
- It's been on market 47 days. Have you received any prior offers? Is the seller open to a 3% concession, seller financing, or rate buy-down credit?
- Built in 1950 — when were the roof, HVAC, electrical panel, plumbing, and water heater last replaced?
- What's the actual annual flood-insurance premium (NFIP or private), and is the property in a SFHA with mandatory coverage?
- Is there a deadline driving the sale (1031 exchange, divorce, estate, relocation)? That informs how much negotiation room exists.
- Schools are D-rated, which usually means shorter tenancies and higher turnover. Who's the typical renter profile here, and what's been the actual vacancy rate?
- What's the average days-on-market for RENTAL listings here right now (not sales)? A rising rental-DOM trend means longer vacancies and softer asking-rent achievability than the comps imply.
- What's the recent tenant-quality profile in this submarket — average credit score on applications, eviction rate, late-payment / NSF rate, and stable-employment percentage? A property-management company in the area should have these aggregated.
- How much new for-sale + rental construction is in the pipeline within 1–3 miles? Heavy new supply typically softens prices + rents 12–24 months out; constrained supply supports both.
Investment metrics
- 1% rule
- 1.29% ✓
- Cap rate
- 9.81%
- Cash-on-cash
- 12.55%
- DSCR
- 1.56
- GRM
- 6.5
CMA / ARV
- ARV (on-the-fly)
- $230,090
- Comps found
- 12
Show comp detail 12 sales within ~0.75 mi
| Address | Dist | Beds/Ba | Sqft | Sold | Price | $/sf | Match |
|---|---|---|---|---|---|---|---|
| 936 S Houston St | 0.00mi | 3/2.0 | 1,330 (0%) | 1mo | $229,900 | $173 | 99 |
| 243 E Magnolia Ave | 0.24mi | 3/2.0 | 1,325 (-0%) | 2mo | $249,000 | $188 | 87 |
| 630 S Lamont | 0.41mi | 3/2.0 | 1,269 (-5%) | 2mo | $229,000 | $180 | 72 |
| 1179 Houston S | 0.27mi | 3/2.0 | 1,395 (+5%) | 9mo | $235,000 | $168 | 72 |
| 109 Misty | 0.62mi | 3/2.0 | 1,339 (+1%) | 4mo | $210,000 | $157 | 66 |
| 762 S Bay | 0.53mi | 3/2.0 | 1,409 (+6%) | 1mo | $550,000 | $390 | 65 |
| 119 Misty Ln | 0.66mi | 3/2.0 | 1,264 (-5%) | 4mo | $249,500 | $197 | 58 |
| 101 Saunders Ln | 0.44mi | 3/2.0 | 1,206 (-9%) | 9mo | $220,000 | $182 | 57 |
| 1034 S 10th St | 0.72mi | 2/2.0 (-1) | 1,312 (-1%) | 5mo | $179,900 | $137 | 55 |
| 348 S Whitney St | 0.58mi | 2/2.5 (-1) | 1,220 (-8%) | 2mo | $199,000 | $163 | 51 |
| 1500 Kenwood Dr | 0.64mi | 3/2.0 | 1,459 (+10%) | 4mo | $240,000 | $164 | 50 |
| 612 S 9th St | 0.71mi | 3/1.0 | 1,131 (-15%) | 7mo | $127,900 | $113 | 32 |
Match score weights: distance 35% · size 25% · config 20% · recency 20%. Top-matched comps best support the ARV.
Projected returns pro-forma
-3.0% appreciation · 3.0% rent growth · sell at horizon
- IRR
- 0.6%
- Equity multiple
- 1.02×
- Total profit
- $1,542
- Equity at exit
- $34,279
- IRR
- 10.3%
- Equity multiple
- 1.80×
- Total profit
- $51,677
- Equity at exit
- $19,878
Cash invested: $64,372 (down + closing). Projections, not guarantees.
Landlord ↔ Tenant lean methodology
- Overall (STATE)
- 87 Strongly Landlord-Friendly
- State Texas
- 87 Strongly Landlord-Friendly · R+5
- County
- — inherits STATE
- City
- — inherits STATE
ZIP-level market 78336
- Home prices YoY
- -29.5%
- Active inventory
- 283
- Price-to-rent
- 6.5×
Monthly cashflow live
- Estimated rent
- $2,968 medium interval (Pro) →
- Mortgage (P&I)
- −$1,206
- Tax from tax record
- −$370 /mo · $4,434/yr
- Insurance
- −$96
- Flood insurance flood zone
- −$66 /mo · $798/yr
- HOA
- −$0
- Vacancy / Maint / Mgmt
- −$623
- Net cashflow
- $607
Break-even live
Sensitivity live
| Price | -10% $737 | -5% $672 | +0% $607 | +5% $542 | +10% $477 |
|---|---|---|---|---|---|
| Rent | -10% $373 | -5% $490 | +0% $607 | +5% $724 | +10% $841 |
| Rate | -1.0pp $723 | -0.5pp $665 | base $607 | +0.5pp $547 | +1.0pp $487 |
UW: 25.0% down · 7.5% · 30yr · 1.5% tax · 5.0% vac · 8.0% maint · 8.0% mgmt
Financing live
Cash to close
- Down payment
- $57,475
- Closing costs
- $6,897
- Reserves months
- —
- Total cash needed
- —
Loan-product check · same deal, 3 products live
Conventional
25% down · 7.5% · 30yr
- Down + closing
- —
- Monthly P&I
- —
- Monthly cashflow
- —
- DSCR
- —
- Eligible?
- —
Personal DTI + credit; lowest rate.
DSCR
20% down · 8.5% · 30yr
- Down + closing
- —
- Monthly P&I
- —
- Monthly cashflow
- —
- DSCR
- —
- Eligible?
- —
No personal income docs; deal must DSCR.
Hard money
10% down · 12.0% · 12mo
- Down + closing
- —
- Monthly P&I
- —
- Monthly cashflow
- —
- DSCR
- —
- Eligible?
- —
Short-term bridge; refi at stabilization.
Rent comps 3 comps
| Address | Beds | Baths | Sqft | Rent | $/sqft | DOM | Units | Dist |
|---|---|---|---|---|---|---|---|---|
| 1131 S 8th St Unit 1268400P Aransas Pass, TX | 3.0 | 2.0 | 1280 | $4,105 | $3.21 | 45d | 1 | 0.55mi |
| 1109 W Nelson Ave Aransas Pass, TX | 2.0 | 2.0 | 1304 | $1,800 | $1.38 | 45d | 1 | 0.81mi |
| 633 N Commercial St Aransas Pass, TX | 2.0 | 1.0 | 900 | $1,850 | $2.06 | 23d | 1 | 1.32mi |
Listing history 26 events
-
2026-04-26status Pending
-
2026-04-15historical
-
2026-04-08price $229,900
-
2026-03-22price $234,900
-
2026-02-27$235,000 Active
-
2025-10-05status Active
-
2025-09-27status Pending
-
2025-09-09price $239,900
-
2025-08-23$255,000 Active
-
2025-05-31price $255,000
-
2025-04-18price $265,000
-
2025-01-06$280,000 Active
-
2022-05-11soldstatus
-
2022-05-10historical
-
2022-05-09soldstatus Closed
-
2022-04-10status Pending
-
2022-04-01status Active
-
2022-03-24status Pending
-
2022-03-22historical
-
2022-02-02$225,000 Active
-
2022-01-26soldstatus
-
2018-02-20historical
-
2018-02-09soldstatus
-
2018-02-07soldstatus Closed
-
2018-01-31status Pending
-
2018-01-21$65,000 Active
ⓘ Source: listings_history table (triggers on properties + properties_extension) + one-shot
backfill from property_details.listing_events for pre-trigger history.
Tax reassessment forecast TX · Resets to sale price
- Current annual tax
- $4,434 · $370/mo
- Projected year-2 tax
- $4,434 · $370/mo
- Expected delta
- $0/yr ($0/mo · 0.0%)
ⓘ Screening estimate from a state-policy table — verify with the county assessor before closing.
Climate risk First Street
- Flood 7/10 Severe FEMA zone X (unshaded) · 96% chance over 30 yrs
- Wildfire 3/10 Moderate
- Heat 10/10 Extreme 7 d/yr ≥106°F today · 29 d/yr by 30 yrs out
- Wind 9/10 Extreme 99% chance of damaging wind over 30 yrs
- Air quality 1/10 Low 0 unhealthy d/yr today · 0 by 30 yrs out
Nearby sold comps map
Loading sold comps map…
Walkable amenities ~0.75 mi
Loading nearby amenities…
Taxation est. · year 1
- Rental income
- $35,611
- − Mortgage interest
- −$12,878
- − Property taxes
- −$4,434
- − Insurance
- −$1,947
- − Repairs & maintenance
- −$2,849
- − Management
- −$2,849
- − Depreciation
- −$6,688
- Taxable income
- $3,966
- Est. tax owed @ 24.0%
- −$952
- After-tax cash flow
- $6,332/yr
For passive investors: Depreciation is non-cash, so a rental often shows a tax loss while cash-flowing — sheltering income. Rental losses are passive: they offset passive income freely, and up to $25,000/yr can offset ordinary (W-2) income if you actively participate and your MAGI is under $100k (phasing out to $0 by $150k); unused losses carry forward. On sale, claimed depreciation is recaptured at up to 25%, and gains may owe capital-gains tax (a 1031 exchange can defer both). Figures are a year-1 estimate at your 24.0% rate — not tax advice; consult a CPA.
Schools (NCES district)
- District
- Aransas Pass ISD
- NCES district ID
- 4808580
- Math proficiency
- 28% ▼ -16.00%
- Reading proficiency
- 35% ▼ -4.00%
- Median HH income
- $40,869
- Composite
- 26.55/100
- National rank
- #7191
- State rank
- #597 of 826 in TX
Livability — Aransas Pass
- Score
- 72/100
- State rank
- #253
- US rank
- #5980
Category grades
Schools grade is shown separately in the Schools card above.
Census & demographics
- Census place
- Aransas Pass, TX
- Population (ZIP)
- 12,146
Population outlook (San Patricio County) Hauer SSP2
- Today (2025)
- 75,538 people
- By 2030
- 79,575 · +5.3%
- By 2040
- 87,670 · +16.1%
- By 2050
- 96,107 · +27.2%
- By 2075
- 117,984 · +56.2%
- By 2100
- 130,010 · +72.1%
Race, ethnicity, and origin ACS 2023
- Neighborhood character
- Diverse neighborhood (Simpson 0.58)
- Race & ethnicity
- White 49% Hispanic / Latino 43% Two or more races 21% Asian 2% Native American 2% Black 2%
- Hispanic origin (detail)
- Mexican 36% Puerto Rican 2%
- Common ancestry
- Italian 2% Lithuanian 2% Slovak 1%
- Foreign-born
- 9% · Canada, Jamaica, China
- Languages at home
- 77% English-only · Spanish 21% Tagalog/Filipino 1%
Political lean MEDSL · San Patricio
- 2024 margin
- Solid R (+36.4) · D 31.4% · R 67.8%
- 2008→2024 swing
- -19.8pp toward R · 2008: -16.6pp · 2024: -36.4pp
- All cycles
- 2024: R+36.4 2020: R+29.1 2016: R+24.1 2012: R+20.6 2008: R+16.6
Not yet ingested
- Civics
- —
Market trends
- HPI YoY
- ▼ -78.56%
- Current HPI
- 187.8443
- Rent YoY
- —
- Metro
- —
- State GDP YoY
- ▲ 3.95%
- F500 in state
- 110
Industry mix (Fortune 500 HQ in TX)
| Industry | F500 HQs | Revenue |
|---|---|---|
| Energy | 16 | $1,198B |
|
||
| Technology | 5 | $198B |
|
||
| Engineering / Construction | 4 | $72B |
|
||
| Energy Services | 3 | $60B |
|
||
| Utilities | 3 | $41B |
|
||
| Healthcare | 2 | $330B |
|
||
Price history
+253.7% since first listed26 events — show timeline
- 2026-04-26 Pending — CBMLS
- 2026-04-15 Delisted — CBMLS
- 2026-04-08 Price Changed $229,900 CBMLS
- 2026-03-22 Price Changed $234,900 CBMLS
- 2026-02-27 Listed $235,000 CBMLS
- 2025-10-05 Relisted — CBMLS
- 2025-09-27 Pending — CBMLS
- 2025-09-09 Price Changed $239,900 CBMLS
- 2025-08-23 Listed $255,000 CBMLS
- 2025-05-31 Price Changed $255,000 CBMLS
- 2025-04-18 Price Changed $265,000 CBMLS
- 2025-01-06 Listed $280,000 CBMLS
- 2022-05-11 Sold (Public Records) — Public Records
- 2022-05-10 Delisted — CBMLS
- 2022-05-09 Sold (MLS) — CBMLS
- 2022-04-10 Pending — CBMLS
- 2022-04-01 Relisted — CBMLS
- 2022-03-24 Pending — CBMLS
- 2022-03-22 Delisted — CBMLS
- 2022-02-02 Listed $225,000 CBMLS
- 2022-01-26 Sold (Public Records) — Public Records
- 2018-02-20 Delisted — CBMLS
- 2018-02-09 Sold (Public Records) — Public Records
- 2018-02-07 Sold (MLS) — CBMLS
- 2018-01-31 Pending — CBMLS
- 2018-01-21 Listed $65,000 CBMLS
Property tax history
+10.0%/yrLatest (2025): $4,434 · +3.2% YoY. Source: county tax records.
Cash-flow waterfall
monthlySold comps — $/sqft
last 12 mo · ≤1 miLoading sold comps…