None · Memphis, FL
Flood risk 5/10 · Moderate
- FEMA flood zone
- X (unshaded)
- Chance of flooding over 30 yrs
- 0.23%
- Est. flood insurance / yr
- $507 – $1,088
Fire risk 3/10 · Minor
- Est. fire insurance / yr
- $947 – $1,759
Heat risk 10/10 · Severe
- Hot days now (above 107°F)
- 7 days/yr
- Hot days in 30 yrs
- 30 days/yr
Wind risk 10/10 · Severe
- Chance of severe wind over 30 yrs
- 99.0%
Air-quality risk 3/10 · Minor
- Unhealthy air days now
- 3 days/yr
- Unhealthy air days in 30 yrs
- 3 days/yr
Risk factors via First Street. Map © Google.
Why this score? — see what drove the B- grade
The composite is a weighted blend of 9 inputs, each scored 0–100. Each bar is that input's sub-score; the figure is the points it added to the 100-point composite (weight × sub-score).
- Cash flow +26.0/30.0
- ARV discount +15.0/15.0
- DSCR +8.7/10.0
- 1% rule +6.4/10.0
- Schools +4.4/10.0
- Livability +3.2/5.0
- Condition / age +2.5/5.0
- Rent growth +1.8/5.0
- Appreciation +0.0/10.0
$189,900
🖨 Deal sheet (PDF) 📄 Offer letter ✓ Due diligence
Listing remarks MLS
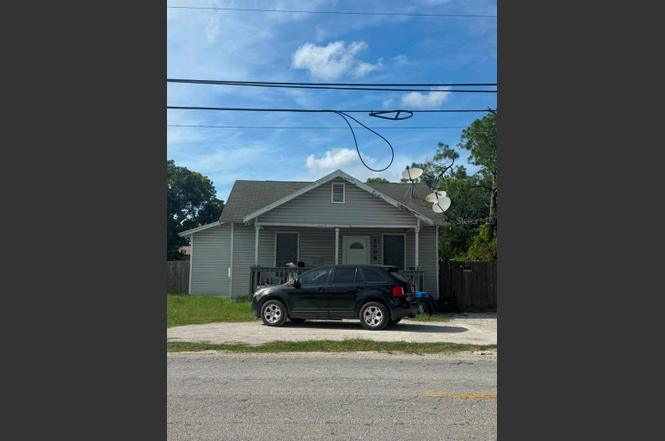
Under $240K Unbelievable! Great starter home or investment property. Spacious rooms. Affordable 2/2 offers great potential with some TLC. Large yard. Features central air. Centrally located to shopping, transportation and close to attractions such as Gamble Plantation State Park, Lincoln Park, Lincoln Aquatic Center, and the Palmetto Estuary Preserve. Seller financing offered 30k down, 9% interest for 50 year term with full price offer.
Key facts
- 5,576 sq ft lot
- Built 1963
Property features AI
Finance
- Other: Zoning: RSF6; Universal property ID available
- Financial info: No lease restrictions; Tax information available (not listed here)
- HOA & community: No HOA indicated
Exterior
- Parking: No parking details provided
- Utilities: Public water; Public sewer; Public utilities
- Home design: Single family residence; One story; Faces south; Homestead property
- Construction: Vinyl siding and frame construction; Shingle roof; Crawlspace foundation; Built on a 0.13-acre lot
- Exterior features: Paved road access
Interior
- Kitchen: Other appliances
- Bedrooms: 2 bedrooms
- Flooring: Other flooring
- Bathrooms: 2 full bathrooms
- Heating & cooling: Central heating; Central air conditioning
- Interior features: Other interior features
- Laundry & utility: No laundry facilities
Neighborhood map
What this means for you Summary
Snapshot
- This is a 3-bed/1.0-bath single-family listed at $190k.
Deal economics
- At list price, monthly cash flow is $471 ($6k/yr) — positive.
- The deal already cash-flows at list — no discount required.
- Meets the 1% rule at list price ($2k rent vs $190k).
- Cap rate 9.3% vs local median 4.5% in Memphis — top-decile yield for the area; either an underpriced asset or a hidden risk that comps aren't pricing in. Stress-test before assuming the spread holds.
Location & tenants
- Location reads 63/100 on livability (#745 in FL) — a middle-class / working-renter tenant base. Strengths: cost of living A+, housing A+; Watch: employment D+, schools F, amenities F.
- Manatee (suburban): math 54% / reading 50% proficiency, ranked #26 of 73 in FL (top 36%) — acceptable for families but not a draw, mixed tenant base, ~2y average lease.
- Market conditions: Rents soft (-3.0%/yr); 1160 active listings in the ZIP; 8 comparable units currently listed for rent nearby; rentals at typical pace (median 25d on market — plan ~3-4 weeks tenant-placement turnaround); solid renter incomes; 7,472 units permitted in Manatee County in 2024 (1,782 in 5+ unit buildings).
- This rent runs 33% of the median local income ($78k/yr) — at the standard rent-burdened threshold; future hikes will face affordability resistance.
Forward outlook
- Local home prices are declining (-3.0%/yr); year-one equity from $1k of loan paydown is wiped out by about $6k of value loss. Plan a longer hold.
- Manatee County population projected at +43% by 2050 — long-run rental-demand tailwind backs the buy-and-hold thesis.
Negotiation context
- Only 1 days on market — expect competitive offers; lowballing is unlikely to land.
- 13 sale attempts since 21y ago with the ask held roughly flat each time — persistent listings suggest the price (not the market) is what's stuck; bring a comps-based counter.
Risks & watch-outs
- Climate carrying-cost: moderate flood risk; severe wind risk, 99% chance of damaging wind over 30y; extreme-heat days projected 7→30/yr by 2055 (HVAC capex compounding) — expect insurance premiums to compound above CPI over the hold.
Questions for the listing agent
- Built in 1963 — when were the roof, HVAC, electrical panel, plumbing, and water heater last replaced?
- Is there a deadline driving the sale (1031 exchange, divorce, estate, relocation)? That informs how much negotiation room exists.
- Schools are F-rated, which usually means shorter tenancies and higher turnover. Who's the typical renter profile here, and what's been the actual vacancy rate?
- What's the average days-on-market for RENTAL listings here right now (not sales)? A rising rental-DOM trend means longer vacancies and softer asking-rent achievability than the comps imply.
- What's the recent tenant-quality profile in this submarket — average credit score on applications, eviction rate, late-payment / NSF rate, and stable-employment percentage? A property-management company in the area should have these aggregated.
- How much new for-sale + rental construction is in the pipeline within 1–3 miles? Heavy new supply typically softens prices + rents 12–24 months out; constrained supply supports both.
Investment metrics
- 1% rule
- 1.14% ✓
- Cap rate
- 9.27%
- Cash-on-cash
- 10.64%
- DSCR
- 1.47
- GRM
- 7.3
CMA / ARV
- ARV (on-the-fly)
- $252,080
- Comps found
- 3
Show comp detail 3 sales within ~0.75 mi
| Address | Dist | Beds/Ba | Sqft | Sold | Price | $/sf | Match |
|---|---|---|---|---|---|---|---|
| 1719 24th St E | 0.47mi | 3/2.0 | 1,053 (+14%) | 2mo | $285,000 | $271 | 49 |
| 1708 24th St E | 0.49mi | 3/2.0 | 1,053 (+14%) | 16mo | $299,000 | $284 | 36 |
| 2308 12th Ave E | 0.55mi | 3/2.0 | 1,053 (+14%) | 24mo | $288,000 | $274 | 26 |
Match score weights: distance 35% · size 25% · config 20% · recency 20%. Top-matched comps best support the ARV.
Projected returns pro-forma
-3.0% appreciation · 0.0% rent growth · sell at horizon
- IRR
- -3.7%
- Equity multiple
- 0.87×
- Total profit
- $-7,094
- Equity at exit
- $28,315
- IRR
- 2.4%
- Equity multiple
- 1.15×
- Total profit
- $7,962
- Equity at exit
- $16,419
Cash invested: $53,172 (down + closing). Projections, not guarantees.
Landlord ↔ Tenant lean methodology
- Overall (STATE)
- 87 Strongly Landlord-Friendly
- State Florida
- 87 Strongly Landlord-Friendly · R+3
- County
- — inherits STATE
- City
- — inherits STATE
ZIP-level market 34221
- Rents YoY
- -3.0%
- Active inventory
- 1160
- Price-to-rent
- 7.3×
Monthly cashflow live
- Estimated rent
- $2,160 high interval (Pro) →
- Mortgage (P&I)
- −$996
- Tax from tax record
- −$160 /mo · $1,916/yr
- Insurance
- −$79
- HOA
- −$0
- Vacancy / Maint / Mgmt
- −$453
- Net cashflow
- $471
Break-even live
Sensitivity live
| Price | -10% $579 | -5% $525 | +0% $471 | +5% $418 | +10% $364 |
|---|---|---|---|---|---|
| Rent | -10% $301 | -5% $386 | +0% $471 | +5% $557 | +10% $642 |
| Rate | -1.0pp $567 | -0.5pp $520 | base $471 | +0.5pp $422 | +1.0pp $372 |
UW: 25.0% down · 7.5% · 30yr · 1.5% tax · 5.0% vac · 8.0% maint · 8.0% mgmt
Financing live
Cash to close
- Down payment
- $47,475
- Closing costs
- $5,697
- Reserves months
- —
- Total cash needed
- —
Loan-product check · same deal, 3 products live
Conventional
25% down · 7.5% · 30yr
- Down + closing
- —
- Monthly P&I
- —
- Monthly cashflow
- —
- DSCR
- —
- Eligible?
- —
Personal DTI + credit; lowest rate.
DSCR
20% down · 8.5% · 30yr
- Down + closing
- —
- Monthly P&I
- —
- Monthly cashflow
- —
- DSCR
- —
- Eligible?
- —
No personal income docs; deal must DSCR.
Hard money
10% down · 12.0% · 12mo
- Down + closing
- —
- Monthly P&I
- —
- Monthly cashflow
- —
- DSCR
- —
- Eligible?
- —
Short-term bridge; refi at stabilization.
Rent comps 8 comps
| Address | Beds | Baths | Sqft | Rent | $/sqft | DOM | Units | Dist |
|---|---|---|---|---|---|---|---|---|
| 1607 18th St E Palmetto, FL | 3.0 | 1.0 | 916 | $1,950 | $2.13 | 25d | 1 | 0.12mi |
| 900 21st St E Palmetto, FL | 2.0–3.0 | 1.0 | 800 | $1,795 | $2.24 | 25d | 1 | 0.66mi |
| 719 23rd St E Palmetto, FL | 3.0 | 2.0 | 1060 | $1,800 | $1.70 | 11d | 1 | 0.73mi |
| 900 9th Ave E Unit 180 Palmetto, FL | 2.0 | 2.0 | 1000 | $1,650 | $1.65 | 17d | 1 | 0.99mi |
| 1651 36th Ave E Ellenton, FL | 1.0–3.0 | 1.0–2.0 | 804 | $1,619 | $2.01 | 4d | 13 | 1.00mi |
| 307 27th St E Palmetto, FL | 2.0 | 2.0 | 980 | $2,000 | $2.04 | 25d | 1 | 1.11mi |
| 1809 5th Ave W Palmetto, FL | 3.0 | 1.0 | 962 | $1,895 | $1.97 | 25d | 1 | 1.37mi |
| 501 11th St W Palmetto, FL | 2.0 | 1.0 | 850 | $1,340 | $1.58 | 3d | 1 | 1.50mi |
Listing history 2 events
-
2026-06-18remarks 165-char remark
-
2026-06-18$189,900 Active 1 DOM
ⓘ Source: listings_history table (triggers on properties + properties_extension) + one-shot
backfill from property_details.listing_events for pre-trigger history.
Tax reassessment forecast FL · Resets to sale price
- Current annual tax
- $1,916 · $160/mo
- Projected year-2 tax
- $1,916 · $160/mo
- Expected delta
- $0/yr ($0/mo · 0.0%)
ⓘ Screening estimate from a state-policy table — verify with the county assessor before closing.
Climate risk First Street
- Flood 5/10 Major FEMA zone X (unshaded) · 23% chance over 30 yrs
- Wildfire 3/10 Moderate
- Heat 10/10 Extreme 7 d/yr ≥107°F today · 30 d/yr by 30 yrs out
- Wind 10/10 Extreme 99% chance of damaging wind over 30 yrs
- Air quality 3/10 Moderate 3 unhealthy d/yr today · 3 by 30 yrs out
Nearby sold comps map
Loading sold comps map…
Walkable amenities ~0.75 mi
Loading nearby amenities…
Taxation est. · year 1
- Rental income
- $25,914
- − Mortgage interest
- −$10,637
- − Property taxes
- −$1,916
- − Insurance
- −$950
- − Repairs & maintenance
- −$2,073
- − Management
- −$2,073
- − Depreciation
- −$5,524
- Taxable income
- $2,741
- Est. tax owed @ 24.0%
- −$658
- After-tax cash flow
- $4,999/yr
For passive investors: Depreciation is non-cash, so a rental often shows a tax loss while cash-flowing — sheltering income. Rental losses are passive: they offset passive income freely, and up to $25,000/yr can offset ordinary (W-2) income if you actively participate and your MAGI is under $100k (phasing out to $0 by $150k); unused losses carry forward. On sale, claimed depreciation is recaptured at up to 25%, and gains may owe capital-gains tax (a 1031 exchange can defer both). Figures are a year-1 estimate at your 24.0% rate — not tax advice; consult a CPA.
Schools (NCES district)
- District
- Manatee
- NCES district ID
- 1201230
- Math proficiency
- 54% ▼ -6.00%
- Reading proficiency
- 50% ▼ -2.00%
- Median HH income
- $49,607
- Composite
- 44.43/100
- National rank
- #2806
- State rank
- #26 of 73 in FL
Livability — Memphis
- Score
- 63/100
- State rank
- #745
- US rank
- #16072
Category grades
Schools grade is shown separately in the Schools card above.
Census & demographics
- Census place
- Memphis, FL
- County
- Manatee County · 416,364 people
- City population
- 14,819
- Metro
- North Port-Sarasota-Bradenton, FL
- Population (ZIP)
- 56,208
- Household income
- $77,712
- Rent vs Own
- Severe rent burden
- 1193.0
Population outlook (Manatee County) Hauer SSP2
- Today (2025)
- 447,342 people
- By 2030
- 488,911 · +9.3%
- By 2040
- 567,934 · +27.0%
- By 2050
- 637,995 · +42.6%
- By 2075
- 781,970 · +74.8%
- By 2100
- 848,272 · +89.6%
Race, ethnicity, and origin ACS 2023
- Neighborhood character
- Diverse neighborhood (Simpson 0.58)
- Race & ethnicity
- White 59% Hispanic / Latino 22% Black 14% Two or more races 11%
- Hispanic origin (detail)
- Mexican 14% Puerto Rican 3%
- Common ancestry
- Romanian 2% Lithuanian 2% Italian 2%
- Foreign-born
- 10% · Canada, Dominican Republic, Jamaica
- Languages at home
- 81% English-only · Spanish 16% Other Indo-European 1%
Political lean MEDSL · Manatee
- 2024 margin
- Strong R (+23.5) · D 37.9% · R 61.4%
- 2008→2024 swing
- -16.5pp toward R · 2008: -7.0pp · 2024: -23.5pp
- All cycles
- 2024: R+23.5 2020: R+16.1 2016: R+17.1 2012: R+12.5 2008: R+7.0
Not yet ingested
- Civics
- —
Market trends
- HPI YoY
- ▼ -383.53%
- Current HPI
- 302.1458
- Rent YoY
- ▼ -2.98%
- Metro
- North Port-Sarasota-Bradenton, FL
- State GDP YoY
- ▲ 3.28%
- F500 in state
- 36
Industry mix (Fortune 500 HQ in FL)
| Industry | F500 HQs | Revenue |
|---|---|---|
| Industrial Technology | 2 | $29B |
|
||
| Insurance | 2 | $17B |
|
||
| Retail | 1 | $60B |
|
||
| Technology Distribution | 1 | $58B |
|
||
| Homebuilding | 1 | $35B |
|
||
| Technology Manufacturing | 1 | $35B |
|
||
Price history
+187.7% since first listed27 events — show timeline
- 2026-06-17 Listed $189,900 Stellar MLS as Distributed by MLS Grid
- 2026-06-02 Price Changed $1,400 TURBOTENANT
- 2026-05-05 Listed for Rent $2,500 TURBOTENANT
- 2025-04-27 Rental Removed $2,500 TURBOTENANT
- 2025-04-07 Listed for Rent $2,500 TURBOTENANT
- 2024-04-13 Rental Removed $2,500 TURBOTENANT
- 2024-04-09 Listed for Rent $2,500 TURBOTENANT
- 2024-02-23 Rental Removed $1,970 TURBOTENANT
- 2024-02-21 Price Changed $1,970 TURBOTENANT
- 2024-02-19 Listed for Rent $1,700 TURBOTENANT
- 2023-11-06 Rental Removed $1,700 TURBOTENANT
- 2023-10-18 Listed for Rent $1,700 TURBOTENANT
- 2023-09-30 Rental Removed — TURBOTENANT
- 2023-08-29 Listed for Rent — TURBOTENANT
- 2023-07-17 Listed $250,000 Stellar MLS as Distributed by MLS Grid
- 2023-01-13 Sold (MLS) $237,000 Stellar MLS as Distributed by MLS Grid
- 2022-10-22 Pending — Stellar MLS as Distributed by MLS Grid
- 2022-07-17 Listed $237,900 Stellar MLS as Distributed by MLS Grid
- 2022-03-11 Listed $160,000 Stellar MLS as Distributed by MLS Grid
- 2022-03-11 Sold (MLS) $160,000 Stellar MLS as Distributed by MLS Grid
- 2009-01-23 Sold (MLS) $25,000 Stellar MLS as Distributed by MLS Grid
- 2008-10-22 Listed $32,900 Stellar MLS as Distributed by MLS Grid
- 2007-05-16 Listed $154,900 Stellar MLS as Distributed by MLS Grid
- 2006-03-10 Listing Removed — Stellar MLS as Distributed by MLS Grid
- 2005-10-28 Listed $169,000 Stellar MLS as Distributed by MLS Grid
- 2004-05-17 Sold (Public Records) $87,000 Public Records
- 2001-04-04 Sold (Public Records) $66,000 Public Records
Property tax history
+7.4%/yrLatest (2025): $1,916 · +4.6% YoY. Source: county tax records.
Cash-flow waterfall
monthlySold comps — $/sqft
last 12 mo · ≤1 miLoading sold comps…