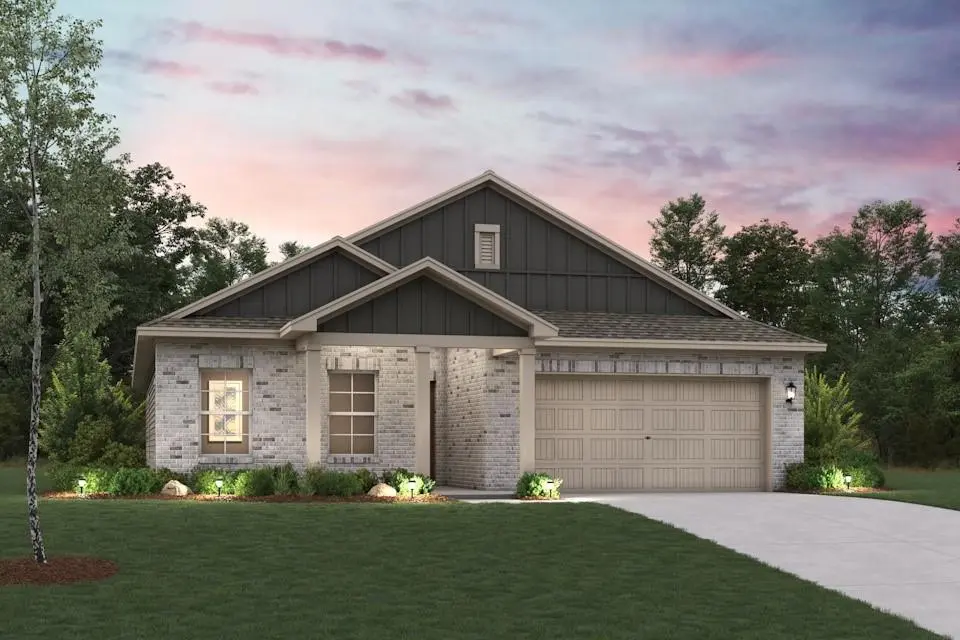
600 Durham Dr · Ferris, TX
Flood risk No data
- FEMA flood zone
- —
- Chance of flooding over 30 yrs
- —
- Est. flood insurance / yr
- —
Fire risk No data
- Est. fire insurance / yr
- —
Heat risk No data
- Hot days now (above threshold)
- —
- Hot days in 30 yrs
- —
Wind risk No data
- Chance of severe wind over 30 yrs
- —
Air-quality risk No data
- Unhealthy air days now
- —
- Unhealthy air days in 30 yrs
- —
Risk factors via First Street. Map © Google.
Why this score? — see what drove the F grade
The composite is a weighted blend of 9 inputs, each scored 0–100. Each bar is that input's sub-score; the figure is the points it added to the 100-point composite (weight × sub-score).
- Cash flow +8.3/30.0
- ARV discount +3.5/15.0
- Livability +3.5/5.0
- Rent growth +2.5/5.0
- Schools +2.5/10.0
- Condition / age +2.5/5.0
- DSCR +2.3/10.0
- 1% rule +1.4/10.0
- Appreciation +0.0/10.0
$339,900
🖨 Deal sheet 📄 Offer letter ✓ Due diligence
Listing remarks MLS
Welcome to the winning Geneva plan! This thoughtfully designed plan opens with a foyer leading past two generous bedrooms flanking a bath. The hall opens up into an airy, sunlit space, showcasing a kitchen, a dining area, and a great room. A large primary suite is adjacent, boasting a walk-in closet and an attached bath with dual sinks and a walk-in shower. Additional home highlights include: Prelude Plus Cool Package with Vista Cabinets * Prices, plans, and terms are effective on the date of publication and subject to change without notice. Square footage/dimensions shown is only an estimate and actual square footage/dimensions will differ. Buyer should rely on his or her own evaluation of usable area. Depictions of homes or other features are artist conceptions. Hardscape, landscape, and other items shown may be decorator suggestions that are not included in the purchase price and availability may vary. No view is promised. Views may also be altered by subsequent development, construction, and landscaping growth. ©2025 Century Communities, Inc
Key facts
- Foyer
- Kitchen
- Walk-in closet
Tags
Property features AI
Finance
- Other: Builder special listing conditions; Possession at closing/funding or upon completion
- HOA & community: Mandatory HOA; Annual HOA fee of $150; HOA covers grounds maintenance and management; HOA managed by Shepherd Place Homes, Inc.; Community features include sidewalks
Exterior
- Parking: Attached 2-car garage with garage door opener, inside entrance and garage facing front; Covered driveway
- Security: Prewired for security; Smoke detectors; Carbon monoxide detectors
- Utilities: City water; City sewer; Concrete curbs and sidewalks; Utilities easement on property
- Home design: Single family residence; One story; New construction (incomplete); Property not attached; Subdivision: Sperling Farms
- Construction: Brick and siding exterior; Composition / shingle roof; Slab foundation; Smart home features enabled
- Exterior features: Covered front porch and covered patio; Private yard; Gutters; Exterior lighting; Wood fenced backyard; Corner lot; Landscaped yard with sprinkler system; Patio
Interior
- Kitchen: Kitchen with island and breakfast bar; Natural stone/granite counters; Built-in cabinets; Pantry / walk-in pantry; Water line to refrigerator; Electric oven; Dishwasher; Disposal
- Bedrooms: 4 bedrooms (all on the main level); Primary bedroom with ensuite bath, dual sinks, linen closet and walk-in closet; Other bedrooms feature split-bedroom layout; one bedroom includes an ensuite bath
- Flooring: Carpet; Ceramic tile; Luxury vinyl plank
- Bathrooms: 3 full bathrooms
- Heating & cooling: Central heating; Central air conditioning; Electric HVAC; Zoned cooling; ENERGY STAR qualified equipment
- Interior features: Open floorplan; Built-in features; Decorative lighting; Double vanity; Eat-in kitchen; Pantry; Walk-in closet(s); Cable TV available; High speed internet available; Smart home system; Room count: 8; One level
- Laundry & utility: Separate utility room; Utility room with full-size washer/dryer area and washer hookup
Neighborhood map
What this means for you Summary
Snapshot
- This is a 4-bed/3.0-bath land listed at $340k.
Deal economics
- At list price, monthly cash flow is $-308 ($-4k/yr) — negative.
- To cash-flow at today's rent, offer at most $285k (16.0% below list).
- To meet the 1% rule (rent ≥ 1% of price), the offer needs to be $216k (36.5% below list).
- Recommended offer: $216k (36.5% below list) — sets the bar for 1% rule.
Location & tenants
- Location reads 69/100 on livability (#401 in TX) — a middle-class / working-renter tenant base. Strengths: employment A+, cost of living A+, housing A+; Watch: crime C-, amenities F, commute F.
- Ferris ISD (rural): math 28% / reading 29% proficiency, ranked #634 of 826 in TX (top 77%) — low school quality limits family demand, transient renter base, plan for 1-2y turnover; 67% free/reduced lunch — lower-income household profile, screen leases tightly.
- Zoned schools: Lucy Mae Mcdonald El (math 40% / reading 33%, grade F, #1,883 of 4,322 statewide, top 44%, 620 students, 83% FRL) — zoned schools average 83% FRL vs 67% district-wide (16 pts higher); higher-poverty schools than district average — tighter screening recommended.
- Market conditions: 124 active listings in the ZIP; 15 comparable units currently listed for rent nearby; rentals at typical pace (median 16d on market — plan ~3-4 weeks tenant-placement turnaround); 3,016 units permitted in Ellis County in 2024 (20 in 5+ unit buildings).
Forward outlook
- Local home prices are declining (-3.0%/yr); year-one equity from $2k of loan paydown is wiped out by about $10k of value loss. Plan a longer hold.
- Ellis County population projected at +36% by 2050 — long-run rental-demand tailwind backs the buy-and-hold thesis.
Negotiation context
- It's been on market 49 days — a 3% lower offer ($330k) is reasonable based on typical stale-listing flexibility.
- 2 sale attempts with the ask held roughly flat each time — persistent listings suggest the price (not the market) is what's stuck; bring a comps-based counter.
Questions for the listing agent
- What do current leases actually rent for vs. the listed asking? Can we see a recent rent roll and the last 12 months of T-12 income?
- It's been on market 49 days. Have you received any prior offers? Is the seller open to a 36% concession, seller financing, or rate buy-down credit?
- What does the HOA fee cover, when was the last increase, and are there any pending special assessments or reserve-fund shortfalls?
- Is there a deadline driving the sale (1031 exchange, divorce, estate, relocation)? That informs how much negotiation room exists.
- Schools are F-rated, which usually means shorter tenancies and higher turnover. Who's the typical renter profile here, and what's been the actual vacancy rate?
- The area grade is low — what's the realistic commute time and amenity access for the typical tenant pool here? Any planned neighborhood developments (good or bad) we should know about?
- What's the average days-on-market for RENTAL listings here right now (not sales)? A rising rental-DOM trend means longer vacancies and softer asking-rent achievability than the comps imply.
- What's the recent tenant-quality profile in this submarket — average credit score on applications, eviction rate, late-payment / NSF rate, and stable-employment percentage? A property-management company in the area should have these aggregated.
- How much new for-sale + rental construction is in the pipeline within 1–3 miles? Heavy new supply typically softens prices + rents 12–24 months out; constrained supply supports both.
Investment metrics
- 1% rule
- 0.64% ✗
- Cap rate
- 5.21%
- Cash-on-cash
- -3.88%
- DSCR
- 0.83
- GRM
- 13.1
CMA / ARV
- ARV (median comp)
- $312,279
- List price
- $339,900
- Delta
- 8.85%
- Verdict
- FAIR
- Comps
- 20 within 1.0 mi
Projected returns pro-forma
-3.0% appreciation · 3.0% rent growth · sell at horizon
- IRR
- -22.9%
- Equity multiple
- 0.21×
- Total profit
- $-74,865
- Equity at exit
- $50,680
- IRR
- -17.5%
- Equity multiple
- 0.04×
- Total profit
- $-91,150
- Equity at exit
- $29,388
Cash invested: $95,172 (down + closing). Projections, not guarantees.
Landlord ↔ Tenant lean methodology
- Overall (STATE)
- 87 Strongly Landlord-Friendly
- State Texas
- 87 Strongly Landlord-Friendly · R+5
- County
- — inherits STATE
- City
- — inherits STATE
ZIP-level market 75125
- Home prices YoY
- -6.4%
- Active inventory
- 124
- Price-to-rent
- 13.1×
Monthly cashflow live
- Estimated rent
- $2,160 high interval (Pro) →
- Mortgage (P&I)
- −$1,782
- Tax from tax record
- −$77 /mo · $924/yr
- Insurance
- −$142
- HOA
- −$13
- Vacancy / Maint / Mgmt
- −$454
- Net cashflow
- $-308
Break-even live
UW: 25.0% down · 7.5% · 30yr · 1.5% tax · 5.0% vac · 8.0% maint · 8.0% mgmt
Financing live
Cash to close
- Down payment
- $84,975
- Closing costs
- $10,197
- Reserves months
- —
- Total cash needed
- —
Loan-product check · same deal, 3 products live
Conventional
25% down · 7.5% · 30yr
- Down + closing
- —
- Monthly P&I
- —
- Monthly cashflow
- —
- DSCR
- —
- Eligible?
- —
Personal DTI + credit; lowest rate.
DSCR
20% down · 8.5% · 30yr
- Down + closing
- —
- Monthly P&I
- —
- Monthly cashflow
- —
- DSCR
- —
- Eligible?
- —
No personal income docs; deal must DSCR.
Hard money
10% down · 12.0% · 12mo
- Down + closing
- —
- Monthly P&I
- —
- Monthly cashflow
- —
- DSCR
- —
- Eligible?
- —
Short-term bridge; refi at stabilization.
Rent comps 15 comps
| Address | Beds | Baths | Sqft | Rent | $/sqft | DOM | Units | Dist |
|---|---|---|---|---|---|---|---|---|
| 485 Norfolk Dr Ferris, TX | 4.0 | 2.0 | 1773 | $2,275 | $1.28 | 20d | 1 | 0.20mi |
| 111 S Wood St Unit B Ferris, TX | 3.0 | 2.0 | 2200 | $1,700 | $0.77 | 43d | 1 | 0.28mi |
| 100 Clark Dr Ferris, TX | 3.0 | 2.0 | 1810 | $2,025 | $1.12 | 5d | 1 | 0.62mi |
| 860 Newport Dr Ferris, TX | 4.0 | 3.0 | 2082 | $2,395 | $1.15 | 1d | 1 | 0.64mi |
| 704 N Church St Ferris, TX | 3.0 | 2.0 | 1480 | $2,300 | $1.55 | 7d | 1 | 0.73mi |
| 215 Clark Dr Ferris, TX | 4.0 | 2.0 | 1695 | $2,100 | $1.24 | 22d | 1 | 0.76mi |
| 309 Jennie Marie Cir Ferris, TX | 3.0 | 2.0 | 1775 | $1,999 | $1.13 | 43d | 1 | 0.79mi |
| 309 Jennie Marie Cir Ferris, TX | 3.0 | 2.0 | 1775 | $1,999 | $1.13 | 15d | 1 | 0.79mi |
| 308 Micah Ln Ferris, TX | 4.0 | 2.5 | 2588 | $2,325 | $0.90 | 1d | 1 | 0.86mi |
| 808 Clark Dr Ferris, TX | 4.0 | 2.5 | 2153 | $2,379 | $1.10 | 24d | 1 | 0.91mi |
| 833 Serena Dr Ferris, TX | 4.0 | 2.0 | 1822 | $2,500 | $1.37 | 1d | 1 | 0.93mi |
| 841 Serena Dr Ferris, TX | 4.0 | 2.5 | 2153 | $2,395 | $1.11 | 1d | 1 | 0.95mi |
| 206 S Meadow Dr Ferris, TX | 3.0 | 2.0 | 2206 | $8,950 | $4.06 | 22d | 1 | 0.96mi |
| 206 S Meadow Dr Unit 1520042P Ferris, TX | 3.0 | 2.0 | 2195 | $12,712 | $5.79 | 22d | 1 | 0.96mi |
| 2750 Nolan Rd Lancaster, TX | 4.0 | 2.0 | 1795 | $2,500 | $1.39 | 1d | 1 | 1.47mi |
HOA detail
- Monthly dues
- $13 · $156/yr
- Likely covers
- landscaping
Listing history 15 events
-
2026-06-18days on market $339,900 Active 49 DOM
-
2026-06-17days on market $339,900 Active 48 DOM
-
2026-06-16days on market $339,900 Active 47 DOM
-
2026-06-15days on market $339,900 Active 46 DOM
-
2026-06-13days on market $339,900 Active 44 DOM
-
2026-06-09days on market $339,900 Active 40 DOM
-
2026-06-08days on market $339,900 Active 39 DOM
-
2026-06-07days on market $339,900 Active 38 DOM
-
2026-06-04days on market $339,900 Active 35 DOM
-
2026-06-03days on market $339,900 Active 34 DOM
-
2026-06-02days on market $339,900 Active 33 DOM
-
2026-06-01days on market $339,900 Active 32 DOM
-
2026-05-31days on market $339,900 Active 31 DOM
-
2026-04-30$339,900 Active 732-char remark
-
2026-04-29$339,900 Active 984-char remark
Show marketing remark (1067 chars)
Welcome to the winning Geneva plan! This thoughtfully designed plan opens with a foyer leading past two generous bedrooms flanking a bath. The hall opens up into an airy, sunlit space, showcasing a kitchen, a dining area, and a great room. A large primary suite is adjacent, boasting a walk-in closet and an attached bath with dual sinks and a walk-in shower. Additional home highlights include: Prelude Plus Cool Package with Vista Cabinets * Prices, plans, and terms are effective on the date of publication and subject to change without notice. Square footage/dimensions shown is only an estimate and actual square footage/dimensions will differ. Buyer should rely on his or her own evaluation of usable area. Depictions of homes or other features are artist conceptions. Hardscape, landscape, and other items shown may be decorator suggestions that are not included in the purchase price and availability may vary. No view is promised. Views may also be altered by subsequent development, construction, and landscaping growth. ©2025 Century Communities, Inc
ⓘ Source: listings_history table (triggers on properties + properties_extension) + one-shot
backfill from property_details.listing_events for pre-trigger history.
Tax reassessment forecast TX · Resets to sale price
- Current annual tax
- $924 · $77/mo
- Projected year-2 tax
- $6,220 · $518/mo
- Expected delta
- +$5,296/yr (+$441/mo · 573.3%)
ⓘ Screening estimate from a state-policy table — verify with the county assessor before closing.
Nearby sold comps map
Loading sold comps map…
Walkable amenities ~0.75 mi
Loading nearby amenities…
Taxation est. · year 1
- Rental income
- $25,916
- − Mortgage interest
- −$19,040
- − Property taxes
- −$924
- − Insurance
- −$1,700
- − Repairs & maintenance
- −$2,073
- − Management
- −$2,073
- − HOA
- −$156
- − Depreciation
- −$9,888
- Taxable loss
- −$9,938
- Est. tax savings @ 24.0%
- +$2,385
- After-tax cash flow
- $-1,310/yr
For passive investors: Depreciation is non-cash, so a rental often shows a tax loss while cash-flowing — sheltering income. Rental losses are passive: they offset passive income freely, and up to $25,000/yr can offset ordinary (W-2) income if you actively participate and your MAGI is under $100k (phasing out to $0 by $150k); unused losses carry forward. On sale, claimed depreciation is recaptured at up to 25%, and gains may owe capital-gains tax (a 1031 exchange can defer both). Figures are a year-1 estimate at your 24.0% rate — not tax advice; consult a CPA.
Schools (NCES district)
- District
- Ferris ISD
- NCES district ID
- 4819170
- Math proficiency
- 28% ▼ -9.00%
- Reading proficiency
- 29% ▼ -3.00%
- Median HH income
- $53,468
- Composite
- 25.3/100
- National rank
- #7486
- State rank
- #634 of 826 in TX
Livability — Ferris
- Score
- 69/100
- State rank
- #401
- US rank
- #8294
Category grades
Schools grade is shown separately in the Schools card above.
Census & demographics
- Census place
- Ferris, TX
- Population (ZIP)
- 7,154
Population outlook (Ellis County) Hauer SSP2
- Today (2025)
- 194,556 people
- By 2030
- 209,679 · +7.8%
- By 2040
- 238,837 · +22.8%
- By 2050
- 265,451 · +36.4%
- By 2075
- 326,571 · +67.9%
- By 2100
- 362,156 · +86.1%
Race, ethnicity, and origin ACS 2023
- Neighborhood character
- Diverse neighborhood (Simpson 0.57)
- Race & ethnicity
- Hispanic / Latino 57% White 32% Two or more races 25% Black 10% Native American 3%
- Hispanic origin (detail)
- Mexican 54%
- Common ancestry
- Iranian 1% Slovak 1% Lithuanian 0%
- Foreign-born
- 9% · Canada
- Languages at home
- 57% English-only · Spanish 42%
Political lean MEDSL · Ellis
- 2024 margin
- Solid R (+31.1) · D 34.0% · R 65.1%
- 2008→2024 swing
- +11.2pp toward D · 2008: -42.2pp · 2024: -31.1pp
- All cycles
- 2024: R+31.1 2020: R+34.1 2016: R+45.4 2012: R+47.5 2008: R+42.2
Not yet ingested
- Civics
- —
Market trends
- HPI YoY
- ▼ -16.54%
- Current HPI
- 243.4525
- Rent YoY
- —
- Metro
- —
- State GDP YoY
- ▲ 3.95%
- F500 in state
- 110
Industry mix (Fortune 500 HQ in TX)
| Industry | F500 HQs | Revenue |
|---|---|---|
| Energy | 16 | $1,198B |
|
||
| Technology | 5 | $198B |
|
||
| Engineering / Construction | 4 | $72B |
|
||
| Energy Services | 3 | $60B |
|
||
| Utilities | 3 | $41B |
|
||
| Healthcare | 2 | $330B |
|
||
Price history
+0.0% since first listed2 events — show timeline
- 2026-04-30 Listed $339,900 NTREIS
- 2026-04-29 Listed $339,900 Zillow
Cash-flow waterfall
monthlySold comps — $/sqft
last 12 mo · ≤1 miLoading sold comps…