14428 County Route 5 · Depauville, NY
Flood risk 1/10 · Minimal
- FEMA flood zone
- X
- Chance of flooding over 30 yrs
- 0.0%
- Est. flood insurance / yr
- $473 – $860
Fire risk 3/10 · Minor
- Est. fire insurance / yr
- $691 – $1,283
Heat risk 2/10 · Minimal
- Hot days now (above 92°F)
- 7 days/yr
- Hot days in 30 yrs
- 15 days/yr
Wind risk 1/10 · Minimal
- Chance of severe wind over 30 yrs
- 1.0%
Air-quality risk 2/10 · Minimal
- Unhealthy air days now
- 1 days/yr
- Unhealthy air days in 30 yrs
- 1 days/yr
Risk factors via First Street. Map © Google.
Why this score? — see what drove the B+ grade
The composite is a weighted blend of 9 inputs, each scored 0–100. Each bar is that input's sub-score; the figure is the points it added to the 100-point composite (weight × sub-score).
- Cash flow +30.0/30.0
- 1% rule +10.0/10.0
- DSCR +10.0/10.0
- Appreciation +9.7/10.0
- ARV discount +7.5/15.0
- Schools +5.0/10.0
- Livability +2.7/5.0
- Rent growth +2.5/5.0
- Condition / age +2.5/5.0
$89,000
🖨 Deal sheet 📄 Offer letter ✓ Due diligence
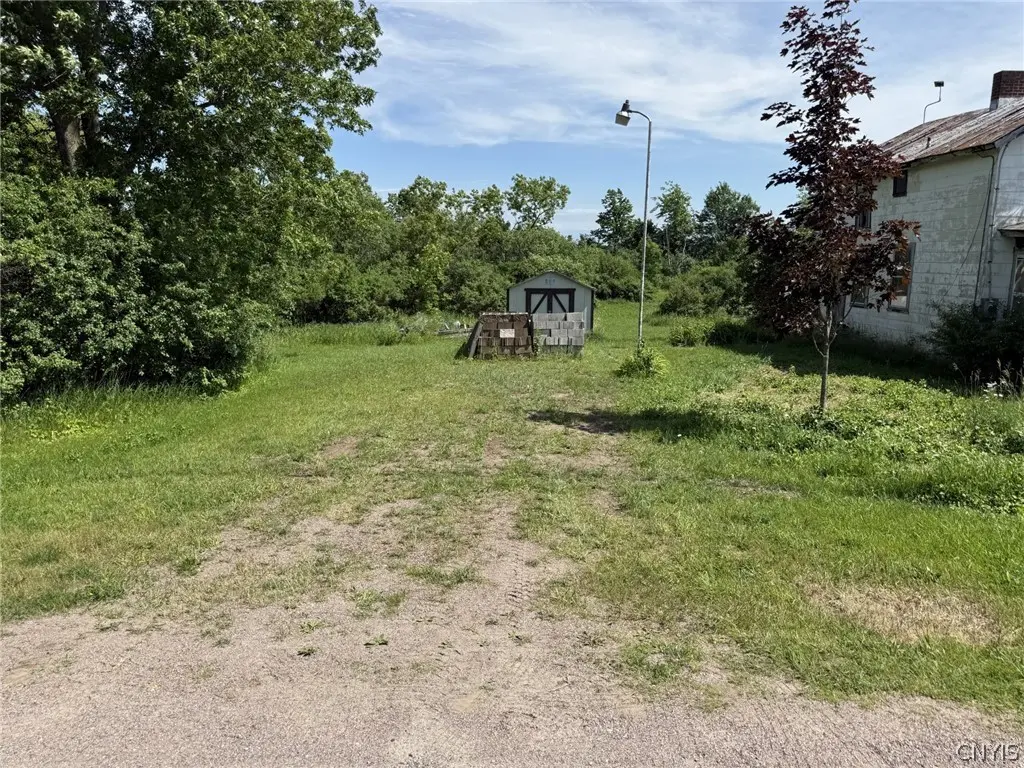
Listing remarks
Large 2.6 acre building lot with 263' of year round maintained frontage. There is existing building on site. The seller has never lived in the property. There is a dug well also on the property that has never been used. This property is ideally located minutes to Clayton N Y. Great location for that new build or the dwelling of your choice.
Key facts
- Dug well
- 2.6 acre lot
- Built 1920
Tags
Property features AI
Finance
- Other: Lot is approximately 2.6 acres (dimensions ~263 x 397); Lot is rectangular, level, partially wooded; Road frontage on a county road
Exterior
- Parking: Driveway parking
- Utilities: Electricity available; Cable available; High-speed internet available; Phone available; Well water needed / not connected; Septic required
- Home design: Two-story property; Raw land / possible use for single family or mobile home; Facing direction not specified
- Construction: Property listed as fixer; No year built provided
- Exterior features: Gravel driveway; Storage shed(s)
Interior
- Bathrooms: 1 full bathroom
- Interior features: Fixer condition
Neighborhood map
What this means for you Summary
Snapshot
- This is a 3-bed/1.0-bath single-family listed at $89k.
Deal economics
- At list price, monthly cash flow is $492 ($6k/yr) — positive.
- The deal already cash-flows at list — no discount required.
- Meets the 1% rule at list price ($1k rent vs $89k).
Location & tenants
- Location reads 54/100 on livability (#1,147 in NY) — a working-class tenant base; expect higher turnover. Strengths: employment A+, crime A; Watch: health & safety D, schools F, amenities F.
- Thousand Islands Central School District (rural): math 60% / reading 56% proficiency, ranked #262 of 590 in NY (top 44%) — acceptable for families but not a draw, mixed tenant base, ~2y average lease.
- Market conditions: 55 active listings in the ZIP; 196 units permitted in Jefferson County in 2024 (0 in 5+ unit buildings).
Forward outlook
- In year one you build about $9k of equity ($615 loan paydown + $8k appreciation (9.4% local appreciation)).
- Jefferson County population projected at -12% by 2050 — secular population decline; favor cash flow + early exit over multi-decade hold.
- At projected returns (9.4% appreciation + 3.0% rent growth), your $25k cash investment doubles in ~2 years — after that, you're playing with house money.
- By year 4, paydown + projected appreciation supports a ~$32k cash-out refi (75% LTV) — recoverable capital for the next deal without selling this one.
Negotiation context
- Only 7 days on market — expect competitive offers; lowballing is unlikely to land.
Risks & watch-outs
- Watch-outs: built in 1920 — expect roof / HVAC / electrical / plumbing capex.
Questions for the listing agent
- Built in 1920 — when were the roof, HVAC, electrical panel, plumbing, and water heater last replaced?
- Is there a deadline driving the sale (1031 exchange, divorce, estate, relocation)? That informs how much negotiation room exists.
- Schools are F-rated, which usually means shorter tenancies and higher turnover. Who's the typical renter profile here, and what's been the actual vacancy rate?
- What's the average days-on-market for RENTAL listings here right now (not sales)? A rising rental-DOM trend means longer vacancies and softer asking-rent achievability than the comps imply.
- What's the recent tenant-quality profile in this submarket — average credit score on applications, eviction rate, late-payment / NSF rate, and stable-employment percentage? A property-management company in the area should have these aggregated.
- How much new for-sale + rental construction is in the pipeline within 1–3 miles? Heavy new supply typically softens prices + rents 12–24 months out; constrained supply supports both.
Investment metrics
- 1% rule
- 1.50% ✓
- Cap rate
- 12.92%
- Cash-on-cash
- 23.67%
- DSCR
- 2.05
- GRM
- 5.6
CMA / ARV
No comps found within radius.
Projected returns pro-forma
9.39% appreciation · 3.0% rent growth · sell at horizon
- IRR
- 41.0%
- Equity multiple
- 4.05×
- Total profit
- $76,061
- Equity at exit
- $76,238
- IRR
- 35.8%
- Equity multiple
- 8.96×
- Total profit
- $198,483
- Equity at exit
- $160,389
Cash invested: $24,920 (down + closing). Projections, not guarantees.
Landlord ↔ Tenant lean methodology
- Overall (STATE)
- 15 Strongly Tenant-Friendly
- State New York
- 15 Strongly Tenant-Friendly · D+10
- County
- — inherits STATE
- City
- — inherits STATE
ZIP-level market 13624
- Home prices YoY
- 2.3%
- Active inventory
- 55
- Price-to-rent
- 5.6×
Monthly cashflow live
- Estimated rent
- $1,332 medium interval (Pro) →
- Mortgage (P&I)
- −$467
- Tax from tax record
- −$57 /mo · $684/yr
- Insurance
- −$37
- HOA
- −$0
- Vacancy / Maint / Mgmt
- −$280
- Net cashflow
- $492
Break-even live
UW: 25.0% down · 7.5% · 30yr · 1.5% tax · 5.0% vac · 8.0% maint · 8.0% mgmt
Financing live
Cash to close
- Down payment
- $22,250
- Closing costs
- $2,670
- Reserves months
- —
- Total cash needed
- —
Loan-product check · same deal, 3 products live
Conventional
25% down · 7.5% · 30yr
- Down + closing
- —
- Monthly P&I
- —
- Monthly cashflow
- —
- DSCR
- —
- Eligible?
- —
Personal DTI + credit; lowest rate.
DSCR
20% down · 8.5% · 30yr
- Down + closing
- —
- Monthly P&I
- —
- Monthly cashflow
- —
- DSCR
- —
- Eligible?
- —
No personal income docs; deal must DSCR.
Hard money
10% down · 12.0% · 12mo
- Down + closing
- —
- Monthly P&I
- —
- Monthly cashflow
- —
- DSCR
- —
- Eligible?
- —
Short-term bridge; refi at stabilization.
Listing history 7 events
-
2026-06-19days on market $89,000 Active 7 DOM
-
2026-06-18days on market $89,000 Active 6 DOM
-
2026-06-17days on market $89,000 Active 5 DOM
-
2026-06-16days on market $89,000 Active 4 DOM
-
2026-06-15days on market $89,000 Active 3 DOM
-
2026-06-13remarks 343-char remark
-
2026-06-13$89,000 Active 1 DOM
ⓘ Source: listings_history table (triggers on properties + properties_extension) + one-shot
backfill from property_details.listing_events for pre-trigger history.
Tax reassessment forecast NY · Partial reset (capped growth)
- Current annual tax
- $684 · $57/mo
- Projected year-2 tax
- $1,094 · $91/mo
- Expected delta
- +$410/yr (+$34/mo · 60.0%)
ⓘ Screening estimate from a state-policy table — verify with the county assessor before closing.
Climate risk First Street
- Flood 1/10 Low FEMA zone X · 0% chance over 30 yrs
- Wildfire 3/10 Moderate
- Heat 2/10 Low 7 d/yr ≥92°F today · 15 d/yr by 30 yrs out
- Wind 1/10 Low 100% chance of damaging wind over 30 yrs
- Air quality 2/10 Low 1 unhealthy d/yr today · 1 by 30 yrs out
Nearby sold comps map
Loading sold comps map…
Walkable amenities ~0.75 mi
Loading nearby amenities…
Taxation est. · year 1
- Rental income
- $15,985
- − Mortgage interest
- −$4,985
- − Property taxes
- −$684
- − Insurance
- −$445
- − Repairs & maintenance
- −$1,279
- − Management
- −$1,279
- − Depreciation
- −$2,589
- Taxable income
- $4,724
- Est. tax owed @ 24.0%
- −$1,134
- After-tax cash flow
- $4,765/yr
For passive investors: Depreciation is non-cash, so a rental often shows a tax loss while cash-flowing — sheltering income. Rental losses are passive: they offset passive income freely, and up to $25,000/yr can offset ordinary (W-2) income if you actively participate and your MAGI is under $100k (phasing out to $0 by $150k); unused losses carry forward. On sale, claimed depreciation is recaptured at up to 25%, and gains may owe capital-gains tax (a 1031 exchange can defer both). Figures are a year-1 estimate at your 24.0% rate — not tax advice; consult a CPA.
Schools (NCES district)
- District
- Thousand Islands Central School District
- NCES district ID
- 3607650
- Math proficiency
- 60% ▼ -2.00%
- Reading proficiency
- 56% ▼ -2.00%
- Median HH income
- $55,233
- Composite
- 49.94/100
- National rank
- #1930
- State rank
- #262 of 590 in NY
Livability — Depauville
- Score
- 54/100
- State rank
- #1147
- US rank
- #23925
Category grades
Schools grade is shown separately in the Schools card above.
Census & demographics
- City population
- 128
- Population (ZIP)
- 4,438
Population outlook (Jefferson County) Hauer SSP2
- Today (2025)
- 111,748 people
- By 2030
- 109,370 · -2.1%
- By 2040
- 103,828 · -7.1%
- By 2050
- 98,523 · -11.8%
- By 2075
- 91,422 · -18.2%
- By 2100
- 78,214 · -30.0%
Race, ethnicity, and origin ACS 2023
- Neighborhood character
- Predominantly White (86%)
- Race & ethnicity
- White 86% Black 6% Hispanic / Latino 4% Two or more races 3%
- Common ancestry
- Lithuanian 9% Romanian 5% Slovak 3%
- Foreign-born
- 4% · Canada, China
- Languages at home
- 94% English-only · Spanish 3% Other Indo-European 2% French/Haitian/Cajun 1%
Political lean MEDSL · Jefferson
- 2024 margin
- Strong R (+23.6) · D 38.2% · R 61.8%
- 2008→2024 swing
- -18.3pp toward R · 2008: -5.3pp · 2024: -23.6pp
- All cycles
- 2024: R+23.6 2020: R+19.0 2016: R+22.4 2012: R+2.9 2008: R+5.3
Not yet ingested
- Civics
- —
Market trends
- HPI YoY
- ▲ 9.39%
- Current HPI
- 418.5008
- Rent YoY
- —
- Metro
- —
- State GDP YoY
- ▲ 2.60%
- F500 in state
- 92
Industry mix (Fortune 500 HQ in NY)
| Industry | F500 HQs | Revenue |
|---|---|---|
| Financial Services | 10 | $950B |
|
||
| Consumer Goods | 9 | $162B |
|
||
| Insurance | 4 | $225B |
|
||
| Telecommunications | 2 | $144B |
|
||
| Pharmaceuticals | 2 | $112B |
|
||
| Media / Entertainment | 2 | $69B |
|
||
Price history
1 event — show timeline
- 2026-06-12 Listed $89,000 CNYIS
Property tax history
+1.4%/yrLatest (2025): $684 · -2.6% YoY. Source: county tax records.
Cash-flow waterfall
monthlySold comps — $/sqft
last 12 mo · ≤1 miLoading sold comps…