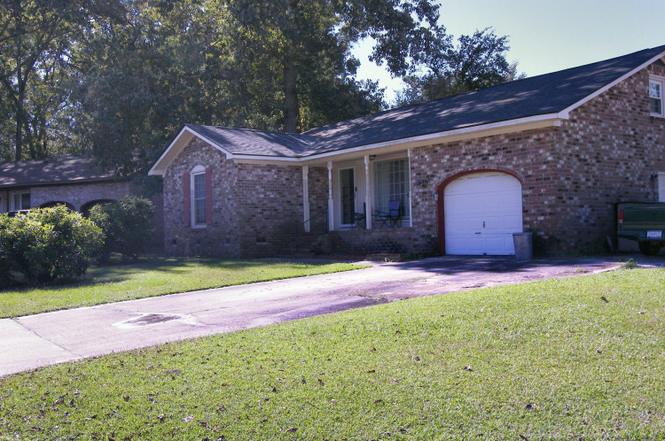
9 Pequannock Rd · Goose Creek, SC
Flood risk 1/10 · Minimal
- FEMA flood zone
- X (unshaded)
- Chance of flooding over 30 yrs
- 0.0%
- Est. flood insurance / yr
- $507 – $1,088
Fire risk 4/10 · Minor
- Est. fire insurance / yr
- $783 – $1,453
Heat risk 9/10 · Severe
- Hot days now (above 107°F)
- 7 days/yr
- Hot days in 30 yrs
- 17 days/yr
Wind risk 8/10 · Major
- Chance of severe wind over 30 yrs
- 98.0%
Air-quality risk 2/10 · Minimal
- Unhealthy air days now
- 2 days/yr
- Unhealthy air days in 30 yrs
- 2 days/yr
Risk factors via First Street. Map © Google.
Why this score? — see what drove the D+ grade
The composite is a weighted blend of 9 inputs, each scored 0–100. Each bar is that input's sub-score; the figure is the points it added to the 100-point composite (weight × sub-score).
- Cash flow +14.6/30.0
- ARV discount +10.8/15.0
- DSCR +4.4/10.0
- Rent growth +3.6/5.0
- Schools +3.6/10.0
- Livability +3.4/5.0
- 1% rule +2.7/10.0
- Condition / age +2.5/5.0
- Appreciation +0.0/10.0
$275,000
🖨 Deal sheet (PDF) 📄 Offer letter ✓ Due diligence
Listing remarks
This Ranch style home is on a high Corner lot, with Full masonry fireplace. 3 bedrooms and 2 full bathrooms with sunken Great Room. Master bedroom has walk-in bathtub and the interior has been patched and painted, kitchen cabinets have been refinished. Entry locks are Schlage with keypad for security. Come see this sparkling home. .
Key facts
- Masonry fireplace
- Corner lot
- Sunken great room
Tags
Property features AI
Finance
- HOA & community: Community trash service
Exterior
- Parking: Attached 1-car garage; Off-street parking; Garage door opener
- Utilities: Public sewer; BCW & SA utility service; Berkeley Electric Co-op power
- Home design: Single-family detached home; One story
- Construction: Fiberglass roof; Fee simple ownership
- Exterior features: Chain link fencing; 0–0.5 acre lot, high elevation
Interior
- Kitchen: Dishwasher; Electric range; Refrigerator
- Bedrooms: 3 bedrooms, primary bedroom on lower level
- Flooring: Carpet
- Bathrooms: 2 bathrooms
- Heating & cooling: Central heating (forced air, electric); Central air conditioning
- Interior features: Ceiling - blown insulation; Unfinished attached FROG (future room over garage); Separate dining area; Great room
Neighborhood map
What this means for you Summary
Snapshot
- This is a 3-bed/2.0-bath single-family listed at $275k.
Deal economics
- At list price, monthly cash flow is $64 ($771/yr) — positive.
- The deal already cash-flows at list — no discount required.
- To meet the 1% rule (rent ≥ 1% of price), the offer needs to be $211k (23.2% below list).
- Recommended offer: $211k (23.2% below list) — sets the bar for 1% rule.
- Cap rate 6.6% vs local median 4.0% in Goose Creek — top-decile yield for the area; either an underpriced asset or a hidden risk that comps aren't pricing in. Stress-test before assuming the spread holds.
Location & tenants
- Location reads 67/100 on livability (#103 in SC) — a middle-class / working-renter tenant base. Strengths: housing A+, employment A, cost of living B+; Watch: amenities F, commute F, health & safety F.
- Berkeley 01 (suburban): math 35% / reading 48% proficiency, ranked #30 of 80 in SC (top 38%) — families likely to look elsewhere, expect single-tenant / working-renter base with shorter leases.
- Zoned schools: Goose Creek Elementary (math 12% / reading 21%, grade F, #535 of 597 statewide, top 90%, 945 students, 100% FRL); Sedgefield Middle (math 13% / reading 26%, grade F, #182 of 229 statewide, top 80%, 986 students, 100% FRL); Goose Creek High (math 33% / reading 68%, grade D+, #150 of 196 statewide, top 76%, 1,981 students, 52% FRL) — zoned schools average 84% FRL vs 48% district-wide (36 pts higher); higher-poverty schools than district average — tighter screening recommended.
- Zoned-school proficiency averages 29% at this address vs 42% district-wide (-13 pts) — the specific schools serving this property underperform the Berkeley 01 average; the district grade overstates school quality for this exact location.
- Market conditions: Rents rising fast (+4.5%/yr); 266 active listings in the ZIP; 12 comparable units currently listed for rent nearby; rentals at typical pace (median 25d on market — plan ~3-4 weeks tenant-placement turnaround); solid renter incomes; 3,183 units permitted in Berkeley County in 2024 (580 in 5+ unit buildings).
- This rent runs 31% of the median local income ($82k/yr) — at the standard rent-burdened threshold; future hikes will face affordability resistance.
Forward outlook
- Local home prices are declining (-3.0%/yr); year-one equity from $2k of loan paydown is wiped out by about $8k of value loss. Plan a longer hold.
- Berkeley County population projected at +48% by 2050 — long-run rental-demand tailwind backs the buy-and-hold thesis.
Negotiation context
- It's been on market 251 days — a 12% lower offer ($242k) is reasonable based on typical stale-listing flexibility.
- 2 sale attempts; this cycle's ask has dropped $15k (5%) from the opening price — seller is motivated, your offer sets the floor, not the list.
Risks & watch-outs
- Climate carrying-cost: severe wind risk, 98% chance of damaging wind over 30y; extreme-heat days projected 7→17/yr by 2055 (HVAC capex compounding) — expect insurance premiums to compound above CPI over the hold.
Questions for the listing agent
- It's been on market 251 days. Have you received any prior offers? Is the seller open to a 23% concession, seller financing, or rate buy-down credit?
- Built in 1970 — when were the roof, HVAC, electrical panel, plumbing, and water heater last replaced?
- Why hasn't it sold? Are there any deal-killer items the seller is aware of (foundation, flood, title, zoning, code violations)?
- Is there a deadline driving the sale (1031 exchange, divorce, estate, relocation)? That informs how much negotiation room exists.
- The area grade is low — what's the realistic commute time and amenity access for the typical tenant pool here? Any planned neighborhood developments (good or bad) we should know about?
- What's the average days-on-market for RENTAL listings here right now (not sales)? A rising rental-DOM trend means longer vacancies and softer asking-rent achievability than the comps imply.
- What's the recent tenant-quality profile in this submarket — average credit score on applications, eviction rate, late-payment / NSF rate, and stable-employment percentage? A property-management company in the area should have these aggregated.
- How much new for-sale + rental construction is in the pipeline within 1–3 miles? Heavy new supply typically softens prices + rents 12–24 months out; constrained supply supports both.
Investment metrics
- 1% rule
- 0.77% ✗
- Cap rate
- 6.57%
- Cash-on-cash
- 1.00%
- DSCR
- 1.04
- GRM
- 10.9
CMA / ARV
- ARV (on-the-fly)
- $296,608
- Comps found
- 12
Show comp detail 12 sales within ~0.75 mi
| Address | Dist | Beds/Ba | Sqft | Sold | Price | $/sf | Match |
|---|---|---|---|---|---|---|---|
| 25 Delaware Rd | 0.21mi | 3/2.0 | 1,218 (+2%) | 6mo | $295,000 | $242 | 82 |
| 30 Bonnie Burn Rd Rd | 0.24mi | 3/2.0 | 1,250 (+4%) | 2mo | $330,000 | $264 | 80 |
| 18 Rumson Rd | 0.25mi | 3/2.0 | 1,188 (-1%) | 10mo | $290,000 | $244 | 79 |
| 37 Delaware Rd | 0.27mi | 3/2.0 | 1,145 (-4%) | 8mo | $279,000 | $244 | 74 |
| 33 Oak Grove Rd | 0.24mi | 3/2.0 | 1,256 (+5%) | 10mo | $325,000 | $259 | 72 |
| 31 Delaware Rd | 0.24mi | 3/2.0 | 1,120 (-6%) | 8mo | $266,000 | $238 | 72 |
| 166 Charles B Gibson Ave | 0.64mi | 3/2.0 | 1,120 (-6%) | 4mo | $290,000 | $259 | 57 |
| 123 Millburn Ave | 0.61mi | 3/2.0 | 1,092 (-9%) | 3mo | $287,000 | $263 | 54 |
| 114 Rahway Rd | 0.63mi | 4/1.5 (+1) | 1,125 (-6%) | 2mo | $215,000 | $191 | 52 |
| 109 Rahway Rd | 0.69mi | 2/1.5 (-1) | 1,178 (-2%) | 11mo | $262,000 | $222 | 50 |
| 113 Millburn Ave | 0.60mi | 3/1.0 | 1,064 (-11%) | 0mo | $274,500 | $258 | 49 |
| 346 Briarbend Rd | 0.61mi | 3/2.5 | 1,328 (+11%) | 8mo | $329,000 | $248 | 45 |
Match score weights: distance 35% · size 25% · config 20% · recency 20%. Top-matched comps best support the ARV.
Projected returns pro-forma
-3.0% appreciation · 4.52% rent growth · sell at horizon
- IRR
- -13.3%
- Equity multiple
- 0.52×
- Total profit
- $-37,343
- Equity at exit
- $41,003
- IRR
- -2.6%
- Equity multiple
- 0.82×
- Total profit
- $-13,987
- Equity at exit
- $23,777
Cash invested: $77,000 (down + closing). Projections, not guarantees.
Landlord ↔ Tenant lean methodology
- Overall (STATE)
- 90 Strongly Landlord-Friendly
- State South Carolina
- 90 Strongly Landlord-Friendly · R+6
- County
- — inherits STATE
- City
- — inherits STATE
ZIP-level market 29445
- Home prices YoY
- -18.0%
- Rents YoY
- 4.5%
- Active inventory
- 266
- Price-to-rent
- 10.9×
Monthly cashflow live
- Estimated rent
- $2,111 high interval (Pro) →
- Mortgage (P&I)
- −$1,442
- Tax from tax record
- −$47 /mo · $562/yr
- Insurance
- −$115
- HOA
- −$0
- Vacancy / Maint / Mgmt
- −$443
- Net cashflow
- $64
Break-even live
Sensitivity live
| Price | -10% $220 | -5% $142 | +0% $64 | +5% $-328 | +10% $-423 |
|---|---|---|---|---|---|
| Rent | -10% $-103 | -5% $-19 | +0% $64 | +5% $148 | +10% $231 |
| Rate | -1.0pp $203 | -0.5pp $134 | base $64 | +0.5pp $-7 | +1.0pp $-80 |
UW: 25.0% down · 7.5% · 30yr · 1.5% tax · 5.0% vac · 8.0% maint · 8.0% mgmt
Financing live
Cash to close
- Down payment
- $68,750
- Closing costs
- $8,250
- Reserves months
- —
- Total cash needed
- —
Loan-product check · same deal, 3 products live
Conventional
25% down · 7.5% · 30yr
- Down + closing
- —
- Monthly P&I
- —
- Monthly cashflow
- —
- DSCR
- —
- Eligible?
- —
Personal DTI + credit; lowest rate.
DSCR
20% down · 8.5% · 30yr
- Down + closing
- —
- Monthly P&I
- —
- Monthly cashflow
- —
- DSCR
- —
- Eligible?
- —
No personal income docs; deal must DSCR.
Hard money
10% down · 12.0% · 12mo
- Down + closing
- —
- Monthly P&I
- —
- Monthly cashflow
- —
- DSCR
- —
- Eligible?
- —
Short-term bridge; refi at stabilization.
Rent comps 12 comps
| Address | Beds | Baths | Sqft | Rent | $/sqft | DOM | Units | Dist |
|---|---|---|---|---|---|---|---|---|
| 147 Pinewind Way Goose Creek, SC | 2.0–3.0 | 2.0–2.5 | 1336 | $2,345 | $1.76 | 13d | 1 | 0.62mi |
| 222 Maypop Dr Goose Creek, SC | 3.0 | 2.5 | 1320 | $1,950 | $1.48 | 25d | 1 | 0.64mi |
| 163 Woodward Rd Goose Creek, SC | 3.0 | 3.0 | 1475 | $2,300 | $1.56 | 25d | 1 | 0.78mi |
| 285 Brookshire Rd Goose Creek, SC | 3.0 | 3.0 | 1450 | $1,900 | $1.31 | 25d | 1 | 0.99mi |
| 285 Brookshire Rd Goose Creek, SC | 3.0 | 3.0 | 1450 | $1,900 | $1.31 | 23d | 1 | 0.99mi |
| 484 Truman Dr Goose Creek, SC | 3.0 | 2.5 | 1320 | $1,950 | $1.48 | 5d | 1 | 1.24mi |
| 467 Truman Dr Goose Creek, SC | 4.0 | 3.5 | 1421 | $2,200 | $1.55 | 5d | 1 | 1.26mi |
| 205 Jackson St Goose Creek, SC | 2.0 | 2.5 | 1468 | $1,850 | $1.26 | 25d | 1 | 1.31mi |
| 150 Keenan Ave Goose Creek, SC | 3.0 | 1.5 | 1030 | $1,831 | $1.78 | 13d | 1 | 1.37mi |
| 169 Pine Shadow Dr Goose Creek, SC | 3.0 | 2.5 | 1200 | $1,800 | $1.50 | 25d | 1 | 1.42mi |
| 120 S Cranford Rd Goose Creek, SC | 2.0 | 1.5–2.0 | 1059 | $1,610 | $1.52 | 4d | 6 | 1.43mi |
| 114 Old Back River Rd Goose Creek, SC | 4.0 | 2.0 | 1300 | $2,400 | $1.85 | 25d | 1 | 1.50mi |
Listing history 22 events
-
2026-06-21days on market $275,000 Active 251 DOM
-
2026-06-18days on market $275,000 Active 248 DOM
-
2026-06-17days on market $275,000 Active 247 DOM
-
2026-06-16days on market $275,000 Active 246 DOM
-
2026-06-15days on market $275,000 Active 245 DOM
-
2026-06-13days on market $275,000 Active 243 DOM
-
2026-06-13days on market $275,000 Active 242 DOM
-
2026-06-10days on market $275,000 Active 240 DOM
-
2026-06-09days on market $275,000 Active 239 DOM
-
2026-06-08days on market $275,000 Active 238 DOM
-
2026-06-07days on market $275,000 Active 237 DOM
-
2026-06-05days on market $275,000 Active 234 DOM
-
2026-06-03days on market $275,000 Active 233 DOM
-
2026-06-03days on market $275,000 Active 232 DOM
-
2026-06-01days on market $275,000 Active 231 DOM
-
2026-05-31days on market $275,000 Active 230 DOM
-
2026-05-22status Active
-
2026-05-06historical Active Under Contract
-
2026-04-21price $275,000
-
2026-03-23price $279,900
-
2026-03-10price $284,900
-
2025-10-10$289,900 Active
ⓘ Source: listings_history table (triggers on properties + properties_extension) + one-shot
backfill from property_details.listing_events for pre-trigger history.
Tax reassessment forecast SC · Resets to sale price
- Current annual tax
- $562 · $47/mo
- Projected year-2 tax
- $1,568 · $131/mo
- Expected delta
- +$1,006/yr (+$84/mo · 179.1%)
ⓘ Screening estimate from a state-policy table — verify with the county assessor before closing.
Climate risk First Street
- Flood 1/10 Low FEMA zone X (unshaded) · 0% chance over 30 yrs
- Wildfire 4/10 Moderate
- Heat 9/10 Extreme 7 d/yr ≥107°F today · 17 d/yr by 30 yrs out
- Wind 8/10 Severe 98% chance of damaging wind over 30 yrs
- Air quality 2/10 Low 2 unhealthy d/yr today · 2 by 30 yrs out
Nearby sold comps map
Loading sold comps map…
Walkable amenities ~0.75 mi
Loading nearby amenities…
Taxation est. · year 1
- Rental income
- $25,333
- − Mortgage interest
- −$15,404
- − Property taxes
- −$562
- − Insurance
- −$1,375
- − Repairs & maintenance
- −$2,027
- − Management
- −$2,027
- − Depreciation
- −$8,000
- Taxable loss
- −$4,061
- Est. tax savings @ 24.0%
- +$975
- After-tax cash flow
- $1,746/yr
For passive investors: Depreciation is non-cash, so a rental often shows a tax loss while cash-flowing — sheltering income. Rental losses are passive: they offset passive income freely, and up to $25,000/yr can offset ordinary (W-2) income if you actively participate and your MAGI is under $100k (phasing out to $0 by $150k); unused losses carry forward. On sale, claimed depreciation is recaptured at up to 25%, and gains may owe capital-gains tax (a 1031 exchange can defer both). Figures are a year-1 estimate at your 24.0% rate — not tax advice; consult a CPA.
Schools (NCES district)
- District
- Berkeley 01
- NCES district ID
- 4501170
- Math proficiency
- 35% ▼ -8.00%
- Reading proficiency
- 48% ▼ -2.00%
- Median HH income
- $52,724
- Composite
- 35.95/100
- National rank
- #4799
- State rank
- #30 of 80 in SC
Livability — Goose Creek
- Score
- 67/100
- State rank
- #103
- US rank
- #10912
Category grades
Schools grade is shown separately in the Schools card above.
Census & demographics
- County
- Berkeley County · 198,768 people
- City population
- 59,227
- Metro
- Charleston-North Charleston, SC
- Population (ZIP)
- 59,227
- Household income
- $81,594
- Rent vs Own
- Severe rent burden
- 1308.0
Population outlook (Berkeley County) Hauer SSP2
- Today (2025)
- 254,184 people
- By 2030
- 279,677 · +10.0%
- By 2040
- 329,379 · +29.6%
- By 2050
- 375,557 · +47.8%
- By 2075
- 476,740 · +87.6%
- By 2100
- 535,945 · +110.8%
Race, ethnicity, and origin ACS 2023
- Neighborhood character
- Diverse neighborhood (Simpson 0.63)
- Race & ethnicity
- White 55% Black 23% Hispanic / Latino 11% Two or more races 9% Asian 3%
- Hispanic origin (detail)
- Mexican 4% Puerto Rican 3%
- Common ancestry
- Slovak 2% Lithuanian 2% Italian 1%
- Foreign-born
- 9% · Canada, Jamaica, Vietnam
- Languages at home
- 86% English-only · Spanish 8% Other Indo-European 2% Tagalog/Filipino 2%
Political lean MEDSL · Berkeley
- 2024 margin
- R (+16.3) · D 41.1% · R 57.4% · Other 1.4%
- 2008→2024 swing
- -3.2pp toward R · 2008: -13.1pp · 2024: -16.3pp
- All cycles
- 2024: R+16.3 2020: R+11.7 2016: R+17.4 2012: R+18.9 2008: R+13.1
Not yet ingested
- Civics
- —
Market trends
- HPI YoY
- ▼ -66.40%
- Current HPI
- 301.8653
- Rent YoY
- ▲ 4.52%
- Metro
- Charleston-North Charleston, SC
- State GDP YoY
- ▲ 4.51%
- F500 in state
- 2
Industry mix (Fortune 500 HQ in SC)
| Industry | F500 HQs | Revenue |
|---|---|---|
| Packaging | 1 | $7B |
|
||
Price history
-5.1% since first listed6 events — show timeline
- 2026-05-22 Relisted — Charleston Trident MLS
- 2026-05-06 Contingent — Charleston Trident MLS
- 2026-04-21 Price Changed $275,000 Charleston Trident MLS
- 2026-03-23 Price Changed $279,900 Charleston Trident MLS
- 2026-03-10 Price Changed $284,900 Charleston Trident MLS
- 2025-10-10 Listed $289,900 Charleston Trident MLS
Property tax history
+2.7%/yrLatest (2025): $562 · +6.2% YoY. Source: county tax records.
Cash-flow waterfall
monthlySold comps — $/sqft
last 12 mo · ≤1 miLoading sold comps…