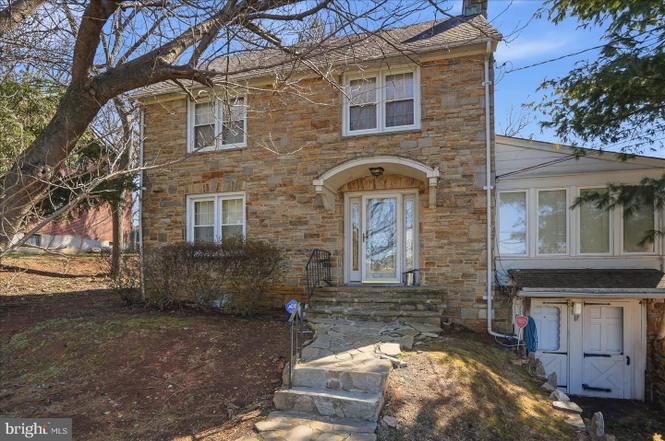
3621 Clifmar Rd · Milford Mill, MD
Flood risk 1/10 · Minimal
- FEMA flood zone
- X (unshaded)
- Chance of flooding over 30 yrs
- 0.0%
- Est. flood insurance / yr
- $473 – $860
Fire risk 1/10 · Minimal
- Est. fire insurance / yr
- $755 – $1,403
Heat risk 6/10 · Moderate
- Hot days now (above 103°F)
- 7 days/yr
- Hot days in 30 yrs
- 15 days/yr
Wind risk 4/10 · Minor
- Chance of severe wind over 30 yrs
- 18.0%
Air-quality risk 2/10 · Minimal
- Unhealthy air days now
- 1 days/yr
- Unhealthy air days in 30 yrs
- 2 days/yr
Risk factors via First Street. Map © Google.
Why this score? — see what drove the C+ grade
The composite is a weighted blend of 9 inputs, each scored 0–100. Each bar is that input's sub-score; the figure is the points it added to the 100-point composite (weight × sub-score).
- Cash flow +22.8/30.0
- ARV discount +15.0/15.0
- DSCR +7.3/10.0
- 1% rule +6.1/10.0
- Livability +3.8/5.0
- Rent growth +3.5/5.0
- Condition / age +2.5/5.0
- Schools +2.3/10.0
- Appreciation +0.0/10.0
$290,000
🖨 Deal sheet 📄 Offer letter ✓ Due diligence
Listing remarks
Property being SOLD AS-IS, Imagine a home with income potential: this home offers 4BR/2BA plus a 1BR/1BA in-law suite and sits on a sprawling lot in the quiet neighborhood of Georges Park. Pull into your private driveway, make your way up the stone walkway to the covered front entrance and step into a home filled with original character, beginning with the stone facade, hardwood floors, arched entryways, and high ceilings. The main living space features a large living room with a stunning wood burning fireplace, a formal dining room, and a kitchen that offers plenty of wood cabinets and countertops. Just off the living room is an attached sunroom with three walls of windows ideal as a famil
Key facts
- 9,815 sq ft lot
- Built 1939
- Listed 13 days
Neighborhood map
What this means for you Summary
Snapshot
- This is a 5-bed/2.0-bath single-family listed at $290k.
Deal economics
- At list price, monthly cash flow is $505 ($6k/yr) — positive.
- The deal already cash-flows at list — no discount required.
- Meets the 1% rule at list price ($3k rent vs $290k).
- Cap rate 8.4% vs local median 5.2% in Milford Mill — top-decile yield for the area; either an underpriced asset or a hidden risk that comps aren't pricing in. Stress-test before assuming the spread holds.
Location & tenants
- Location reads 75/100 on livability (#99 in MD, #3,838 nationally) — a middle-class / working-renter tenant base. Strengths: commute A+, housing A+, employment B; Watch: crime F, amenities F.
- Baltimore County Public Schools (suburban): math 15% / reading 34% proficiency, ranked #11 of 24 in MD (top 46%) — low school quality limits family demand, transient renter base, plan for 1-2y turnover.
- Market conditions: Rents rising (+3.9%/yr); 74 active listings in the ZIP; 4 comparable units currently listed for rent nearby; rentals lingering (median 44d on market — plan ~5-8 weeks vacancy on turnover, expect pricing pressure); 75% of comp listings sitting > 30 days — soft ceiling on asking rent; solid renter incomes; 1,511 units permitted in Baltimore County in 2024 (643 in 5+ unit buildings).
- At $3,213/mo this rent would consume 45% of the median local household income ($85k/yr) (locally 1434% of renters already pay >50% of income on rent) — very limited rent-growth headroom before tenants either downsize or default.
Forward outlook
- Local home prices are declining (-3.0%/yr); year-one equity from $2k of loan paydown is wiped out by about $9k of value loss. Plan a longer hold.
- Baltimore County population projected at +12% by 2050 — modest demand growth; plan on rents tracking national, not racing it.
Negotiation context
- Only 13 days on market — expect competitive offers; lowballing is unlikely to land.
- 6 sale attempts since 28y ago; this cycle's ask has dropped $25k (8%) from the opening price — seller is motivated, your offer sets the floor, not the list.
- Current owner paid $144k; list at $290k implies a 102% gain — meaningful room to come down on a strong offer.
Risks & watch-outs
- Watch-outs: built in 1939 — expect roof / HVAC / electrical / plumbing capex.
- Climate carrying-cost: extreme-heat days projected 7→15/yr by 2055 (HVAC capex compounding) — expect insurance premiums to compound above CPI over the hold.
Questions for the listing agent
- Built in 1939 — when were the roof, HVAC, electrical panel, plumbing, and water heater last replaced?
- Is there a deadline driving the sale (1031 exchange, divorce, estate, relocation)? That informs how much negotiation room exists.
- Crime grade is F in this area — have there been break-ins, vandalism, or insurance claims at this property in the last 3 years? What carrier currently insures it and at what premium?
- What's the average days-on-market for RENTAL listings here right now (not sales)? A rising rental-DOM trend means longer vacancies and softer asking-rent achievability than the comps imply.
- What's the recent tenant-quality profile in this submarket — average credit score on applications, eviction rate, late-payment / NSF rate, and stable-employment percentage? A property-management company in the area should have these aggregated.
- How much new for-sale + rental construction is in the pipeline within 1–3 miles? Heavy new supply typically softens prices + rents 12–24 months out; constrained supply supports both.
Investment metrics
- 1% rule
- 1.11% ✓
- Cap rate
- 8.38%
- Cash-on-cash
- 7.47%
- DSCR
- 1.33
- GRM
- 7.5
CMA / ARV
- ARV (on-the-fly)
- $455,628
- Comps found
- 10
Show comp detail 10 sales within ~0.75 mi
| Address | Dist | Beds/Ba | Sqft | Sold | Price | $/sf | Match |
|---|---|---|---|---|---|---|---|
| 4761 Byron Rd | 0.54mi | 4/3.5 (-1) | 2,744 (+4%) | 4mo | $472,000 | $172 | 54 |
| 8422 Merryview Dr | 0.29mi | 5/3.5 | 3,008 (+14%) | 6mo | $515,000 | $171 | 52 |
| 3514 Courtleigh Dr | 0.27mi | 5/2.5 | 2,336 (-12%) | 17mo | $465,000 | $199 | 52 |
| 8504 Church Ln | 0.33mi | 4/2.0 (-1) | 2,494 (-6%) | 24mo | $360,000 | $144 | 50 |
| 8002 Parks Ln | 0.65mi | 4/3.0 (-1) | 2,696 (+2%) | 15mo | $499,999 | $185 | 45 |
| 8107 Carlson Ln | 0.73mi | 4/3.5 (-1) | 2,652 (+0%) | 14mo | $381,000 | $144 | 43 |
| 8532 Stevenswood Rd | 0.51mi | 4/3.0 (-1) | 2,336 (-12%) | 12mo | $399,999 | $171 | 38 |
| 3308 Janvale Rd | 0.52mi | 4/3.0 (-1) | 2,848 (+8%) | 21mo | $422,000 | $148 | 36 |
| 4818 Oakland Park Rd | 0.71mi | 4/3.5 (-1) | 2,953 (+12%) | 3mo | $600,000 | $203 | 34 |
| 3302 Lauri Rd | 0.58mi | 4/3.0 (-1) | 2,336 (-12%) | 20mo | $435,000 | $186 | 27 |
Match score weights: distance 35% · size 25% · config 20% · recency 20%. Top-matched comps best support the ARV.
Projected returns pro-forma
-3.0% appreciation · 3.86% rent growth · sell at horizon
- IRR
- -3.9%
- Equity multiple
- 0.85×
- Total profit
- $-11,945
- Equity at exit
- $43,240
- IRR
- 6.8%
- Equity multiple
- 1.53×
- Total profit
- $43,010
- Equity at exit
- $25,074
Cash invested: $81,200 (down + closing). Projections, not guarantees.
Landlord ↔ Tenant lean methodology
- Overall (STATE)
- 27 Tenant-Leaning
- State Maryland
- 27 Tenant-Leaning · D+14
- County
- — inherits STATE
- City
- — inherits STATE
ZIP-level market 21244
- Home prices YoY
- -30.2%
- Rents YoY
- 3.9%
- Active inventory
- 74
- Price-to-rent
- 7.5×
Monthly cashflow live
- Estimated rent
- $3,213 medium interval (Pro) →
- Mortgage (P&I)
- −$1,521
- Tax from tax record
- −$391 /mo · $4,697/yr
- Insurance
- −$121
- HOA
- −$0
- Vacancy / Maint / Mgmt
- −$675
- Net cashflow
- $505
Break-even live
UW: 25.0% down · 7.5% · 30yr · 1.5% tax · 5.0% vac · 8.0% maint · 8.0% mgmt
Financing live
Cash to close
- Down payment
- $72,500
- Closing costs
- $8,700
- Reserves months
- —
- Total cash needed
- —
Loan-product check · same deal, 3 products live
Conventional
25% down · 7.5% · 30yr
- Down + closing
- —
- Monthly P&I
- —
- Monthly cashflow
- —
- DSCR
- —
- Eligible?
- —
Personal DTI + credit; lowest rate.
DSCR
20% down · 8.5% · 30yr
- Down + closing
- —
- Monthly P&I
- —
- Monthly cashflow
- —
- DSCR
- —
- Eligible?
- —
No personal income docs; deal must DSCR.
Hard money
10% down · 12.0% · 12mo
- Down + closing
- —
- Monthly P&I
- —
- Monthly cashflow
- —
- DSCR
- —
- Eligible?
- —
Short-term bridge; refi at stabilization.
Rent comps 4 comps
| Address | Beds | Baths | Sqft | Rent | $/sqft | DOM | Units | Dist |
|---|---|---|---|---|---|---|---|---|
| 3616 Clifmar Rd Windsor Mill, MD | 4.0 | 2.5 | 2049 | $3,000 | $1.46 | 43d | 1 | 0.04mi |
| 3630 Hilmar Rd Windsor Mill, MD | 4.0 | 2.5 | 3340 | $3,799 | $1.14 | 21d | 1 | 0.07mi |
| 8503 Stevenswood Rd Windsor Mill, MD | 4.0 | 3.0 | 1880 | $3,700 | $1.97 | 43d | 1 | 0.40mi |
| 3220 N Rolling Rd Windsor Mill, MD | 4.0 | 3.0 | 2052 | $4,000 | $1.95 | 43d | 1 | 0.99mi |
Listing history 19 events
-
2026-03-27status Pending
-
2026-03-24price $290,000
-
2026-03-16status Active
-
2026-03-15historical
-
2026-03-13$315,000 Active
-
2026-03-10historical $315,000
-
2019-09-19historical
-
2019-08-12price $240,000
-
2019-07-05$250,000 Active
-
2007-09-01historical
-
2007-06-14
-
2003-01-13soldstatus $143,500
-
2002-10-31soldstatus $143,500
-
2002-09-07historical
-
2002-09-05$139,900
-
1998-04-03soldstatus $122,000
-
1998-03-31soldstatus $122,000
-
1998-02-16historical
-
1998-01-14$125,000
ⓘ Source: listings_history table (triggers on properties + properties_extension) + one-shot
backfill from property_details.listing_events for pre-trigger history.
Tax reassessment forecast MD · Partial reset (capped growth)
- Current annual tax
- $4,697 · $391/mo
- Projected year-2 tax
- $4,697 · $391/mo
- Expected delta
- $0/yr ($0/mo · 0.0%)
ⓘ Screening estimate from a state-policy table — verify with the county assessor before closing.
Climate risk First Street
- Flood 1/10 Low FEMA zone X (unshaded) · 0% chance over 30 yrs
- Wildfire 1/10 Low
- Heat 6/10 Major 7 d/yr ≥103°F today · 15 d/yr by 30 yrs out
- Wind 4/10 Moderate 18% chance of damaging wind over 30 yrs
- Air quality 2/10 Low 1 unhealthy d/yr today · 2 by 30 yrs out
Nearby sold comps map
Loading sold comps map…
Walkable amenities ~0.75 mi
Loading nearby amenities…
Taxation est. · year 1
- Rental income
- $38,555
- − Mortgage interest
- −$16,245
- − Property taxes
- −$4,697
- − Insurance
- −$1,450
- − Repairs & maintenance
- −$3,084
- − Management
- −$3,084
- − Depreciation
- −$8,436
- Taxable income
- $1,559
- Est. tax owed @ 24.0%
- −$374
- After-tax cash flow
- $5,688/yr
For passive investors: Depreciation is non-cash, so a rental often shows a tax loss while cash-flowing — sheltering income. Rental losses are passive: they offset passive income freely, and up to $25,000/yr can offset ordinary (W-2) income if you actively participate and your MAGI is under $100k (phasing out to $0 by $150k); unused losses carry forward. On sale, claimed depreciation is recaptured at up to 25%, and gains may owe capital-gains tax (a 1031 exchange can defer both). Figures are a year-1 estimate at your 24.0% rate — not tax advice; consult a CPA.
Schools (NCES district)
- District
- Baltimore County Public Schools
- NCES district ID
- 2400120
- Math proficiency
- 15% ▼ -16.00%
- Reading proficiency
- 34% ▼ -5.00%
- Median HH income
- $66,746
- Composite
- 23.17/100
- National rank
- #7948
- State rank
- #11 of 24 in MD
Livability — Milford Mill
- Score
- 75/100
- State rank
- #99
- US rank
- #3838
Category grades
Schools grade is shown separately in the Schools card above.
Census & demographics
- Census place
- Milford Mill, MD
- County
- Baltimore County · 769,527 people
- City population
- 39,545
- Metro
- Baltimore-Columbia-Towson, MD
- Population (ZIP)
- 38,208
- Household income
- $85,114
- Rent vs Own
- Severe rent burden
- 1434.0
Population outlook (Baltimore County) Hauer SSP2
- Today (2025)
- 885,518 people
- By 2030
- 909,272 · +2.7%
- By 2040
- 951,547 · +7.5%
- By 2050
- 990,955 · +11.9%
- By 2075
- 1,086,411 · +22.7%
- By 2100
- 1,135,078 · +28.2%
Race, ethnicity, and origin ACS 2023
- Neighborhood character
- Predominantly Black (70%)
- Race & ethnicity
- Black 70% Hispanic / Latino 12% White 9% Asian 7% Two or more races 3%
- Hispanic origin (detail)
- Mexican 3% Puerto Rican 2%
- Common ancestry
- Romanian 1%
- Foreign-born
- 17% · Canada
- Languages at home
- 78% English-only · Spanish 9% Other Indo-European 5% French/Haitian/Cajun 2%
Political lean MEDSL · Baltimore
- 2024 margin
- Strong D (+24.5) · D 61.0% · R 36.5% · Other 2.5%
- 2008→2024 swing
- +9.9pp toward D · 2008: 14.6pp · 2024: 24.5pp
- All cycles
- 2024: D+24.5 2020: D+27.0 2016: D+17.4 2012: D+16.4 2008: D+14.6
Not yet ingested
- Civics
- —
Market trends
- HPI YoY
- ▼ -111.97%
- Current HPI
- 258.8502
- Rent YoY
- ▲ 3.86%
- Metro
- Baltimore-Columbia-Towson, MD
- State GDP YoY
- ▲ 2.97%
- F500 in state
- 12
Industry mix (Fortune 500 HQ in MD)
| Industry | F500 HQs | Revenue |
|---|---|---|
| Aerospace / Defense | 1 | $71B |
|
||
| Utilities | 1 | $25B |
|
||
| Hotels | 1 | $24B |
|
||
| Consumer Goods | 1 | $7B |
|
||
| Real Estate | 1 | $6B |
|
||
| Chemicals | 1 | $2B |
|
||
Price history
+132.0% since first listed19 events — show timeline
- 2026-03-27 Pending — BRIGHT MLS
- 2026-03-24 Price Changed $290,000 BRIGHT MLS
- 2026-03-16 Relisted — BRIGHT MLS
- 2026-03-15 Listing Removed — BRIGHT MLS
- 2026-03-13 Listed $315,000 BRIGHT MLS
- 2026-03-10 Coming Soon $315,000 BRIGHT MLS
- 2019-09-19 Listing Removed — BRIGHT MLS
- 2019-08-12 Price Changed $240,000 BRIGHT MLS
- 2019-07-05 Listed $250,000 BRIGHT MLS
- 2007-09-01 Delisted — MRIS
- 2007-06-14 Listed — MRIS
- 2003-01-13 Sold (Public Records) $143,500 Public Records
- 2002-10-31 Sold (MLS) $143,500 MRIS
- 2002-09-07 Delisted — MRIS
- 2002-09-05 Listed $139,900 MRIS
- 1998-04-03 Sold (Public Records) $122,000 Public Records
- 1998-03-31 Sold (MLS) $122,000 MRIS
- 1998-02-16 Delisted — MRIS
- 1998-01-14 Listed $125,000 MRIS
Property tax history
+0.3%/yrLatest (2025): $4,697 · +3.2% YoY. Source: county tax records.
Cash-flow waterfall
monthlySold comps — $/sqft
last 12 mo · ≤1 miLoading sold comps…