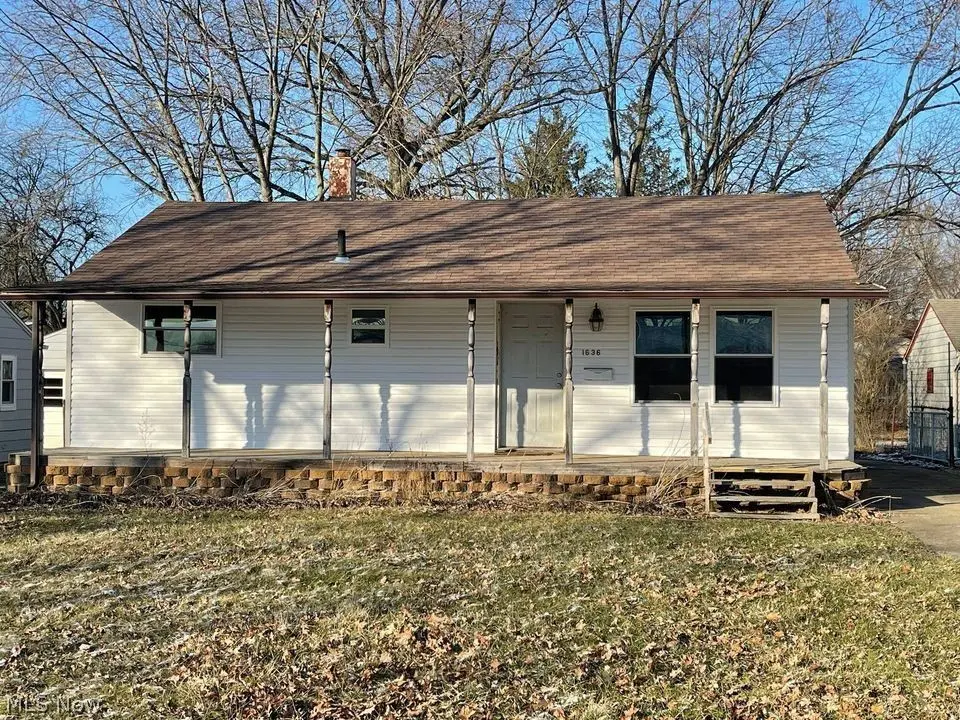
1636 Country Clb · Youngstown, OH
Flood risk 1/10 · Minimal
- FEMA flood zone
- X (unshaded)
- Chance of flooding over 30 yrs
- 0.0%
- Est. flood insurance / yr
- $473 – $860
Fire risk 1/10 · Minimal
- Est. fire insurance / yr
- $713 – $1,323
Heat risk 3/10 · Minor
- Hot days now (above 97°F)
- 7 days/yr
- Hot days in 30 yrs
- 17 days/yr
Wind risk 1/10 · Minimal
- Chance of severe wind over 30 yrs
- —
Air-quality risk 3/10 · Minor
- Unhealthy air days now
- 1 days/yr
- Unhealthy air days in 30 yrs
- 4 days/yr
Risk factors via First Street. Map © Google.
Why this score? — see what drove the B grade
The composite is a weighted blend of 9 inputs, each scored 0–100. Each bar is that input's sub-score; the figure is the points it added to the 100-point composite (weight × sub-score).
- Cash flow +29.7/30.0
- ARV discount +15.0/15.0
- DSCR +10.0/10.0
- 1% rule +7.6/10.0
- Livability +4.0/5.0
- Rent growth +2.5/5.0
- Condition / age +2.5/5.0
- Schools +0.9/10.0
- Appreciation +0.0/10.0
$99,900
🖨 Deal sheet (PDF) 📄 Offer letter ✓ Due diligence
Listing remarks
This 3 bedroom Ranch in a convenient locationoffers an incredible opportunity for investors or future homeowners alike! Featuring a functional layout with comfortable living spaces, the home offers plenty of upside and is ready for your personal touch and updates to make it truly shine. Enjoy a spacious yard and a convenient location close to shopping, dining, parks, schools, and major routes for easy commuting. Whether you’re expanding your rental portfolio, searching for your first investment property, or planning for future owner occupancy, this property delivers value, location, and opportunity. Updates include Newer Furnace and Central AC, Windows, Kitchen, Paint, LVP flooring t
Key facts
- Spacious yard
- Central ac
- Newer furnace
Tags
Neighborhood map
What this means for you Summary
Snapshot
- This is a 3-bed/1.0-bath single-family listed at $100k.
Deal economics
- At list price, monthly cash flow is $365 ($4k/yr) — positive.
- The deal already cash-flows at list — no discount required.
- Meets the 1% rule at list price ($1k rent vs $100k).
- Recommended offer: $98k (1.5% below list) — sets the bar for market timing.
- Cap rate 10.7% vs local median 7.0% in Youngstown — top-decile yield for the area; either an underpriced asset or a hidden risk that comps aren't pricing in. Stress-test before assuming the spread holds.
Location & tenants
- Location reads 81/100 on livability (#99 in OH, #1,506 nationally) — a professional / high-income tenant draw. Strengths: amenities A+, commute A+, cost of living A+; Watch: crime F, employment F.
- Youngstown City (urban): math 8% / reading 17% proficiency, ranked #649 of 656 in OH (top 99%) — low school quality limits family demand, transient renter base, plan for 1-2y turnover; 88% free/reduced lunch — lower-income household profile, screen leases tightly.
- Market conditions: 156 active listings in the ZIP; 10 comparable units currently listed for rent nearby; rentals lingering (median 45d on market — plan ~5-8 weeks vacancy on turnover, expect pricing pressure); 50% of comp listings sitting > 30 days — soft ceiling on asking rent; solid renter incomes; 147 units permitted in Mahoning County in 2024 (0 in 5+ unit buildings).
Forward outlook
- Local home prices are declining (-3.0%/yr); year-one equity from $691 of loan paydown is wiped out by about $3k of value loss. Plan a longer hold.
- Mahoning County population projected at -14% by 2050 — secular population decline; favor cash flow + early exit over multi-decade hold.
- At projected returns (-3.0% appreciation + 3.0% rent growth), your $28k cash investment doubles in ~8 years — after that, you're playing with house money.
Negotiation context
- It's been on market 27 days — a 2% lower offer ($98k) is reasonable based on typical stale-listing flexibility.
- 5 sale attempts since 12y ago with the ask held roughly flat each time — persistent listings suggest the price (not the market) is what's stuck; bring a comps-based counter.
- Current owner paid $35k; list at $100k implies a 185% gain — meaningful room to come down on a strong offer.
Risks & watch-outs
- Watch-outs: built in 1955 — expect roof / HVAC / electrical / plumbing capex.
Questions for the listing agent
- Built in 1955 — when were the roof, HVAC, electrical panel, plumbing, and water heater last replaced?
- Is there a deadline driving the sale (1031 exchange, divorce, estate, relocation)? That informs how much negotiation room exists.
- Crime grade is F in this area — have there been break-ins, vandalism, or insurance claims at this property in the last 3 years? What carrier currently insures it and at what premium?
- What's the average days-on-market for RENTAL listings here right now (not sales)? A rising rental-DOM trend means longer vacancies and softer asking-rent achievability than the comps imply.
- What's the recent tenant-quality profile in this submarket — average credit score on applications, eviction rate, late-payment / NSF rate, and stable-employment percentage? A property-management company in the area should have these aggregated.
- How much new for-sale + rental construction is in the pipeline within 1–3 miles? Heavy new supply typically softens prices + rents 12–24 months out; constrained supply supports both.
Investment metrics
- 1% rule
- 1.26% ✓
- Cap rate
- 10.68%
- Cash-on-cash
- 15.66%
- DSCR
- 1.70
- GRM
- 6.6
CMA / ARV
- ARV (on-the-fly)
- $132,884
- Comps found
- 12
Show comp detail 12 sales within ~0.75 mi
| Address | Dist | Beds/Ba | Sqft | Sold | Price | $/sf | Match |
|---|---|---|---|---|---|---|---|
| 1654 Thalia Ave | 0.07mi | 3/1.0 | 984 (+3%) | 3mo | $56,250 | $57 | 89 |
| 1645 Chattanooga Ave | 0.17mi | 2/1.0 (-1) | 952 (-0%) | 6mo | $129,900 | $136 | 81 |
| 1737 Halbert Dr | 0.49mi | 3/1.0 | 960 (+0%) | 3mo | $167,000 | $174 | 74 |
| 1720 Sequoya Dr | 0.14mi | 3/2.0 | 1,044 (+9%) | 4mo | $168,000 | $161 | 71 |
| 1928 Palo Verde Dr | 0.22mi | 3/1.0 | 1,074 (+12%) | 3mo | $130,000 | $121 | 67 |
| 1913 Country Club Ave | 0.19mi | 3/2.0 | 1,092 (+14%) | 0mo | $78,000 | $71 | 64 |
| 1634 Meadowbrook Ave | 0.27mi | 2/1.0 (-1) | 824 (-14%) | 1mo | $118,000 | $143 | 58 |
| 2021 Country Club Ave | 0.34mi | 3/1.5 | 1,082 (+13%) | 6mo | $171,000 | $158 | 55 |
| 612 Maplewood Ave | 0.61mi | 3/1.0 | 1,056 (+10%) | 3mo | $135,000 | $128 | 52 |
| 608 Maplewood Ave | 0.62mi | 3/1.0 | 864 (-10%) | 6mo | $120,000 | $139 | 50 |
| 2002 Bancroft Ave | 0.46mi | 3/2.0 | 1,080 (+13%) | 4mo | $131,500 | $122 | 49 |
| 5522 Sheridan Rd | 0.56mi | 3/1.0 | 1,084 (+13%) | 3mo | $225,000 | $208 | 49 |
Match score weights: distance 35% · size 25% · config 20% · recency 20%. Top-matched comps best support the ARV.
Projected returns pro-forma
-3.0% appreciation · 3.0% rent growth · sell at horizon
- IRR
- 6.5%
- Equity multiple
- 1.25×
- Total profit
- $7,036
- Equity at exit
- $14,895
- IRR
- 15.8%
- Equity multiple
- 2.29×
- Total profit
- $35,973
- Equity at exit
- $8,638
Cash invested: $27,972 (down + closing). Projections, not guarantees.
Landlord ↔ Tenant lean methodology
- Overall (STATE)
- 73 Landlord-Friendly
- State Ohio
- 73 Landlord-Friendly · R+6
- County
- — inherits STATE
- City
- — inherits STATE
ZIP-level market 44514
- Home prices YoY
- -23.8%
- Active inventory
- 156
- Price-to-rent
- 6.6×
Monthly cashflow live
- Estimated rent
- $1,254 high interval (Pro) →
- Mortgage (P&I)
- −$524
- Tax from tax record
- −$60 /mo · $720/yr
- Insurance
- −$42
- HOA
- −$0
- Vacancy / Maint / Mgmt
- −$263
- Net cashflow
- $365
Break-even live
Sensitivity live
| Price | -10% $422 | -5% $393 | +0% $365 | +5% $337 | +10% $308 |
|---|---|---|---|---|---|
| Rent | -10% $266 | -5% $315 | +0% $365 | +5% $414 | +10% $464 |
| Rate | -1.0pp $415 | -0.5pp $390 | base $365 | +0.5pp $339 | +1.0pp $313 |
UW: 25.0% down · 7.5% · 30yr · 1.5% tax · 5.0% vac · 8.0% maint · 8.0% mgmt
Financing live
Cash to close
- Down payment
- $24,975
- Closing costs
- $2,997
- Reserves months
- —
- Total cash needed
- —
Loan-product check · same deal, 3 products live
Conventional
25% down · 7.5% · 30yr
- Down + closing
- —
- Monthly P&I
- —
- Monthly cashflow
- —
- DSCR
- —
- Eligible?
- —
Personal DTI + credit; lowest rate.
DSCR
20% down · 8.5% · 30yr
- Down + closing
- —
- Monthly P&I
- —
- Monthly cashflow
- —
- DSCR
- —
- Eligible?
- —
No personal income docs; deal must DSCR.
Hard money
10% down · 12.0% · 12mo
- Down + closing
- —
- Monthly P&I
- —
- Monthly cashflow
- —
- DSCR
- —
- Eligible?
- —
Short-term bridge; refi at stabilization.
Rent comps 10 comps
| Address | Beds | Baths | Sqft | Rent | $/sqft | DOM | Units | Dist |
|---|---|---|---|---|---|---|---|---|
| 610 Elm St Struthers, OH | 3.0 | 1.0 | 1050 | $1,500 | $1.43 | 14d | 1 | 0.69mi |
| 1914 S Heights Ave Youngstown, OH | 3.0 | 1.0 | 1115 | $1,950 | $1.75 | 45d | 1 | 0.84mi |
| 1803 Pointview Ave Youngstown, OH | 2.0 | 1.0 | 950 | $1,000 | $1.05 | 45d | 1 | 0.86mi |
| 61 Crescent Dr Struthers, OH | 2.0 | 1.0 | 670 | $650 | $0.97 | 15d | 1 | 0.87mi |
| 929 Cook Ave Unit 1 Youngstown, OH | 2.0 | 1.0 | 700 | $850 | $1.21 | 45d | 1 | 0.90mi |
| 851 Cook Ave Unit 4 Youngstown, OH | 2.0 | 1.0 | 1050 | $800 | $0.76 | 45d | 1 | 0.99mi |
| 2523 E Midlothian Blvd Apt 5 Struthers, OH | 2.0 | 1.0 | 750 | $800 | $1.07 | 15d | 1 | 1.06mi |
| 3446 Ambert Ave Youngstown, OH | 4.0 | 1.0 | 1100 | $1,250 | $1.14 | 15d | 1 | 1.06mi |
| 6300 South Ave Youngstown, OH | 1.0–2.0 | 1.0–2.0 | 743 | $950 | $1.28 | 14d | 1 | 1.21mi |
| 413 Mathews Rd Boardman, OH | 2.0 | 1.0 | 1000 | $1,200 | $1.20 | 45d | 1 | 1.35mi |
Listing history 21 events
-
2026-06-09statusdays on market $99,900 Pending 27 DOM
-
2026-06-08days on market $99,900 Active 26 DOM
-
2026-06-07days on market $99,900 Active 25 DOM
-
2026-06-03days on market $99,900 Active 21 DOM
-
2026-06-02days on market $99,900 Active 20 DOM
-
2026-06-01days on market $99,900 Active 19 DOM
-
2026-05-31days on market $99,900 Active 18 DOM
-
2026-05-30days on market $99,900 Active 17 DOM
-
2026-05-13$99,900 Active
-
2024-03-26status Pending
-
2024-03-25historical
-
2024-03-22$99,900 Active
-
2021-03-09soldstatus $35,000 Closed
-
2021-02-23status Pending
-
2021-02-11$44,500 Active
-
2015-01-23soldstatus $12,500
-
2015-01-05historical
-
2014-11-10$16,500
-
2014-11-09historical
-
2014-07-09$17,500
-
1996-08-23soldstatus $41,400
ⓘ Source: listings_history table (triggers on properties + properties_extension) + one-shot
backfill from property_details.listing_events for pre-trigger history.
Tax reassessment forecast OH · Partial reset (capped growth)
- Current annual tax
- $720 · $60/mo
- Projected year-2 tax
- $1,139 · $95/mo
- Expected delta
- +$419/yr (+$35/mo · 58.2%)
ⓘ Screening estimate from a state-policy table — verify with the county assessor before closing.
Climate risk First Street
- Flood 1/10 Low FEMA zone X (unshaded) · 0% chance over 30 yrs
- Wildfire 1/10 Low
- Heat 3/10 Moderate 7 d/yr ≥97°F today · 17 d/yr by 30 yrs out
- Wind 1/10 Low
- Air quality 3/10 Moderate 1 unhealthy d/yr today · 4 by 30 yrs out
Nearby sold comps map
Loading sold comps map…
Walkable amenities ~0.75 mi
Loading nearby amenities…
Taxation est. · year 1
- Rental income
- $15,046
- − Mortgage interest
- −$5,596
- − Property taxes
- −$720
- − Insurance
- −$500
- − Repairs & maintenance
- −$1,204
- − Management
- −$1,204
- − Depreciation
- −$2,906
- Taxable income
- $2,916
- Est. tax owed @ 24.0%
- −$700
- After-tax cash flow
- $3,680/yr
For passive investors: Depreciation is non-cash, so a rental often shows a tax loss while cash-flowing — sheltering income. Rental losses are passive: they offset passive income freely, and up to $25,000/yr can offset ordinary (W-2) income if you actively participate and your MAGI is under $100k (phasing out to $0 by $150k); unused losses carry forward. On sale, claimed depreciation is recaptured at up to 25%, and gains may owe capital-gains tax (a 1031 exchange can defer both). Figures are a year-1 estimate at your 24.0% rate — not tax advice; consult a CPA.
Schools (NCES district)
- District
- Youngstown City
- NCES district ID
- 3904516
- Math proficiency
- 8% ▼ -15.00%
- Reading proficiency
- 17% ▼ -10.00%
- Median HH income
- $25,257
- Composite
- 9.29/100
- National rank
- #9858
- State rank
- #649 of 656 in OH
Livability — Youngstown
- Score
- 81/100
- State rank
- #99
- US rank
- #1506
Category grades
Schools grade is shown separately in the Schools card above.
Census & demographics
- Census place
- Youngstown, OH
- County
- Mahoning County · 84,956 people
- City population
- 28,503
- Metro
- Youngstown-Warren-Boardman, OH-PA
- Population (ZIP)
- 23,917
- Household income
- $79,808
- Rent vs Own
- Severe rent burden
- 411.0
Population outlook (Mahoning County) Hauer SSP2
- Today (2025)
- 223,932 people
- By 2030
- 218,387 · -2.5%
- By 2040
- 205,367 · -8.3%
- By 2050
- 193,606 · -13.5%
- By 2075
- 173,694 · -22.4%
- By 2100
- 151,147 · -32.5%
Race, ethnicity, and origin ACS 2023
- Neighborhood character
- Predominantly White (91%)
- Race & ethnicity
- White 91% Two or more races 4% Hispanic / Latino 3% Black 2%
- Common ancestry
- Romanian 6% Slovak 2% Lithuanian 2%
- Foreign-born
- 2% · Canada
- Languages at home
- 95% English-only · Other Indo-European 2% Spanish 2%
Political lean MEDSL · Mahoning
- 2024 margin
- Lean R (+9.4) · D 44.9% · R 54.4%
- 2008→2024 swing
- -36.1pp toward R · 2008: 26.6pp · 2024: -9.4pp
- All cycles
- 2024: R+9.4 2020: R+1.9 2016: D+3.0 2012: D+27.7 2008: D+26.6
Not yet ingested
- Civics
- —
Market trends
- HPI YoY
- ▼ -65.78%
- Current HPI
- 210.5511
- Rent YoY
- —
- Metro
- Youngstown-Warren-Boardman, OH-PA
- State GDP YoY
- ▲ 1.98%
- F500 in state
- 48
Industry mix (Fortune 500 HQ in OH)
| Industry | F500 HQs | Revenue |
|---|---|---|
| Insurance | 3 | $145B |
|
||
| Industrial Machinery | 3 | $49B |
|
||
| Financial Services | 3 | $24B |
|
||
| Consumer Goods | 2 | $93B |
|
||
| Aerospace / Defense | 2 | $47B |
|
||
| Utilities | 2 | $33B |
|
||
Price history
+141.3% since first listed13 events — show timeline
- 2026-05-13 Listed $99,900 MLSNOW
- 2024-03-26 Pending — MLSNOW
- 2024-03-25 Listing Removed — MLSNOW
- 2024-03-22 Listed $99,900 MLSNOW
- 2021-03-09 Sold (MLS) $35,000 MLSNOW
- 2021-02-23 Pending — MLSNOW
- 2021-02-11 Listed $44,500 MLSNOW
- 2015-01-23 Sold (MLS) $12,500 MLSNOW
- 2015-01-05 Listing Removed — MLSNOW
- 2014-11-10 Listed $16,500 MLSNOW
- 2014-11-09 Listing Removed — MLSNOW
- 2014-07-09 Listed $17,500 MLSNOW
- 1996-08-23 Sold (Public Records) $41,400 Public Records
Property tax history
-2.4%/yrLatest (2025): $720 · -11.9% YoY. Source: county tax records.
Cash-flow waterfall
monthlySold comps — $/sqft
last 12 mo · ≤1 miLoading sold comps…