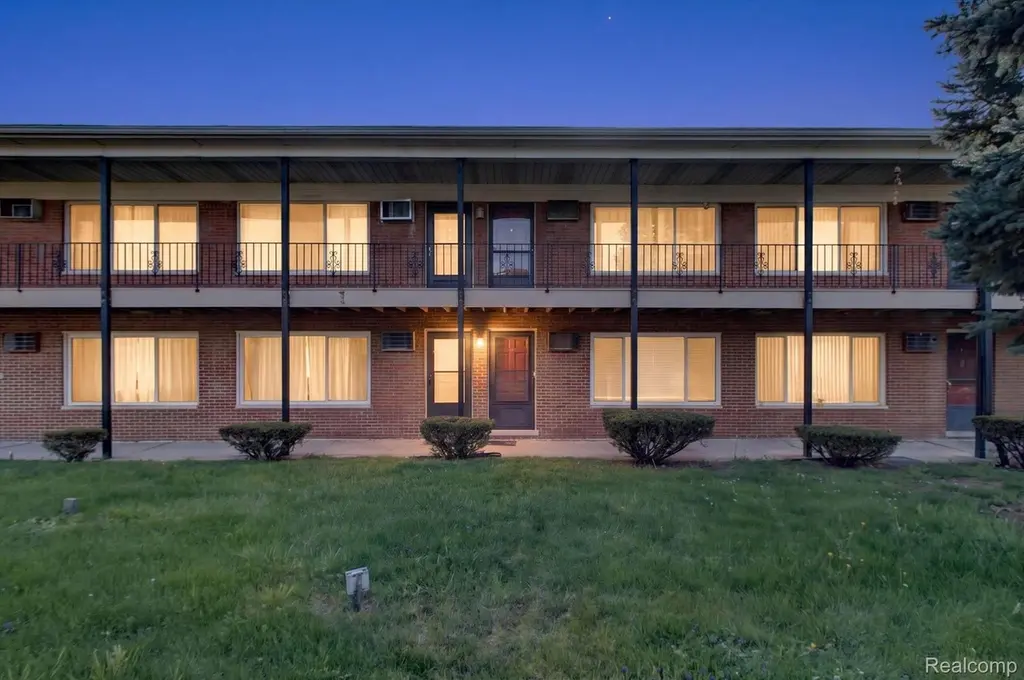
25301 5 Mile rd Rd #109 · Redford, MI
Flood risk No data
- FEMA flood zone
- —
- Chance of flooding over 30 yrs
- —
- Est. flood insurance / yr
- —
Fire risk No data
- Est. fire insurance / yr
- —
Heat risk No data
- Hot days now (above threshold)
- —
- Hot days in 30 yrs
- —
Wind risk No data
- Chance of severe wind over 30 yrs
- —
Air-quality risk No data
- Unhealthy air days now
- —
- Unhealthy air days in 30 yrs
- —
Risk factors via First Street. Map © Google.
Why this score? — see what drove the D+ grade
The composite is a weighted blend of 9 inputs, each scored 0–100. Each bar is that input's sub-score; the figure is the points it added to the 100-point composite (weight × sub-score).
- Cash flow +17.1/30.0
- 1% rule +10.0/10.0
- ARV discount +7.5/15.0
- DSCR +5.3/10.0
- Rent growth +3.3/5.0
- Livability +2.5/5.0
- Condition / age +2.5/5.0
- Schools +1.4/10.0
- Appreciation +0.0/10.0
$53,000
🖨 Deal sheet 📄 Offer letter ✓ Due diligence
Listing remarks MLS
Private enclosed courtyard entrance for your safety and quite enjoyment. Ground floor. hardwood floors, stove, refrigerator, basement with common washer and dryer and storage space. Rent includes heat, water, snow removal, trash pickup and building maintenance. Private parking space and guest parking.
Key facts
- Hardwood floors
- $337 HOA
- Built 1965
Tags
Property features AI
Finance
- Other: Directions: South of 5 Mile, east of Beech Daly
- HOA & community: Monthly HOA fee of $337.50; HOA covers gas, grounds maintenance, structure maintenance, pest control, snow removal, trash, and water
Exterior
- Parking: Assigned parking; No garage
- Utilities: Public water; Public sewer; Sewer available
- Home design: Condominium; Residential property; Ground-level entry; One story
- Construction: Brick construction; Block foundation; Built with shingle roof (not specified in source)
- Exterior features: Paved road access; Cats allowed
Interior
- Bedrooms: 2 total rooms (includes bedrooms and living areas)
- Bathrooms: 1 full bathroom
- Heating & cooling: Natural gas heating; Wall furnace; Ceiling fans; Window air conditioning units
- Interior features: Basement partially finished; Common area laundry
- Laundry & utility: Shared laundry in common area
Neighborhood map
What this means for you Summary
Snapshot
- This is a 1-bed/1.0-bath condo listed at $53k.
Deal economics
- At list price, monthly cash flow is $37 ($444/yr) — positive.
- The deal already cash-flows at list — no discount required.
- Meets the 1% rule at list price ($912 rent vs $53k).
- Recommended offer: $51k (3.0% below list) — sets the bar for market timing.
Location & tenants
- Location reads: area grade D — affects rentability + tenant quality, not the cash-flow math above.
- Redford Union Schools District No. 1 (suburban): math 8% / reading 23% proficiency, ranked #489 of 540 in MI (top 91%) — low school quality limits family demand, transient renter base, plan for 1-2y turnover; 66% free/reduced lunch — lower-income household profile, screen leases tightly.
- Market conditions: Rents rising (+3.2%/yr); 188 active listings in the ZIP; 40 comparable units currently listed for rent nearby; rentals lingering (median 44d on market — plan ~5-8 weeks vacancy on turnover, expect pricing pressure); 90% of comp listings sitting > 30 days — soft ceiling on asking rent; 2,639 units permitted in Wayne County in 2024 (1,216 in 5+ unit buildings).
- This rent is only 15% of the median local income ($71k/yr) — well below the 30% rent-burden line; pricing power to push rent on renewal without tenant pushback.
Forward outlook
- Local home prices are declining (-3.0%/yr); year-one equity from $366 of loan paydown is wiped out by about $2k of value loss. Plan a longer hold.
- Wayne County population projected at -17% by 2050 — secular population decline; favor cash flow + early exit over multi-decade hold.
Negotiation context
- It's been on market 57 days — a 3% lower offer ($51k) is reasonable based on typical stale-listing flexibility.
- 15 sale attempts since 15y ago with the ask held roughly flat each time — persistent listings suggest the price (not the market) is what's stuck; bring a comps-based counter.
- Current owner paid $24k; list at $53k implies a 116% gain — meaningful room to come down on a strong offer.
Risks & watch-outs
- Watch-outs: HOA is 37% of rent.
Questions for the listing agent
- It's been on market 57 days. Have you received any prior offers? Is the seller open to a 3% concession, seller financing, or rate buy-down credit?
- Built in 1965 — when were the roof, HVAC, electrical panel, plumbing, and water heater last replaced?
- What does the HOA fee cover, when was the last increase, and are there any pending special assessments or reserve-fund shortfalls?
- Any open or pending special assessments — roof, HVAC, plumbing, elevator, façade? What's the per-unit balance and payoff schedule, and is the seller paying it off at close or rolling it to the buyer?
- Is there a deadline driving the sale (1031 exchange, divorce, estate, relocation)? That informs how much negotiation room exists.
- The area grade is low — what's the realistic commute time and amenity access for the typical tenant pool here? Any planned neighborhood developments (good or bad) we should know about?
- What's the average days-on-market for RENTAL listings here right now (not sales)? A rising rental-DOM trend means longer vacancies and softer asking-rent achievability than the comps imply.
- What's the recent tenant-quality profile in this submarket — average credit score on applications, eviction rate, late-payment / NSF rate, and stable-employment percentage? A property-management company in the area should have these aggregated.
- How much new apartment / multifamily construction is in the pipeline within 1–3 miles? Heavy new supply (>2% of stock underway) typically softens rents 12–24 months out; light construction supports rent growth.
Investment metrics
- 1% rule
- 1.72% ✓
- Cap rate
- 7.13%
- Cash-on-cash
- 2.99%
- DSCR
- 1.13
- GRM
- 4.8
CMA / ARV
No comps found within radius.
Projected returns pro-forma
-3.0% appreciation · 3.25% rent growth · sell at horizon
- IRR
- -10.6%
- Equity multiple
- 0.61×
- Total profit
- $-5,794
- Equity at exit
- $7,902
- IRR
- -0.2%
- Equity multiple
- 0.99×
- Total profit
- $-215
- Equity at exit
- $4,582
Cash invested: $14,840 (down + closing). Projections, not guarantees.
Landlord ↔ Tenant lean methodology
- Overall (STATE)
- 62 Landlord-Friendly
- State Michigan
- 62 Landlord-Friendly · EVEN
- County
- — inherits STATE
- City
- — inherits STATE
ZIP-level market 48239
- Rents YoY
- 3.2%
- Active inventory
- 188
- Price-to-rent
- 4.8×
Monthly cashflow live
- Estimated rent
- $912 high interval (Pro) →
- Mortgage (P&I)
- −$278
- Tax from tax record
- −$47 /mo · $562/yr
- Insurance
- −$22
- HOA
- −$337
- Vacancy / Maint / Mgmt
- −$192
- Net cashflow
- $37
Break-even live
UW: 25.0% down · 7.5% · 30yr · 1.5% tax · 5.0% vac · 8.0% maint · 8.0% mgmt
Financing live
Cash to close
- Down payment
- $13,250
- Closing costs
- $1,590
- Reserves months
- —
- Total cash needed
- —
Loan-product check · same deal, 3 products live
Conventional
25% down · 7.5% · 30yr
- Down + closing
- —
- Monthly P&I
- —
- Monthly cashflow
- —
- DSCR
- —
- Eligible?
- —
Personal DTI + credit; lowest rate.
DSCR
20% down · 8.5% · 30yr
- Down + closing
- —
- Monthly P&I
- —
- Monthly cashflow
- —
- DSCR
- —
- Eligible?
- —
No personal income docs; deal must DSCR.
Hard money
10% down · 12.0% · 12mo
- Down + closing
- —
- Monthly P&I
- —
- Monthly cashflow
- —
- DSCR
- —
- Eligible?
- —
Short-term bridge; refi at stabilization.
Rent comps 40 comps
| Address | Beds | Baths | Sqft | Rent | $/sqft | DOM | Units | Dist |
|---|---|---|---|---|---|---|---|---|
| 16581 Wormer St Detroit, MI | 2.0 | 1.0 | 720 | $1,100 | $1.53 | 43d | 1 | 0.96mi |
| 14290 Riverview St Unit 106 Detroit, MI | 1.0 | 1.0 | 550 | $695 | $1.26 | 43d | 1 | 1.01mi |
| 14290 Riverview St Unit 208 Detroit, MI | 1.0 | 1.0 | 550 | $845 | $1.54 | 43d | 1 | 1.01mi |
| 14838 Riverview St Unit 110 Detroit, MI | 1.0 | 1.0 | 550 | $845 | $1.54 | 43d | 1 | 1.04mi |
| 14272 Riverview St Unit 216 Detroit, MI | 1.0 | 1.0 | 550 | $795 | $1.45 | 43d | 1 | 1.04mi |
| 14272 Riverview St Apt 213 Detroit, MI | 1.0 | 1.0 | 550 | $845 | $1.54 | 43d | 1 | 1.04mi |
| 14272 Riverview St Unit 214 Detroit, MI | 1.0 | 1.0 | 550 | $695 | $1.26 | 43d | 1 | 1.04mi |
| 14242 Riverview St Unit 215 Detroit, MI | 1.0 | 1.0 | 550 | $795 | $1.45 | 43d | 1 | 1.04mi |
| 14242 Riverview St Apt 218 Detroit, MI | 1.0 | 1.0 | 550 | $845 | $1.54 | 43d | 1 | 1.04mi |
| 24244 Dale St Unit 211 Detroit, MI | 1.0 | 1.0 | 550 | $800 | $1.45 | 24d | 1 | 1.04mi |
| 14281 Riverview St Unit 116 Detroit, MI | 1.0 | 1.0 | 550 | $800 | $1.45 | 43d | 1 | 1.05mi |
| 14245 Riverview St Detroit, MI | 2.0 | 1.0 | 750 | $985 | $1.31 | 43d | 1 | 1.05mi |
| 14281 Riverview St Unit 113 Detroit, MI | 1.0 | 1.0 | 550 | $845 | $1.54 | 43d | 1 | 1.05mi |
| 14281 Riverview St Unit 115 Detroit, MI | 1.0 | 1.0 | 550 | $695 | $1.26 | 43d | 1 | 1.05mi |
| 14281 Riverview St Unit 213 Detroit, MI | 1.0 | 1.0 | 550 | $795 | $1.45 | 43d | 1 | 1.05mi |
| 14281 Riverview St Unit 216 Detroit, MI | 1.0 | 1.0 | 550 | $795 | $1.45 | 14d | 1 | 1.05mi |
| 14244 Dale St Unit 212 Detroit, MI | 1.0 | 1.0 | 550 | $695 | $1.26 | 43d | 1 | 1.06mi |
| 24651 W McNichols Rd Detroit, MI | 1.0 | 1.0 | 700 | $800 | $1.14 | 43d | 4 | 1.07mi |
| 14220 Dale St Unit 204 Detroit, MI | 1.0 | 1.0 | 550 | $795 | $1.45 | 43d | 1 | 1.07mi |
| 14220 Dale St Unit 105 Detroit, MI | 1.0 | 1.0 | 550 | $695 | $1.26 | 43d | 1 | 1.07mi |
| 14220 Dale St Apt 106 Detroit, MI | 1.0 | 1.0 | 550 | $800 | $1.45 | 43d | 1 | 1.07mi |
| 14242 Riverview St Unit 118 Detroit, MI | 1.0 | 1.0 | 550 | $800 | $1.45 | 43d | 1 | 1.08mi |
| 14221 Riverview St Apt 102 Detroit, MI | 1.0 | 1.0 | 550 | $800 | $1.45 | 43d | 1 | 1.10mi |
| 14221 Riverview St Apt 201 Detroit, MI | 1.0 | 1.0 | 550 | $845 | $1.54 | 43d | 1 | 1.10mi |
| 14221 Riverview St Unit 203 Detroit, MI | 1.0 | 1.0 | 550 | $695 | $1.26 | 43d | 1 | 1.10mi |
| 14221 Riverview St Unit 104 Detroit, MI | 1.0 | 1.0 | 550 | $795 | $1.45 | 43d | 1 | 1.10mi |
| 14075 Riverview St Detroit, MI | 1.0–2.0 | 1.0 | 925 | $845 | $0.91 | 43d | 1 | 1.10mi |
| 14220 Riverview St Apt 102 Detroit, MI | 1.0 | 1.0 | 500 | $845 | $1.69 | 43d | 1 | 1.10mi |
| 14220 Riverview St Unit 201 Detroit, MI | 1.0 | 1.0 | 500 | $800 | $1.60 | 43d | 1 | 1.10mi |
| 14220 Riverview St Unit 206 Detroit, MI | 1.0 | 1.0 | 550 | $695 | $1.26 | 43d | 1 | 1.10mi |
| 14220 Riverview St Unit 202 Detroit, MI | 1.0 | 1.0 | 550 | $795 | $1.45 | 24d | 1 | 1.10mi |
| 14220 Riverview St Apt 101 Detroit, MI | 1.0 | 1.0 | 550 | $845 | $1.54 | 24d | 1 | 1.10mi |
| 14179 Riverview St Unit 219 Detroit, MI | 1.0 | 1.0 | 750 | $845 | $1.13 | 43d | 1 | 1.11mi |
| 14216 Riverview St Detroit, MI | 1.0 | 1.0 | 750 | $950 | $1.27 | 43d | 1 | 1.13mi |
| 14208 Riverview St Detroit, MI | 1.0 | 1.0 | 750 | $985 | $1.31 | 43d | 1 | 1.13mi |
| 14204 Riverview St Detroit, MI | 1.0 | 1.0 | 750 | $895 | $1.19 | 43d | 1 | 1.13mi |
| 14212 Riverview St Detroit, MI | 1.0 | 1.0 | 750 | $900 | $1.20 | 43d | 1 | 1.13mi |
| 14200 Riverview St Detroit, MI | 1.0 | 1.0 | 750 | $895 | $1.19 | 43d | 1 | 1.13mi |
| 14147 Riverview St Unit 213 Detroit, MI | 1.0 | 1.0 | 550 | $695 | $1.26 | 43d | 1 | 1.14mi |
| 14147 Riverview St Unit 111 Detroit, MI | 1.0 | 1.0 | 550 | $845 | $1.54 | 43d | 1 | 1.14mi |
HOA detail condo
- Monthly dues
- $337 · $4,044/yr
- Likely covers
- watertrashsnow removal
- Assessments
- None detected in remarks — confirm with the listing agent.
Listing history 50 events
-
2026-06-18days on market $53,000 Active 57 DOM
-
2026-06-17days on market $53,000 Active 56 DOM
-
2026-06-16days on market $53,000 Active 55 DOM
-
2026-06-15days on market $53,000 Active 54 DOM
-
2026-06-13days on market $53,000 Active 52 DOM
-
2026-06-13days on market $53,000 Active 51 DOM
-
2026-06-09days on market $53,000 Active 48 DOM
-
2026-06-08days on market $53,000 Active 47 DOM
-
2026-06-07days on market $53,000 Active 46 DOM
-
2026-06-04days on market $53,000 Active 43 DOM
-
2026-06-03days on market $53,000 Active 42 DOM
-
2026-06-02days on market $53,000 Active 41 DOM
-
2026-06-01days on market $53,000 Active 40 DOM
-
2026-05-31days on market $53,000 Active 39 DOM
-
2026-04-22$55,000 Active 302-char remark
Show marketing remark (302 chars)
Private enclosed courtyard entrance for your safety and quite enjoyment. Ground floor. hardwood floors, stove, refrigerator, basement with common washer and dryer and storage space. Rent includes heat, water, snow removal, trash pickup and building maintenance. Private parking space and guest parking.
-
2026-04-22$55,000 Active
Show marketing remark (302 chars)
Private enclosed courtyard entrance for your safety and quite enjoyment. Ground floor. hardwood floors, stove, refrigerator, basement with common washer and dryer and storage space. Rent includes heat, water, snow removal, trash pickup and building maintenance. Private parking space and guest parking.
-
2026-04-06historical
-
2026-04-06historical
-
2026-02-17$1,200
-
2026-02-10price $52,000
-
2026-02-09price $52,000
-
2026-02-02historical $1,250
-
2025-12-09status Active
-
2025-12-08historical
-
2025-12-01price $55,000
-
2025-12-01price $55,000
-
2025-11-12status Active
-
2025-11-11historical
-
2025-11-01price $1,250
-
2025-11-01price $59,900
-
2025-10-31price $59,900
-
2025-10-09$1,350
-
2025-10-09historical $1,350
-
2025-10-04$1,350
-
2025-09-05$65,000 Active
-
2025-09-05$65,000 Active
-
2018-10-11soldstatus $24,500 Sold
-
2018-10-11soldstatus $24,500 Closed
-
2018-10-09status Pending
-
2018-10-09status Pending
-
2018-09-20status Active
-
2018-09-20status Active
-
2018-08-05status Pending
-
2018-08-03status Pending
-
2018-07-31$25,000 Active
-
2018-07-31$25,000 Active
-
2011-12-19soldstatus $6,250
-
2011-12-19soldstatus $6,250
-
2011-11-23historical
-
2011-10-11$6,500
ⓘ Source: listings_history table (triggers on properties + properties_extension) + one-shot
backfill from property_details.listing_events for pre-trigger history.
Tax reassessment forecast MI · Partial reset (capped growth)
- Current annual tax
- $562 · $47/mo
- Projected year-2 tax
- $689 · $57/mo
- Expected delta
- +$127/yr (+$11/mo · 22.7%)
ⓘ Screening estimate from a state-policy table — verify with the county assessor before closing.
Nearby sold comps map
Loading sold comps map…
Walkable amenities ~0.75 mi
Loading nearby amenities…
Taxation est. · year 1
- Rental income
- $10,949
- − Mortgage interest
- −$2,969
- − Property taxes
- −$562
- − Insurance
- −$265
- − Repairs & maintenance
- −$876
- − Management
- −$876
- − HOA
- −$4,044
- − Depreciation
- −$1,542
- Taxable loss
- −$184
- Est. tax savings @ 24.0%
- +$44
- After-tax cash flow
- $488/yr
For passive investors: Depreciation is non-cash, so a rental often shows a tax loss while cash-flowing — sheltering income. Rental losses are passive: they offset passive income freely, and up to $25,000/yr can offset ordinary (W-2) income if you actively participate and your MAGI is under $100k (phasing out to $0 by $150k); unused losses carry forward. On sale, claimed depreciation is recaptured at up to 25%, and gains may owe capital-gains tax (a 1031 exchange can defer both). Figures are a year-1 estimate at your 24.0% rate — not tax advice; consult a CPA.
Schools (NCES district)
- District
- Redford Union Schools District No. 1
- NCES district ID
- 2629460
- Math proficiency
- 8% ▼ -6.00%
- Reading proficiency
- 23% ▬ 0.00%
- Median HH income
- $49,778
- Composite
- 14.1/100
- National rank
- #9460
- State rank
- #489 of 540 in MI
Livability — Redford
No livability data for this city. (Only ~50 U.S. cities are tracked.)
Census & demographics
- County
- Wayne County · 1,562,939 people
- City population
- 56,806
- Metro
- Detroit-Warren-Dearborn, MI
- Population (ZIP)
- 36,976
- Household income
- $71,151
- Rent vs Own
- Severe rent burden
- 1052.0
Population outlook (Wayne County) Hauer SSP2
- Today (2025)
- 1,675,273 people
- By 2030
- 1,620,300 · -3.3%
- By 2040
- 1,502,341 · -10.3%
- By 2050
- 1,384,039 · -17.4%
- By 2075
- 1,124,592 · -32.9%
- By 2100
- 881,193 · -47.4%
Race, ethnicity, and origin ACS 2023
- Neighborhood character
- Majority Black (58%)
- Race & ethnicity
- Black 58% White 34% Hispanic / Latino 4% Two or more races 4%
- Common ancestry
- Romanian 7% Slovak 2% Lithuanian 2%
- Foreign-born
- 2% · Canada
- Languages at home
- 96% English-only · Spanish 1% Other Indo-European 1% Arabic 1%
Political lean MEDSL · Wayne
- 2024 margin
- Strong D (+29.0) · D 62.7% · R 33.7% · Other 3.6%
- 2008→2024 swing
- -20.5pp toward R · 2008: 49.5pp · 2024: 29.0pp
- All cycles
- 2024: D+29.0 2020: D+38.1 2016: D+37.3 2012: D+46.9 2008: D+49.5
Not yet ingested
- Civics
- —
Market trends
- HPI YoY
- ▼ -202.97%
- Current HPI
- 236.1136
- Rent YoY
- ▲ 3.25%
- Metro
- Detroit-Warren-Dearborn, MI
- State GDP YoY
- ▲ 1.37%
- F500 in state
- 28
Industry mix (Fortune 500 HQ in MI)
| Industry | F500 HQs | Revenue |
|---|---|---|
| Automotive Parts | 3 | $48B |
|
||
| Automotive | 2 | $372B |
|
||
| Chemicals | 1 | $45B |
|
||
| Automotive Retail | 1 | $29B |
|
||
| Healthcare / Medical Devices | 1 | $23B |
|
||
| Automotive Technology | 1 | $20B |
|
||
Price history
+746.2% since first listed37 events — show timeline
- 2026-04-22 Listed $55,000 REALCOMP
- 2026-04-22 Listed $55,000 MiRealSource-MiMLS
- 2026-04-06 Listing Removed — MiRealSource-MiMLS
- 2026-04-06 Listing Removed — REALCOMP
- 2026-02-17 Listed for Rent $1,200 REALSOURCE
- 2026-02-10 Price Changed $52,000 MiRealSource-MiMLS
- 2026-02-09 Price Changed $52,000 REALCOMP
- 2026-02-02 Rental Removed $1,250 REALSOURCE
- 2025-12-09 Relisted — REALCOMP
- 2025-12-08 Listing Removed — REALCOMP
- 2025-12-01 Price Changed $55,000 MiRealSource-MiMLS
- 2025-12-01 Price Changed $55,000 REALCOMP
- 2025-11-12 Relisted — REALCOMP
- 2025-11-11 Listing Removed — REALCOMP
- 2025-11-01 Price Changed $1,250 REALSOURCE
- 2025-11-01 Price Changed $59,900 MiRealSource-MiMLS
- 2025-10-31 Price Changed $59,900 REALCOMP
- 2025-10-09 Listed for Rent $1,350 REALSOURCE
- 2025-10-09 Rental Removed $1,350 REALCOMP
- 2025-10-04 Listed for Rent $1,350 REALCOMP
- 2025-09-05 Listed $65,000 REALCOMP
- 2025-09-05 Listed $65,000 MiRealSource-MiMLS
- 2018-10-11 Sold (MLS) $24,500 MiRealSource-MiMLS
- 2018-10-11 Sold (MLS) $24,500 REALCOMP
- 2018-10-09 Pending — MiRealSource-MiMLS
- 2018-10-09 Pending — REALCOMP
- 2018-09-20 Relisted — MiRealSource-MiMLS
- 2018-09-20 Relisted — REALCOMP
- 2018-08-05 Pending — MiRealSource-MiMLS
- 2018-08-03 Pending — REALCOMP
- 2018-07-31 Listed $25,000 MiRealSource-MiMLS
- 2018-07-31 Listed $25,000 REALCOMP
- 2011-12-19 Sold (MLS) $6,250 MiRealSource-MiMLS
- 2011-12-19 Sold (MLS) $6,250 REALCOMP
- 2011-11-23 Listing Removed — MiRealSource-MiMLS
- 2011-10-11 Listed $6,500 MiRealSource-MiMLS
- 2011-10-11 Listed $6,500 REALCOMP
Property tax history
-0.9%/yrLatest (2025): $562 · -42.8% YoY. Source: county tax records.
Cash-flow waterfall
monthlySold comps — $/sqft
last 12 mo · ≤1 miLoading sold comps…