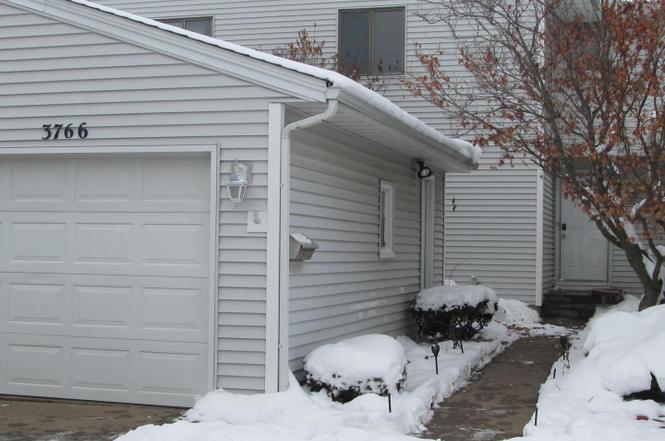
3766 Eastwood Ct · Bettendorf, IA
Flood risk 1/10 · Minimal
- FEMA flood zone
- X (unshaded)
- Chance of flooding over 30 yrs
- 0.0%
- Est. flood insurance / yr
- $473 – $860
Fire risk 1/10 · Minimal
- Est. fire insurance / yr
- $902 – $1,676
Heat risk 3/10 · Minor
- Hot days now (above 103°F)
- 7 days/yr
- Hot days in 30 yrs
- 16 days/yr
Wind risk 2/10 · Minimal
- Chance of severe wind over 30 yrs
- —
Air-quality risk 3/10 · Minor
- Unhealthy air days now
- 2 days/yr
- Unhealthy air days in 30 yrs
- 3 days/yr
Risk factors via First Street. Map © Google.
Why this score? — see what drove the B grade
The composite is a weighted blend of 9 inputs, each scored 0–100. Each bar is that input's sub-score; the figure is the points it added to the 100-point composite (weight × sub-score).
- Cash flow +29.4/30.0
- DSCR +10.0/10.0
- 1% rule +8.4/10.0
- Schools +7.6/10.0
- ARV discount +7.5/15.0
- Livability +4.0/5.0
- Rent growth +3.2/5.0
- Condition / age +2.5/5.0
- Appreciation +0.0/10.0
$160,000
🖨 Deal sheet 📄 Offer letter ✓ Due diligence
Listing remarks MLS
VERY NICE THREE BEDROOM CONDO WITH FINISHED LOWER LEVEL. LANDSCAPED & FENCED BACKYARD WITH PATIO. ASSOCIATION POOL AND TENNIS COURT. ON A QUIET 'NO OUTLET' STREET. SIDING NEW IN 2007. A/C NEW IN 2005 PER SELLER. NEW REAR FENCE IN 2008. FIREPLACE NOT WARRANTED.
Key facts
- Garage
- Built 1977
Neighborhood map
What this means for you Summary
Snapshot
- This is a 3-bed/1.5-bath townhouse listed at $160k.
Deal economics
- At list price, monthly cash flow is $568 ($7k/yr) — positive.
- The deal already cash-flows at list — no discount required.
- Meets the 1% rule at list price ($2k rent vs $160k).
- Cap rate 10.6% vs local median 3.0% in Bettendorf — top-decile yield for the area; either an underpriced asset or a hidden risk that comps aren't pricing in. Stress-test before assuming the spread holds.
Location & tenants
- Location reads 81/100 on livability (#73 in IA, #1,579 nationally) — a professional / high-income tenant draw. Strengths: crime A+, employment A+, housing A+; Watch: amenities F, commute F.
- Pleasant Valley Community School District (suburban): math 87% / reading 85% proficiency, ranked #5 of 289 in IA (top 2%) — strong family-tenant draw, lease renewals of 3-5y typical; only 8% free/reduced lunch — higher-income household profile.
- Zoned schools: Pleasant Valley High School (math 83% / reading 87%, grade A, #12 of 336 statewide, top 4%, 1,658 students, 11% FRL) — zoned schools at 11% FRL track the district average.
- Market conditions: Rents rising (+2.9%/yr); 426 active listings in the ZIP; 13 comparable units currently listed for rent nearby; rentals leasing fast (median 14d on market — plan ~1-2 weeks tenant-placement turnaround); solid renter incomes; 805 units permitted in Scott County in 2024 (479 in 5+ unit buildings).
Forward outlook
- Local home prices are declining (-3.0%/yr); year-one equity from $1k of loan paydown is wiped out by about $5k of value loss. Plan a longer hold.
- Scott County population projected at +19% by 2050 — long-run rental-demand tailwind backs the buy-and-hold thesis.
- At projected returns (-3.0% appreciation + 2.9% rent growth), your $45k cash investment doubles in ~8 years — after that, you're playing with house money.
Negotiation context
- Only 0 days on market — expect competitive offers; lowballing is unlikely to land.
- 4 sale attempts since 18y ago with the ask held roughly flat each time — persistent listings suggest the price (not the market) is what's stuck; bring a comps-based counter.
Questions for the listing agent
- Built in 1977 — when were the roof, HVAC, electrical panel, plumbing, and water heater last replaced?
- Is there a deadline driving the sale (1031 exchange, divorce, estate, relocation)? That informs how much negotiation room exists.
- Schools are A-rated — typically a magnet for longer-tenancy family renters. What's the average tenant stay here, and is there a school-zone premium baked into asking?
- What's the average days-on-market for RENTAL listings here right now (not sales)? A rising rental-DOM trend means longer vacancies and softer asking-rent achievability than the comps imply.
- What's the recent tenant-quality profile in this submarket — average credit score on applications, eviction rate, late-payment / NSF rate, and stable-employment percentage? A property-management company in the area should have these aggregated.
- How much new for-sale + rental construction is in the pipeline within 1–3 miles? Heavy new supply typically softens prices + rents 12–24 months out; constrained supply supports both.
Investment metrics
- 1% rule
- 1.34% ✓
- Cap rate
- 10.55%
- Cash-on-cash
- 15.22%
- DSCR
- 1.68
- GRM
- 6.2
CMA / ARV
- ARV (on-the-fly)
- $360,772
- Comps found
- 12
Show comp detail 12 sales within ~0.75 mi
| Address | Dist | Beds/Ba | Sqft | Sold | Price | $/sf | Match |
|---|---|---|---|---|---|---|---|
| 3075 Willowwood Dr | 0.19mi | 2/2.5 (-1) | 1,752 (-2%) | 4mo | $212,500 | $121 | 76 |
| 3750 Eastwood Ct | 0.01mi | 2/2.5 (-1) | 1,536 (-14%) | 4mo | $248,000 | $161 | 64 |
| 3970 Orchard Dr | 0.49mi | 3/2.5 | 1,850 (+4%) | 4mo | $350,000 | $189 | 64 |
| 3988 Partridge Cir | 0.19mi | 3/3.0 | 1,597 (-11%) | 5mo | $310,000 | $194 | 64 |
| 3826 Orchard Dr | 0.48mi | 3/2.5 | 1,850 (+4%) | 6mo | $374,105 | $202 | 63 |
| 3820 Orchard Dr | 0.47mi | 3/2.5 | 1,850 (+4%) | 7mo | $361,770 | $196 | 62 |
| 3814 Orchard Dr | 0.47mi | 3/2.5 | 1,850 (+4%) | 7mo | $360,770 | $195 | 62 |
| 3439 Maple Glen Dr | 0.27mi | 2/2.0 (-1) | 1,629 (-9%) | 7mo | $350,000 | $215 | 60 |
| 3408 Crowne Pointe Cir | 0.68mi | 3/2.5 | 1,705 (-4%) | 8mo | $427,000 | $250 | 50 |
| 3463 Maple Glen Dr | 0.35mi | 2/3.0 (-1) | 1,557 (-13%) | 8mo | $325,000 | $209 | 44 |
| 2525 Saint Johns Ct | 0.62mi | 3/2.5 | 1,618 (-9%) | 11mo | $332,000 | $205 | 42 |
| 2525 Eastberry Ct | 0.70mi | 4/3.5 (+1) | 1,744 (-2%) | 11mo | $367,900 | $211 | 41 |
Match score weights: distance 35% · size 25% · config 20% · recency 20%. Top-matched comps best support the ARV.
Projected returns pro-forma
-3.0% appreciation · 2.88% rent growth · sell at horizon
- IRR
- 5.8%
- Equity multiple
- 1.22×
- Total profit
- $10,042
- Equity at exit
- $23,857
- IRR
- 15.1%
- Equity multiple
- 2.22×
- Total profit
- $54,460
- Equity at exit
- $13,834
Cash invested: $44,800 (down + closing). Projections, not guarantees.
Landlord ↔ Tenant lean methodology
- Overall (STATE)
- 83 Strongly Landlord-Friendly
- State Iowa
- 83 Strongly Landlord-Friendly · R+6
- County
- — inherits STATE
- City
- — inherits STATE
ZIP-level market 52722
- Rents YoY
- 2.9%
- Active inventory
- 426
- Price-to-rent
- 6.2×
Monthly cashflow live
- Estimated rent
- $2,145 high interval (Pro) →
- Mortgage (P&I)
- −$839
- Tax from tax record
- −$221 /mo · $2,648/yr
- Insurance
- −$67
- HOA
- −$0
- Vacancy / Maint / Mgmt
- −$450
- Net cashflow
- $568
Break-even live
UW: 25.0% down · 7.5% · 30yr · 1.5% tax · 5.0% vac · 8.0% maint · 8.0% mgmt
Financing live
Cash to close
- Down payment
- $40,000
- Closing costs
- $4,800
- Reserves months
- —
- Total cash needed
- —
Loan-product check · same deal, 3 products live
Conventional
25% down · 7.5% · 30yr
- Down + closing
- —
- Monthly P&I
- —
- Monthly cashflow
- —
- DSCR
- —
- Eligible?
- —
Personal DTI + credit; lowest rate.
DSCR
20% down · 8.5% · 30yr
- Down + closing
- —
- Monthly P&I
- —
- Monthly cashflow
- —
- DSCR
- —
- Eligible?
- —
No personal income docs; deal must DSCR.
Hard money
10% down · 12.0% · 12mo
- Down + closing
- —
- Monthly P&I
- —
- Monthly cashflow
- —
- DSCR
- —
- Eligible?
- —
Short-term bridge; refi at stabilization.
Rent comps 13 comps
| Address | Beds | Baths | Sqft | Rent | $/sqft | DOM | Units | Dist |
|---|---|---|---|---|---|---|---|---|
| 3060 Parkwild Dr Unit 1 Bettendorf, IA | 3.0 | 2.5 | 1500 | $2,100 | $1.40 | 13d | 1 | 0.21mi |
| 3635 Tanglewood Rd Bettendorf, IA | 3.0 | 2.5 | 1600 | $2,295 | $1.43 | 13d | 1 | 0.34mi |
| 3851 Tanglefoot Ln Bettendorf, IA | 3.0–4.0 | 2.5–3.5 | 1800 | $2,345 | $1.30 | 13d | 1 | 0.36mi |
| 2900 Middle Rd Bettendorf, IA | 1.0–3.0 | 1.0–2.0 | 996 | $1,741 | $1.75 | 13d | 27 | 0.53mi |
| 3939 53rd Ave Bettendorf, IA | 3.0 | 1.0–2.0 | 951 | $2,035 | $2.14 | 13d | 29 | 0.97mi |
| 3129 Windsor Dr Bettendorf, IA | 4.0 | 1.5 | 1440 | $2,500 | $1.74 | 21d | 1 | 1.01mi |
| 3054 Cherrywood Dr Unit 3054 Bettendorf, IA | 3.0 | 3.5 | 1754 | $2,800 | $1.60 | 13d | 1 | 1.04mi |
| 5472 Devils Glen Rd Bettendorf, IA | 1.0–3.0 | 1.0–3.0 | 1141 | $2,085 | $1.83 | 13d | 2 | 1.20mi |
| 5472 Devils Glen Rd Bettendorf, IA | 2.0–3.0 | 2.0–3.0 | 1293 | $2,085 | $1.61 | 43d | 2 | 1.20mi |
| 5294 Pandit Dr Bettendorf, IA | 3.0 | 3.5 | 2133 | $2,900 | $1.36 | 43d | 1 | 1.21mi |
| 5101 Lakeview Pkwy Davenport, IA | 3.0–4.0 | 2.5–3.5 | 1800 | $2,370 | $1.32 | 13d | 6 | 1.26mi |
| 4833 Lauren Ln Bettendorf, IA | 2.0 | 2.5 | 1575 | $2,100 | $1.33 | 43d | 1 | 1.38mi |
| 5320 Addyson Dr Bettendorf, IA | 3.0 | 3.0 | 2300 | $2,950 | $1.28 | 43d | 1 | 1.50mi |
Listing history 20 events
-
2026-05-24status Pending
-
2026-05-24status Pending
-
2026-05-22status Pending
-
2026-04-17soldstatus $155,000
-
2026-02-13soldstatus $155,000 Closed
-
2026-02-13soldstatus $155,000 Closed
-
2026-02-13soldstatus $155,000 Closed
-
2026-02-13soldstatus $155,000 Closed
-
2026-01-08status Pending
-
2026-01-05historical
-
2025-12-16status Pending
-
2025-12-08historical
-
2025-12-08historical
-
2025-12-03$160,000
-
2025-12-03Active
-
2009-04-09soldstatus $102,500
-
2009-04-06soldstatus $102,500 264-char remark
Show marketing remark (264 chars)
VERY NICE THREE BEDROOM CONDO WITH FINISHED LOWER LEVEL. LANDSCAPED & FENCED BACKYARD WITH PATIO. ASSOCIATION POOL AND TENNIS COURT. ON A QUIET 'NO OUTLET' STREET. SIDING NEW IN 2007. A/C NEW IN 2005 PER SELLER. NEW REAR FENCE IN 2008. FIREPLACE NOT WARRANTED.
-
2008-03-03$114,900 264-char remark
Show marketing remark (264 chars)
VERY NICE THREE BEDROOM CONDO WITH FINISHED LOWER LEVEL. LANDSCAPED & FENCED BACKYARD WITH PATIO. ASSOCIATION POOL AND TENNIS COURT. ON A QUIET 'NO OUTLET' STREET. SIDING NEW IN 2007. A/C NEW IN 2005 PER SELLER. NEW REAR FENCE IN 2008. FIREPLACE NOT WARRANTED.
ⓘ Source: listings_history table (triggers on properties + properties_extension) + one-shot
backfill from property_details.listing_events for pre-trigger history.
Tax reassessment forecast IA · Partial reset (capped growth)
- Current annual tax
- $2,648 · $221/mo
- Projected year-2 tax
- $2,648 · $221/mo
- Expected delta
- $0/yr ($0/mo · 0.0%)
ⓘ Screening estimate from a state-policy table — verify with the county assessor before closing.
Climate risk First Street
- Flood 1/10 Low FEMA zone X (unshaded) · 0% chance over 30 yrs
- Wildfire 1/10 Low
- Heat 3/10 Moderate 7 d/yr ≥103°F today · 16 d/yr by 30 yrs out
- Wind 2/10 Low
- Air quality 3/10 Moderate 2 unhealthy d/yr today · 3 by 30 yrs out
Nearby sold comps map
Loading sold comps map…
Walkable amenities ~0.75 mi
Loading nearby amenities…
Taxation est. · year 1
- Rental income
- $25,739
- − Mortgage interest
- −$8,962
- − Property taxes
- −$2,648
- − Insurance
- −$800
- − Repairs & maintenance
- −$2,059
- − Management
- −$2,059
- − Depreciation
- −$4,655
- Taxable income
- $4,556
- Est. tax owed @ 24.0%
- −$1,093
- After-tax cash flow
- $5,724/yr
For passive investors: Depreciation is non-cash, so a rental often shows a tax loss while cash-flowing — sheltering income. Rental losses are passive: they offset passive income freely, and up to $25,000/yr can offset ordinary (W-2) income if you actively participate and your MAGI is under $100k (phasing out to $0 by $150k); unused losses carry forward. On sale, claimed depreciation is recaptured at up to 25%, and gains may owe capital-gains tax (a 1031 exchange can defer both). Figures are a year-1 estimate at your 24.0% rate — not tax advice; consult a CPA.
Schools (NCES district)
- District
- Pleasant Valley Community School District
- NCES district ID
- 1923110
- Math proficiency
- 87% ▼ -4.00%
- Reading proficiency
- 85% ▼ -2.00%
- Median HH income
- $80,716
- Composite
- 75.59/100
- National rank
- #130
- State rank
- #5 of 289 in IA
Livability — Bettendorf
- Score
- 81/100
- State rank
- #73
- US rank
- #1579
Category grades
Schools grade is shown separately in the Schools card above.
Census & demographics
- Census place
- Bettendorf, IA
- County
- Scott County · 144,583 people
- City population
- 41,264
- Metro
- Davenport-Moline-Rock Island, IA-IL
- Population (ZIP)
- 41,264
- Household income
- $101,546
- Rent vs Own
- Severe rent burden
- 935.0
Population outlook (Scott County) Hauer SSP2
- Today (2025)
- 188,878 people
- By 2030
- 196,648 · +4.1%
- By 2040
- 210,860 · +11.6%
- By 2050
- 224,359 · +18.8%
- By 2075
- 258,884 · +37.1%
- By 2100
- 286,447 · +51.7%
Race, ethnicity, and origin ACS 2023
- Neighborhood character
- Predominantly White (82%)
- Race & ethnicity
- White 82% Asian 7% Two or more races 7% Hispanic / Latino 5% Black 2%
- Common ancestry
- Portuguese 3% Italian 3% Romanian 2%
- Foreign-born
- 7% · Canada, China, Vietnam
- Languages at home
- 92% English-only · Other Asian/Pacific 2% Spanish 2% Other Indo-European 1%
Political lean MEDSL · Scott
- 2024 margin
- Toss-up / Even · D 47.3% · R 51.2% · Other 1.4%
- 2008→2024 swing
- -18.4pp toward R · 2008: 14.6pp · 2024: -3.9pp
- All cycles
- 2024: R+3.9 2020: D+3.5 2016: D+1.4 2012: D+13.8 2008: D+14.6
Not yet ingested
- Civics
- —
Market trends
- HPI YoY
- ▼ -111.45%
- Current HPI
- 194.8355
- Rent YoY
- ▲ 2.88%
- Metro
- Davenport-Moline-Rock Island, IA-IL
- State GDP YoY
- ▲ 2.48%
- F500 in state
- 4
Industry mix (Fortune 500 HQ in IA)
| Industry | F500 HQs | Revenue |
|---|---|---|
| Financial Services | 1 | $16B |
|
||
| Retail / Convenience | 1 | $15B |
|
||
Price history
+34.9% since first listed20 events — show timeline
- 2026-05-24 Pending — MRED as Distributed by MLS Grid
- 2026-05-24 Pending — MRED as Distributed by MLS Grid
- 2026-05-22 Pending — MRED as Distributed by MLS Grid
- 2026-04-17 Sold (Public Records) $155,000 Public Records
- 2026-02-13 Sold (MLS) $155,000 MRED as Distributed by MLS Grid
- 2026-02-13 Sold (MLS) $155,000 MRED as Distributed by MLS Grid
- 2026-02-13 Sold (MLS) $155,000 MRED as Distributed by MLS Grid
- 2026-02-13 Sold (MLS) $155,000 MRED as Distributed by MLS Grid
- 2026-01-08 Pending — MRED as Distributed by MLS Grid
- 2026-01-05 Listing Removed — MRED as Distributed by MLS Grid
- 2025-12-16 Pending — RMLSA as Distributed by MLS Grid
- 2025-12-08 Listing Removed — RMLSA as Distributed by MLS Grid
- 2025-12-08 Listing Removed — MRED as Distributed by MLS Grid
- 2025-12-03 Listed — RMLSA as Distributed by MLS Grid
- 2025-12-03 Listed $160,000 MRED as Distributed by MLS Grid
- 2009-04-09 Sold (Public Records) $102,500 Public Records
- 2009-04-06 Sold (MLS) $102,500 RMLSA as Distributed by MLS Grid
- 2009-04-06 Sold (MLS) $102,500 MRED as Distributed by MLS Grid
- 2008-03-03 Listed $114,900 RMLSA as Distributed by MLS Grid
- 2008-03-03 Listed $114,900 MRED as Distributed by MLS Grid
Property tax history
+2.3%/yrLatest (2025): $2,648 · -5.1% YoY. Source: county tax records.
Cash-flow waterfall
monthlySold comps — $/sqft
last 12 mo · ≤1 miLoading sold comps…