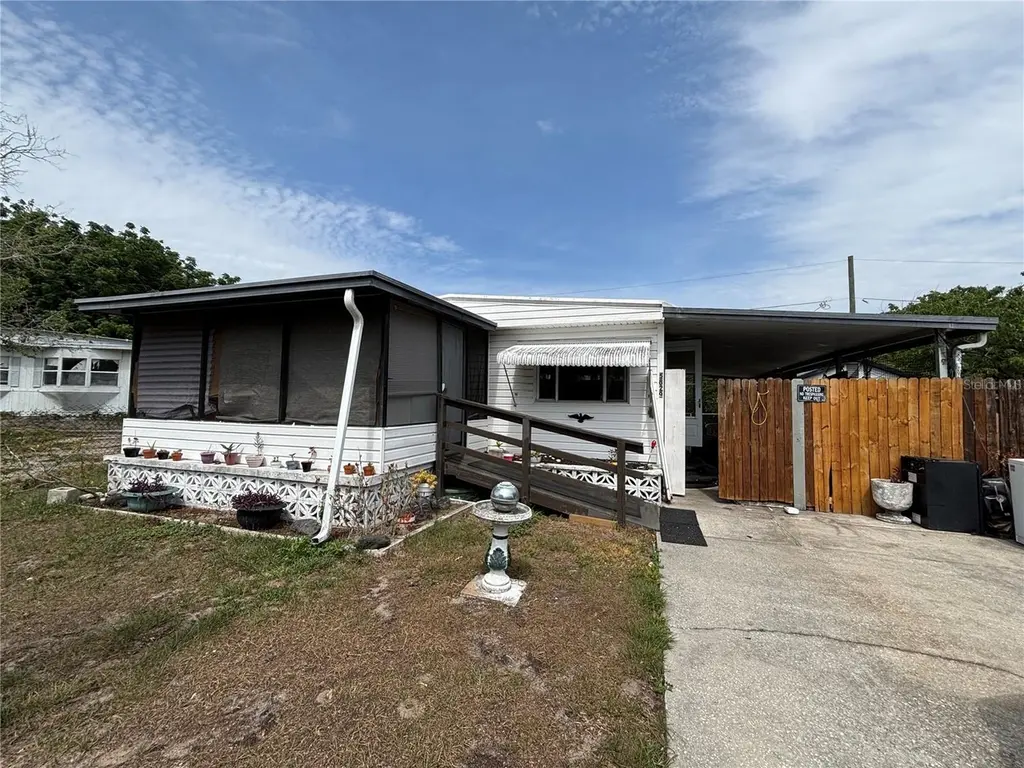
5829 Sunshine Park Dr · Elfers, FL
Flood risk 1/10 · Minimal
- FEMA flood zone
- X (unshaded)
- Chance of flooding over 30 yrs
- 0.0%
- Est. flood insurance / yr
- $507 – $1,088
Fire risk 1/10 · Minimal
- Est. fire insurance / yr
- $947 – $1,759
Heat risk 10/10 · Severe
- Hot days now (above 108°F)
- 7 days/yr
- Hot days in 30 yrs
- 27 days/yr
Wind risk 10/10 · Severe
- Chance of severe wind over 30 yrs
- 99.0%
Air-quality risk 2/10 · Minimal
- Unhealthy air days now
- 1 days/yr
- Unhealthy air days in 30 yrs
- 1 days/yr
Risk factors via First Street. Map © Google.
Why this score? — see what drove the B+ grade
The composite is a weighted blend of 9 inputs, each scored 0–100. Each bar is that input's sub-score; the figure is the points it added to the 100-point composite (weight × sub-score).
- Cash flow +30.0/30.0
- ARV discount +15.0/15.0
- 1% rule +10.0/10.0
- DSCR +10.0/10.0
- Schools +4.3/10.0
- Livability +3.9/5.0
- Rent growth +2.7/5.0
- Condition / age +2.5/5.0
- Appreciation +0.0/10.0
$65,000
🖨 Deal sheet 📄 Offer letter ✓ Due diligence
Listing remarks
SOLD AS IS!! NO HOA AND YOU OWN THE LAND!! This is a CASH ONLY SALE!! 2 bed, 2 bath. Roof seems to be original. HVAC 2014. Water Heater 2021. Located in a community that has NO HOA!! Property has no rear neighbors. Subflooring solid throughout but some weak spots noticeable in the Primary Bedroom. Plenty of space between both of your neighbors. Property is fenced in. NO FLOOD ZONE.
Key facts
- No rear neighbors
- Fenced in
- Own the land
Tags
Property features AI
Finance
- Other: Property type: Residential; Property subtype: Mobile Home; Zoning: RMH; Lot approximately 0.12 acres (about 0 to less than 1/4 acre)
- Financial info: Lease restrictions apply
- HOA & community: No HOA/association indicated
Exterior
- Parking: Carport (2 spaces)
- Utilities: Public water; Public sewer; Water connected
- Home design: Residential mobile home; Double wide; Single-story; Facing west; Entry level: One
- Construction: Vinyl siding; Other roof
- Exterior features: Exterior lighting; Chain-link fence; Paved road access
Interior
- Kitchen: No appliances included
- Bedrooms: 2 bedrooms
- Flooring: Other flooring
- Bathrooms: 2 full bathrooms
- Heating & cooling: Central heating (electric); Central air conditioning
- Interior features: Ceiling fan(s); Other interior features
- Laundry & utility: Other laundry features
Neighborhood map
What this means for you Summary
Snapshot
- This is a 3-bed/2.0-bath manufactured listed at $65k.
Deal economics
- At list price, monthly cash flow is $715 ($9k/yr) — positive.
- The deal already cash-flows at list — no discount required.
- Meets the 1% rule at list price ($2k rent vs $65k).
- Recommended offer: $63k (3.0% below list) — sets the bar for market timing.
- Cap rate 19.5% vs local median 4.7% in Elfers — top-decile yield for the area; either an underpriced asset or a hidden risk that comps aren't pricing in. Stress-test before assuming the spread holds.
Location & tenants
- Location reads 78/100 on livability (#167 in FL, #2,486 nationally) — a middle-class / working-renter tenant base. Strengths: cost of living A+, housing A+, health & safety A+; Watch: crime C-, employment D+, amenities D-.
- Pasco (suburban): math 50% / reading 52% proficiency, ranked #32 of 73 in FL (top 44%) — acceptable for families but not a draw, mixed tenant base, ~2y average lease.
- Market conditions: Rents flat; 635 active listings in the ZIP; 40 comparable units currently listed for rent nearby; rentals at typical pace (median 22d on market — plan ~3-4 weeks tenant-placement turnaround); 6,765 units permitted in Pasco County in 2024 (1,250 in 5+ unit buildings).
- This rent runs 32% of the median local income ($57k/yr) — at the standard rent-burdened threshold; future hikes will face affordability resistance.
Forward outlook
- Local home prices are declining (-3.0%/yr); year-one equity from $449 of loan paydown is wiped out by about $2k of value loss. Plan a longer hold.
- Pasco County population projected at +29% by 2050 — long-run rental-demand tailwind backs the buy-and-hold thesis.
- At projected returns (-3.0% appreciation + 0.7% rent growth), your $18k cash investment doubles in ~3 years — after that, you're playing with house money.
Negotiation context
- It's been on market 38 days — a 3% lower offer ($63k) is reasonable based on typical stale-listing flexibility.
Risks & watch-outs
- Climate carrying-cost: severe wind risk, 99% chance of damaging wind over 30y; extreme-heat days projected 7→27/yr by 2055 (HVAC capex compounding) — expect insurance premiums to compound above CPI over the hold.
Questions for the listing agent
- It's been on market 38 days. Have you received any prior offers? Is the seller open to a 3% concession, seller financing, or rate buy-down credit?
- Built in 1972 — when were the roof, HVAC, electrical panel, plumbing, and water heater last replaced?
- Is there a deadline driving the sale (1031 exchange, divorce, estate, relocation)? That informs how much negotiation room exists.
- What's the average days-on-market for RENTAL listings here right now (not sales)? A rising rental-DOM trend means longer vacancies and softer asking-rent achievability than the comps imply.
- What's the recent tenant-quality profile in this submarket — average credit score on applications, eviction rate, late-payment / NSF rate, and stable-employment percentage? A property-management company in the area should have these aggregated.
- How much new for-sale + rental construction is in the pipeline within 1–3 miles? Heavy new supply typically softens prices + rents 12–24 months out; constrained supply supports both.
Investment metrics
- 1% rule
- 2.36% ✓
- Cap rate
- 19.50%
- Cash-on-cash
- 47.16%
- DSCR
- 3.10
- GRM
- 3.5
CMA / ARV
- ARV (on-the-fly)
- $100,224
- Comps found
- 1
Show comp detail 1 sale within ~0.75 mi
| Address | Dist | Beds/Ba | Sqft | Sold | Price | $/sf | Match |
|---|---|---|---|---|---|---|---|
| 5824 Ashen Ave | 0.08mi | 3/2.0 | 816 (-6%) | 7mo | $95,000 | $116 | 81 |
Match score weights: distance 35% · size 25% · config 20% · recency 20%. Top-matched comps best support the ARV.
Projected returns pro-forma
-3.0% appreciation · 0.72% rent growth · sell at horizon
- IRR
- 41.8%
- Equity multiple
- 2.74×
- Total profit
- $31,641
- Equity at exit
- $9,692
- IRR
- 46.9%
- Equity multiple
- 5.01×
- Total profit
- $72,952
- Equity at exit
- $5,620
Cash invested: $18,200 (down + closing). Projections, not guarantees.
Landlord ↔ Tenant lean methodology
- Overall (STATE)
- 87 Strongly Landlord-Friendly
- State Florida
- 87 Strongly Landlord-Friendly · R+3
- County
- — inherits STATE
- City
- — inherits STATE
ZIP-level market 34652
- Home prices YoY
- -26.1%
- Rents YoY
- 0.7%
- Active inventory
- 635
- Price-to-rent
- 3.5×
Monthly cashflow live
- Estimated rent
- $1,532 high interval (Pro) →
- Mortgage (P&I)
- −$341
- Tax from tax record
- −$127 /mo · $1,527/yr
- Insurance
- −$27
- HOA
- −$0
- Vacancy / Maint / Mgmt
- −$322
- Net cashflow
- $715
Break-even live
UW: 25.0% down · 7.5% · 30yr · 1.5% tax · 5.0% vac · 8.0% maint · 8.0% mgmt
Financing live
Cash to close
- Down payment
- $16,250
- Closing costs
- $1,950
- Reserves months
- —
- Total cash needed
- —
Loan-product check · same deal, 3 products live
Conventional
25% down · 7.5% · 30yr
- Down + closing
- —
- Monthly P&I
- —
- Monthly cashflow
- —
- DSCR
- —
- Eligible?
- —
Personal DTI + credit; lowest rate.
DSCR
20% down · 8.5% · 30yr
- Down + closing
- —
- Monthly P&I
- —
- Monthly cashflow
- —
- DSCR
- —
- Eligible?
- —
No personal income docs; deal must DSCR.
Hard money
10% down · 12.0% · 12mo
- Down + closing
- —
- Monthly P&I
- —
- Monthly cashflow
- —
- DSCR
- —
- Eligible?
- —
Short-term bridge; refi at stabilization.
Rent comps 40 comps
| Address | Beds | Baths | Sqft | Rent | $/sqft | DOM | Units | Dist |
|---|---|---|---|---|---|---|---|---|
| 5844 Sunshine Park Dr New Port Richey, FL | 3.0 | 1.0 | 672 | $1,100 | $1.64 | 3d | 1 | 0.04mi |
| 6036 Chesham Dr #5 New Port Richey, FL | 2.0 | 1.5 | 825 | $1,275 | $1.55 | 5d | 1 | 0.29mi |
| 6141 Chesham Dr #8 New Port Richey, FL | 2.0 | 1.5 | 825 | $1,250 | $1.52 | 24d | 1 | 0.36mi |
| 6165 Chesham Dr #5 New Port Richey, FL | 2.0 | 1.5 | 825 | $1,500 | $1.82 | 24d | 1 | 0.44mi |
| 6165 Chesham Dr #9 New Port Richey, FL | 2.0 | 1.5 | 825 | $1,350 | $1.64 | 24d | 1 | 0.44mi |
| 6413 Sutters Mill Rd New Port Richey, FL | 3.0 | 2.0 | 1080 | $1,575 | $1.46 | 4d | 1 | 0.59mi |
| 4540 Audrey Ln New Port Richey, FL | 2.0 | 1.0 | 750 | $1,150 | $1.53 | 24d | 1 | 0.59mi |
| 4551 Audrey Ln NEW PRT RCHY, FL | 2.0 | 1.0 | 750 | $1,295 | $1.73 | 22d | 1 | 0.59mi |
| 4518 Audrey Ln Unit 4551 New Port Richey, FL | 2.0 | 1.0 | 750 | $1,295 | $1.73 | 22d | 1 | 0.61mi |
| 4529 Audrey Ln New Port Richey, FL | 2.0 | 1.0 | 750 | $1,295 | $1.73 | 22d | 1 | 0.62mi |
| 4746 Azalea Dr Apt 103C Port Richey, FL | 2.0 | 2.0 | 1008 | $1,220 | $1.21 | 24d | 1 | 0.66mi |
| 4548 Belfast Dr New Port Richey, FL | 3.0 | 1.0 | 1075 | $1,575 | $1.47 | 18d | 1 | 0.74mi |
| 6424 Spring Flower Dr #25 New Port Richey, FL | 2.0 | 1.5 | 835 | $1,175 | $1.41 | 24d | 1 | 0.75mi |
| 6424 Spring Flower Dr #25 New Port Richey, FL | 2.0 | 1.5 | 915 | $1,175 | $1.28 | 18d | 1 | 0.75mi |
| 5020 Vickers Dr New Port Richey, FL | 2.0 | 1.0 | 863 | $1,550 | $1.80 | 5d | 1 | 0.81mi |
| 4938 Azalea Dr New Port Richey, FL | 2.0 | 1.0 | 870 | $2,000 | $2.30 | 24d | 1 | 0.82mi |
| 4903 Myrtle Oak Dr #14 New Port Richey, FL | 2.0 | 2.0 | 935 | $1,250 | $1.34 | 24d | 1 | 0.82mi |
| 5227 Tangerine Dr New Port Richey, FL | 2.0 | 1.5 | 996 | $1,500 | $1.51 | 13d | 1 | 0.89mi |
| 4124 Flamingo Dr New Port Richey, FL | 3.0 | 1.0 | 744 | $1,500 | $2.02 | 4d | 1 | 0.99mi |
| 4124 Flamingo Dr New Port Richey, FL | 3.0 | 1.0 | 744 | $1,500 | $2.02 | 15d | 1 | 0.99mi |
| 4939 Floramar Ter New Port Richey, FL | 2.0 | 2.0 | 1050 | $1,648 | $1.57 | 17d | 3 | 1.06mi |
| 4939 Floramar Ter New Port Richey, FL | 2.0 | 2.0 | 1050 | $1,600 | $1.52 | 2d | 2 | 1.06mi |
| 4939 Floramar Ter New Port Richey, FL | 2.0 | 2.0 | 1050 | $1,675 | $1.60 | 24d | 2 | 1.06mi |
| 4540 Irene Loop New Port Richey, FL | 2.0 | 1.0 | 768 | $1,550 | $2.02 | 24d | 1 | 1.08mi |
| 4616 Irene Loop New Port Richey, FL | 2.0 | 1.0 | 898 | $1,600 | $1.78 | 20d | 1 | 1.09mi |
| 5743 Elm St New Port Richey, FL | 2.0 | 1.0 | 756 | $1,200 | $1.59 | 5d | 1 | 1.12mi |
| 6807 Porter Rd Unit PCG G-203 New Port Richey, FL | 2.0 | 1.0 | 770 | $1,275 | $1.66 | 5d | 1 | 1.15mi |
| 6807 Porter Rd Unit PCG G-101 New Port Richey, FL | 3.0 | 1.5 | 1080 | $1,375 | $1.27 | 5d | 1 | 1.15mi |
| 6807 Porter Rd Unit PGC C-5432-105 New Port Richey, FL | 2.0 | 2.0 | 895 | $1,360 | $1.52 | 24d | 1 | 1.15mi |
| 6807 Porter Rd Unit PGC C-5432-209 New Port Richey, FL | 2.0 | 2.0 | 1100 | $1,300 | $1.18 | 18d | 1 | 1.15mi |
| 6807 Porter Rd Unit PBMP M-5826 New Port Richey, FL | 2.0 | 1.0 | 800 | $1,380 | $1.73 | 24d | 1 | 1.15mi |
| 6807 Porter Rd New Port Richey, FL | 2.0 | 1.0 | 840 | $1,475 | $1.76 | 3d | 1 | 1.15mi |
| 6807 Porter Rd Unit PBMP M-5836 New Port Richey, FL | 2.0 | 1.0 | 840 | $1,475 | $1.76 | 24d | 1 | 1.15mi |
| 4721 Naftis Ln New Port Richey, FL | 3.0 | 2.0 | 1104 | $1,700 | $1.54 | 13d | 1 | 1.15mi |
| 5511 Executive Dr Apt E1 New Port Richey, FL | 2.0 | 2.0 | 1000 | $1,459 | $1.46 | 24d | 1 | 1.19mi |
| 5543 Gulf Dr New Port Richey, FL | 2.0 | 1.0 | 744 | $1,550 | $2.08 | 17d | 1 | 1.20mi |
| 5521 Executive Dr Unit D1 New Port Richey, FL | 2.0 | 2.0 | 1000 | $1,379 | $1.38 | 24d | 1 | 1.20mi |
| 5197 Silent Loop #124 New Port Richey, FL | 2.0 | 2.0 | 956 | $2,200 | $2.30 | 24d | 1 | 1.21mi |
| 5197 Silent Loop New Port Richey, FL | 2.0 | 2.0 | 956 | $2,200 | $2.30 | 4d | 1 | 1.21mi |
| 5648 Townhouse Dr New Port Richey, FL | 2.0 | 1.5 | 900 | $1,495 | $1.66 | 24d | 1 | 1.21mi |
Listing history 15 events
-
2026-06-18days on market $65,000 Active 38 DOM
-
2026-06-17pricedays on market $65,000 Active 37 DOM
-
2026-06-16days on market $75,000 Active 36 DOM
-
2026-06-15days on market $75,000 Active 35 DOM
-
2026-06-13days on market $75,000 Active 33 DOM
-
2026-06-09days on market $75,000 Active 29 DOM
-
2026-06-08days on market $75,000 Active 28 DOM
-
2026-06-07days on market $75,000 Active 27 DOM
-
2026-06-04days on market $75,000 Active 24 DOM
-
2026-06-03days on market $75,000 Active 23 DOM
-
2026-06-02days on market $75,000 Active 22 DOM
-
2026-06-01days on market $75,000 Active 21 DOM
-
2026-05-31days on market $75,000 Active 20 DOM
-
2026-05-22price $75,000
-
2026-05-11$85,000 Active
ⓘ Source: listings_history table (triggers on properties + properties_extension) + one-shot
backfill from property_details.listing_events for pre-trigger history.
Tax reassessment forecast FL · Resets to sale price
- Current annual tax
- $1,527 · $127/mo
- Projected year-2 tax
- $1,527 · $127/mo
- Expected delta
- $0/yr ($0/mo · 0.0%)
ⓘ Screening estimate from a state-policy table — verify with the county assessor before closing.
Climate risk First Street
- Flood 1/10 Low FEMA zone X (unshaded) · 0% chance over 30 yrs
- Wildfire 1/10 Low
- Heat 10/10 Extreme 7 d/yr ≥108°F today · 27 d/yr by 30 yrs out
- Wind 10/10 Extreme 99% chance of damaging wind over 30 yrs
- Air quality 2/10 Low 1 unhealthy d/yr today · 1 by 30 yrs out
Nearby sold comps map
Loading sold comps map…
Walkable amenities ~0.75 mi
Loading nearby amenities…
Taxation est. · year 1
- Rental income
- $18,388
- − Mortgage interest
- −$3,641
- − Property taxes
- −$1,527
- − Insurance
- −$325
- − Repairs & maintenance
- −$1,471
- − Management
- −$1,471
- − Depreciation
- −$1,891
- Taxable income
- $8,062
- Est. tax owed @ 24.0%
- −$1,935
- After-tax cash flow
- $6,649/yr
For passive investors: Depreciation is non-cash, so a rental often shows a tax loss while cash-flowing — sheltering income. Rental losses are passive: they offset passive income freely, and up to $25,000/yr can offset ordinary (W-2) income if you actively participate and your MAGI is under $100k (phasing out to $0 by $150k); unused losses carry forward. On sale, claimed depreciation is recaptured at up to 25%, and gains may owe capital-gains tax (a 1031 exchange can defer both). Figures are a year-1 estimate at your 24.0% rate — not tax advice; consult a CPA.
Schools (NCES district)
- District
- Pasco
- NCES district ID
- 1201530
- Math proficiency
- 50% ▼ -10.00%
- Reading proficiency
- 52% ▼ -5.00%
- Median HH income
- $45,039
- Composite
- 43.14/100
- National rank
- #3074
- State rank
- #32 of 73 in FL
Livability — Elfers
- Score
- 78/100
- State rank
- #167
- US rank
- #2486
Category grades
Schools grade is shown separately in the Schools card above.
Census & demographics
- Census place
- Elfers, FL
- County
- Pasco County · 524,098 people
- Metro
- Tampa-St. Petersburg-Clearwater, FL
- Population (ZIP)
- 27,444
- Household income
- $56,931
- Rent vs Own
- Severe rent burden
- 1190.0
Population outlook (Pasco County) Hauer SSP2
- Today (2025)
- 570,045 people
- By 2030
- 605,844 · +6.3%
- By 2040
- 674,806 · +18.4%
- By 2050
- 736,022 · +29.1%
- By 2075
- 862,900 · +51.4%
- By 2100
- 906,364 · +59.0%
Race, ethnicity, and origin ACS 2023
- Neighborhood character
- Predominantly White (78%)
- Race & ethnicity
- White 78% Hispanic / Latino 13% Two or more races 9% Black 4%
- Hispanic origin (detail)
- Mexican 3% Puerto Rican 4% Cuban 4%
- Common ancestry
- Romanian 4% Lithuanian 3% Slovak 2%
- Foreign-born
- 9% · Canada
- Languages at home
- 87% English-only · Spanish 9% Other Indo-European 1% Russian/Polish/Slavic 1%
Political lean MEDSL · Pasco
- 2024 margin
- Strong R (+25.2) · D 36.9% · R 62.1% · Other 1.0%
- 2008→2024 swing
- -21.6pp toward R · 2008: -3.6pp · 2024: -25.2pp
- All cycles
- 2024: R+25.2 2020: R+20.1 2016: R+21.6 2012: R+6.7 2008: R+3.6
Not yet ingested
- Civics
- —
Market trends
- HPI YoY
- ▼ -109.49%
- Current HPI
- 310.8347
- Rent YoY
- ▲ 0.72%
- Metro
- Tampa-St. Petersburg-Clearwater, FL
- State GDP YoY
- ▲ 3.28%
- F500 in state
- 36
Industry mix (Fortune 500 HQ in FL)
| Industry | F500 HQs | Revenue |
|---|---|---|
| Industrial Technology | 2 | $29B |
|
||
| Insurance | 2 | $17B |
|
||
| Retail | 1 | $60B |
|
||
| Technology Distribution | 1 | $58B |
|
||
| Homebuilding | 1 | $35B |
|
||
| Technology Manufacturing | 1 | $35B |
|
||
Price history
-11.8% since first listed2 events — show timeline
- 2026-05-22 Price Changed $75,000 Stellar MLS as Distributed by MLS Grid
- 2026-05-11 Listed $85,000 Stellar MLS as Distributed by MLS Grid
Property tax history
+19.9%/yrLatest (2025): $1,527 · +1.0% YoY. Source: county tax records.
Cash-flow waterfall
monthlySold comps — $/sqft
last 12 mo · ≤1 miLoading sold comps…