205 Cotton Gin Ct · Branch, LA
Flood risk No data
- FEMA flood zone
- —
- Chance of flooding over 30 yrs
- —
- Est. flood insurance / yr
- —
Fire risk No data
- Est. fire insurance / yr
- —
Heat risk No data
- Hot days now (above threshold)
- —
- Hot days in 30 yrs
- —
Wind risk No data
- Chance of severe wind over 30 yrs
- —
Air-quality risk No data
- Unhealthy air days now
- —
- Unhealthy air days in 30 yrs
- —
Risk factors via First Street. Map © Google.
Why this score? — see what drove the D+ grade
The composite is a weighted blend of 9 inputs, each scored 0–100. Each bar is that input's sub-score; the figure is the points it added to the 100-point composite (weight × sub-score).
- Cash flow +15.0/30.0
- ARV discount +7.5/15.0
- 1% rule +5.0/10.0
- DSCR +5.0/10.0
- Appreciation +5.0/10.0
- Schools +3.2/10.0
- Rent growth +2.5/5.0
- Condition / age +2.5/5.0
- Livability +2.1/5.0
$12,250
🖨 Deal sheet (PDF) 📄 Offer letter ✓ Due diligence
Listing remarks
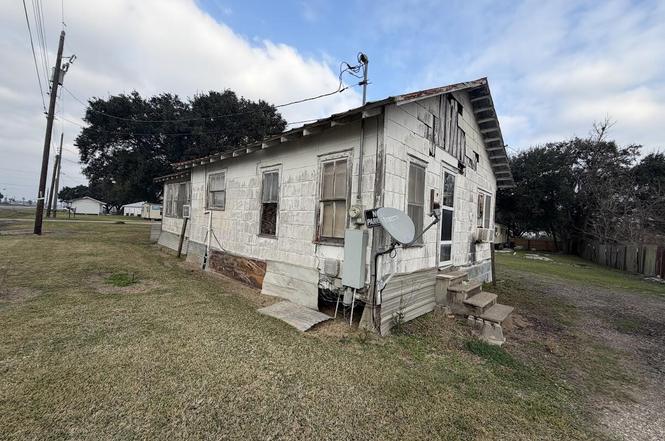
2-bedroom, 1 bathroom. Sold As-Is.
Key facts
- 4,356 sq ft lot
- Parking
- Listed 139 days
Property features AI
Exterior
- Parking: Open parking
- Utilities: Septic tank sewer; Electric service: SLEMCO
- Home design: Single family residence
- Construction: Asbestos construction material
- Exterior features: Asbestos exterior siding
Interior
- Bathrooms: 1 full bathroom
- Heating & cooling: No central heating; Window Unit(s) for cooling
- Interior features: Window cooling units
Neighborhood map
What this means for you Summary
Snapshot
- This is a 2-bed/1.0-bath single-family listed at $12k.
Deal economics
- At list price, monthly cash flow is $575 ($7k/yr) — positive.
- The deal already cash-flows at list — no discount required.
- Meets the 1% rule at list price ($826 rent vs $12k).
- Recommended offer: $11k (12.0% below list) — sets the bar for market timing.
Location & tenants
- Location reads 41/100 on livability (#462 in LA) — a working-class tenant base; expect higher turnover. Strengths: cost of living A+; Watch: schools D+, crime F, amenities F.
- Acadia Parish (rural): math 32% / reading 44% proficiency, ranked #28 of 98 in LA (top 29%) — families likely to look elsewhere, expect single-tenant / working-renter base with shorter leases; 62% free/reduced lunch — lower-income household profile, screen leases tightly.
- Market conditions: 18 active listings in the ZIP; 137 units permitted in Acadia Parish in 2024 (0 in 5+ unit buildings).
Forward outlook
- In year one you build about $452 of equity ($84 loan paydown + $368 appreciation (3.0% local appreciation)).
- At projected returns (3.0% appreciation + 3.0% rent growth), your $3k cash investment doubles in ~1 year — after that, you're playing with house money.
Negotiation context
- It's been on market 140 days — a 12% lower offer ($11k) is reasonable based on typical stale-listing flexibility.
Questions for the listing agent
- It's been on market 140 days. Have you received any prior offers? Is the seller open to a 12% concession, seller financing, or rate buy-down credit?
- Why hasn't it sold? Are there any deal-killer items the seller is aware of (foundation, flood, title, zoning, code violations)?
- Is there a deadline driving the sale (1031 exchange, divorce, estate, relocation)? That informs how much negotiation room exists.
- Schools are D-rated, which usually means shorter tenancies and higher turnover. Who's the typical renter profile here, and what's been the actual vacancy rate?
- Crime grade is F in this area — have there been break-ins, vandalism, or insurance claims at this property in the last 3 years? What carrier currently insures it and at what premium?
- The area grade is low — what's the realistic commute time and amenity access for the typical tenant pool here? Any planned neighborhood developments (good or bad) we should know about?
- What's the average days-on-market for RENTAL listings here right now (not sales)? A rising rental-DOM trend means longer vacancies and softer asking-rent achievability than the comps imply.
- What's the recent tenant-quality profile in this submarket — average credit score on applications, eviction rate, late-payment / NSF rate, and stable-employment percentage? A property-management company in the area should have these aggregated.
- How much new for-sale + rental construction is in the pipeline within 1–3 miles? Heavy new supply typically softens prices + rents 12–24 months out; constrained supply supports both.
Investment metrics
- 1% rule
- 6.74% ✓
- Cap rate
- 62.64%
- Cash-on-cash
- 201.24%
- DSCR
- 9.95
- GRM
- 1.2
CMA / ARV
No comps found within radius.
Projected returns pro-forma
3.0% appreciation · 3.0% rent growth · sell at horizon
- IRR
- —
- Equity multiple
- 12.11×
- Total profit
- $38,120
- Equity at exit
- $5,508
- IRR
- —
- Equity multiple
- 25.60×
- Total profit
- $84,371
- Equity at exit
- $8,489
Cash invested: $3,430 (down + closing). Projections, not guarantees.
Landlord ↔ Tenant lean methodology
- Overall (STATE)
- 90 Strongly Landlord-Friendly
- State Louisiana
- 90 Strongly Landlord-Friendly · R+12
- County
- — inherits STATE
- City
- — inherits STATE
ZIP-level market 70516
- Active inventory
- 18
- Price-to-rent
- 1.2×
Monthly cashflow live
- Estimated rent
- $826 medium interval (Pro) →
- Mortgage (P&I)
- −$64
- Tax from tax record
- −$8 /mo · $98/yr
- Insurance
- −$5
- HOA
- −$0
- Vacancy / Maint / Mgmt
- −$174
- Net cashflow
- $575
Break-even live
Sensitivity live
| Price | -10% $582 | -5% $579 | +0% $575 | +5% $572 | +10% $568 |
|---|---|---|---|---|---|
| Rent | -10% $510 | -5% $543 | +0% $575 | +5% $608 | +10% $640 |
| Rate | -1.0pp $581 | -0.5pp $578 | base $575 | +0.5pp $572 | +1.0pp $569 |
UW: 25.0% down · 7.5% · 30yr · 1.5% tax · 5.0% vac · 8.0% maint · 8.0% mgmt
Financing live
Cash to close
- Down payment
- $3,062
- Closing costs
- $368
- Reserves months
- —
- Total cash needed
- —
Loan-product check · same deal, 3 products live
Conventional
25% down · 7.5% · 30yr
- Down + closing
- —
- Monthly P&I
- —
- Monthly cashflow
- —
- DSCR
- —
- Eligible?
- —
Personal DTI + credit; lowest rate.
DSCR
20% down · 8.5% · 30yr
- Down + closing
- —
- Monthly P&I
- —
- Monthly cashflow
- —
- DSCR
- —
- Eligible?
- —
No personal income docs; deal must DSCR.
Hard money
10% down · 12.0% · 12mo
- Down + closing
- —
- Monthly P&I
- —
- Monthly cashflow
- —
- DSCR
- —
- Eligible?
- —
Short-term bridge; refi at stabilization.
Listing history 19 events
-
2026-06-21days on market $12,250 Active 140 DOM
-
2026-06-21days on market $12,250 Active 139 DOM
-
2026-06-18days on market $12,250 Active 137 DOM
-
2026-06-17days on market $12,250 Active 136 DOM
-
2026-06-16days on market $12,250 Active 135 DOM
-
2026-06-15days on market $12,250 Active 134 DOM
-
2026-06-13days on market $12,250 Active 132 DOM
-
2026-06-12pricedays on market $12,250 Active 131 DOM
-
2026-06-09days on market $17,250 Active 128 DOM
-
2026-06-08days on market $17,250 Active 127 DOM
-
2026-06-07days on market $17,250 Active 126 DOM
-
2026-06-07days on market $17,250 Active 125 DOM
-
2026-06-04days on market $17,250 Active 122 DOM
-
2026-06-02days on market $17,250 Active 121 DOM
-
2026-06-01days on market $17,250 Active 120 DOM
-
2026-05-31days on market $17,250 Active 119 DOM
-
2026-05-31days on market $17,250 Active 118 DOM
-
2026-04-08price $17,250
-
2026-02-01$34,900 Active
ⓘ Source: listings_history table (triggers on properties + properties_extension) + one-shot
backfill from property_details.listing_events for pre-trigger history.
Tax reassessment forecast LA · Resets to sale price
- Current annual tax
- $98 · $8/mo
- Projected year-2 tax
- $98 · $8/mo
- Expected delta
- $0/yr ($0/mo · -0.0%)
ⓘ Screening estimate from a state-policy table — verify with the county assessor before closing.
Nearby sold comps map
Loading sold comps map…
Walkable amenities ~0.75 mi
Loading nearby amenities…
Taxation est. · year 1
- Rental income
- $9,914
- − Mortgage interest
- −$686
- − Property taxes
- −$98
- − Insurance
- −$61
- − Repairs & maintenance
- −$793
- − Management
- −$793
- − Depreciation
- −$356
- Taxable income
- $7,127
- Est. tax owed @ 24.0%
- −$1,710
- After-tax cash flow
- $5,192/yr
For passive investors: Depreciation is non-cash, so a rental often shows a tax loss while cash-flowing — sheltering income. Rental losses are passive: they offset passive income freely, and up to $25,000/yr can offset ordinary (W-2) income if you actively participate and your MAGI is under $100k (phasing out to $0 by $150k); unused losses carry forward. On sale, claimed depreciation is recaptured at up to 25%, and gains may owe capital-gains tax (a 1031 exchange can defer both). Figures are a year-1 estimate at your 24.0% rate — not tax advice; consult a CPA.
Schools (NCES district)
- District
- Acadia Parish
- NCES district ID
- 2200030
- Math proficiency
- 32% ▼ -39.00%
- Reading proficiency
- 44% ▼ -32.00%
- Median HH income
- $38,012
- Composite
- 31.65/100
- National rank
- #5929
- State rank
- #28 of 98 in LA
Livability — Branch
- Score
- 41/100
- State rank
- #462
- US rank
- #27194
Category grades
Schools grade is shown separately in the Schools card above.
Census & demographics
- Census place
- Branch, LA
- Population (ZIP)
- 1,225
Population outlook (Acadia County) Hauer SSP2
- Today (2025)
- 63,846 people
- By 2030
- 64,141 · +0.5%
- By 2040
- 63,922 · +0.1%
- By 2050
- 62,263 · -2.5%
- By 2075
- 56,507 · -11.5%
- By 2100
- 46,316 · -27.5%
Race, ethnicity, and origin ACS 2023
- Neighborhood character
- Predominantly White (84%)
- Race & ethnicity
- White 84% Two or more races 10% Black 4% Hispanic / Latino 3%
- Common ancestry
- Lithuanian 12% Italian 1%
- Foreign-born
- 2% · Canada
- Languages at home
- 94% English-only · French/Haitian/Cajun 4% Spanish 2%
Political lean MEDSL · Acadia
- 2024 margin
- Solid R (+64.0) · D 17.6% · R 81.5%
- 2008→2024 swing
- -18.3pp toward R · 2008: -45.7pp · 2024: -64.0pp
- All cycles
- 2024: R+64.0 2020: R+60.3 2016: R+56.7 2012: R+49.8 2008: R+45.7
Not yet ingested
- Civics
- —
Market trends
- HPI YoY
- —
- Current HPI
- —
- Rent YoY
- —
- Metro
- —
- State GDP YoY
- ▲ 3.29%
- F500 in state
- 10
Industry mix (Fortune 500 HQ in LA)
| Industry | F500 HQs | Revenue |
|---|---|---|
| Telecommunications | 2 | $23B |
|
||
| Utilities | 1 | $12B |
|
||
| Wholesale / Distribution | 1 | $5B |
|
||
| Advertising | 1 | $2B |
|
||
Price history
-50.6% since first listed2 events — show timeline
- 2026-04-08 Price Changed $17,250 AcadianaMLS
- 2026-02-01 Listed $34,900 AcadianaMLS
Property tax history
-1.4%/yrLatest (2025): $98 · +0.3% YoY. Source: county tax records.
Cash-flow waterfall
monthlySold comps — $/sqft
last 12 mo · ≤1 miLoading sold comps…