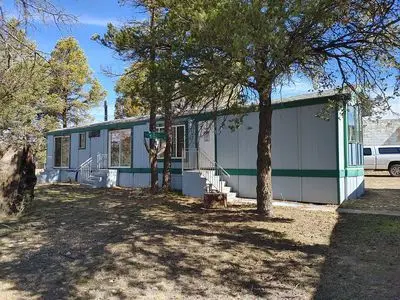
2062 W Arizona Highway 277 · Heber-Overgaard, AZ
Flood risk 1/10 · Minimal
- FEMA flood zone
- X (unshaded)
- Chance of flooding over 30 yrs
- 0.0%
- Est. flood insurance / yr
- $507 – $1,088
Fire risk 7/10 · Major
- Est. fire insurance / yr
- $610 – $1,132
Heat risk 2/10 · Minimal
- Hot days now (above 87°F)
- 7 days/yr
- Hot days in 30 yrs
- 18 days/yr
Wind risk 1/10 · Minimal
- Chance of severe wind over 30 yrs
- —
Air-quality risk 1/10 · Minimal
- Unhealthy air days now
- 0 days/yr
- Unhealthy air days in 30 yrs
- 0 days/yr
Risk factors via First Street. Map © Google.
Why this score? — see what drove the B grade
The composite is a weighted blend of 9 inputs, each scored 0–100. Each bar is that input's sub-score; the figure is the points it added to the 100-point composite (weight × sub-score).
- Cash flow +26.1/30.0
- ARV discount +12.7/15.0
- DSCR +8.8/10.0
- 1% rule +5.6/10.0
- Appreciation +5.4/10.0
- Schools +4.0/10.0
- Rent growth +2.5/5.0
- Livability +2.5/5.0
- Condition / age +2.5/5.0
$139,000
🖨 Deal sheet (PDF) 📄 Offer letter ✓ Due diligence
Listing remarks
. Manufactured home 14x60=840 sgft. needs complete remodel inside and out but is livable , everything works except hot water heater. Range, water heater and furnace are propane. Roof in good condition , stains on ceiling are from previous shingles , no roof leaks. Everything in home is included. Work Shop 14x40=560 sqft. needs exterior paint but is in decent condition , roof in good condition. Interior is in great condition and is a complete wood shop. All tools and misc. and 12x12 shed are included. No Hoa , no lot rent , .27 acres of commercial land and all structures, tools, and furniture are owned and included in price.
Key facts
- Complete remodel
- Commercial land
- Manufactured home
Tags
Property features AI
Exterior
- Home design: Built in 1985
- Construction: 1,840 square feet of living area
- Exterior features: Located in the Heber subdivision
Neighborhood map
What this means for you Summary
Snapshot
- This is a 2-bed/1.0-bath manufactured listed at $139k.
Deal economics
- At list price, monthly cash flow is $351 ($4k/yr) — positive.
- The deal already cash-flows at list — no discount required.
- Meets the 1% rule at list price ($1k rent vs $139k).
- Recommended offer: $135k (3.0% below list) — sets the bar for market timing.
- Cap rate 9.3% vs local median 3.2% in Heber-Overgaard — top-decile yield for the area; either an underpriced asset or a hidden risk that comps aren't pricing in. Stress-test before assuming the spread holds.
Location & tenants
- Location reads: area grade B — affects rentability + tenant quality, not the cash-flow math above.
- Heber-Overgaard Unified District (4392) (rural): math 52% / reading 45% proficiency, ranked #51 of 249 in AZ (top 20%) — families likely to look elsewhere, expect single-tenant / working-renter base with shorter leases.
- Zoned schools: Mountain Meadows Primary (math 70% / reading 50%, grade B-, #148 of 1,109 statewide, top 15%, 143 students, 43% FRL); Mogollon Jr High School (math 42% / reading 32%, grade F, #57 of 218 statewide, top 27%, 77 students, 0% FRL); Mogollon High School (math 30% / reading 30%, grade F, #116 of 381 statewide, top 31%, 167 students, 32% FRL) — zoned schools average 25% FRL vs 50% district-wide (25 pts lower); this property's tenant base skews higher-income than the district average.
- Market conditions: 157 active listings in the ZIP; 485 units permitted in Navajo County in 2024 (11 in 5+ unit buildings).
Forward outlook
- In year one you build about $2k of equity ($961 loan paydown + $1k appreciation (0.9% local appreciation)).
- Navajo County population projected at -16% by 2050 — secular population decline; favor cash flow + early exit over multi-decade hold.
- At projected returns (0.9% appreciation + 3.0% rent growth), your $39k cash investment doubles in ~6 years — after that, you're playing with house money.
Negotiation context
- It's been on market 35 days — a 3% lower offer ($135k) is reasonable based on typical stale-listing flexibility.
- Current owner paid $18k; list at $139k implies a 672% gain — meaningful room to come down on a strong offer.
Risks & watch-outs
- Climate carrying-cost: major wildfire risk — expect insurance premiums to compound above CPI over the hold.
Questions for the listing agent
- It's been on market 35 days. Have you received any prior offers? Is the seller open to a 3% concession, seller financing, or rate buy-down credit?
- Is there a deadline driving the sale (1031 exchange, divorce, estate, relocation)? That informs how much negotiation room exists.
- What's the average days-on-market for RENTAL listings here right now (not sales)? A rising rental-DOM trend means longer vacancies and softer asking-rent achievability than the comps imply.
- What's the recent tenant-quality profile in this submarket — average credit score on applications, eviction rate, late-payment / NSF rate, and stable-employment percentage? A property-management company in the area should have these aggregated.
- How much new for-sale + rental construction is in the pipeline within 1–3 miles? Heavy new supply typically softens prices + rents 12–24 months out; constrained supply supports both.
Investment metrics
- 1% rule
- 1.06% ✓
- Cap rate
- 9.33%
- Cash-on-cash
- 10.83%
- DSCR
- 1.48
- GRM
- 7.8
CMA / ARV
- ARV (on-the-fly)
- $157,080
- Comps found
- 7
Show comp detail 7 sales within ~0.75 mi
| Address | Dist | Beds/Ba | Sqft | Sold | Price | $/sf | Match |
|---|---|---|---|---|---|---|---|
| 2070 Pinewood Dr | 0.21mi | 2/2.0 | 840 (0%) | 9mo | $186,000 | $221 | 79 |
| 3504 Rae Cir | 0.42mi | 2/1.0 | 785 (-6%) | 3mo | $148,000 | $189 | 67 |
| 3490 Black Bear Run | 0.13mi | 2/1.0 | 960 (+14%) | 5mo | $141,000 | $147 | 66 |
| 3622 Red Wing Loop | 0.55mi | 2/2.0 | 840 (0%) | 10mo | $165,000 | $196 | 62 |
| 3305 Forest Dr | 0.37mi | 2/1.0 | 900 (+7%) | 13mo | $112,500 | $125 | 60 |
| 2065 Pine Lake Dr | 0.31mi | 2/1.0 | 721 (-14%) | 17mo | $134,900 | $187 | 48 |
| 2065 Pine Lake Dr | 0.31mi | 2/1.0 | 720 (-14%) | 17mo | $134,900 | $187 | 47 |
Match score weights: distance 35% · size 25% · config 20% · recency 20%. Top-matched comps best support the ARV.
Projected returns pro-forma
0.86% appreciation · 3.0% rent growth · sell at horizon
- IRR
- 12.2%
- Equity multiple
- 1.61×
- Total profit
- $23,935
- Equity at exit
- $46,422
- IRR
- 16.0%
- Equity multiple
- 2.91×
- Total profit
- $74,297
- Equity at exit
- $60,902
Cash invested: $38,920 (down + closing). Projections, not guarantees.
Landlord ↔ Tenant lean methodology
- Overall (STATE)
- 87 Strongly Landlord-Friendly
- State Arizona
- 87 Strongly Landlord-Friendly · R+3
- County
- — inherits STATE
- City
- — inherits STATE
ZIP-level market 85928
- Home prices YoY
- 0.2%
- Active inventory
- 157
- Price-to-rent
- 7.8×
Monthly cashflow live
- Estimated rent
- $1,479 medium interval (Pro) →
- Mortgage (P&I)
- −$729
- Tax from tax record
- −$30 /mo · $363/yr
- Insurance
- −$58
- HOA
- −$0
- Lot rent leased land?
- −$0
- Vacancy / Maint / Mgmt
- −$311
- Net cashflow
- $351
Break-even live
Sensitivity live
| Price | -10% $430 | -5% $391 | +0% $351 | +5% $312 | +10% $273 |
|---|---|---|---|---|---|
| Rent | -10% $234 | -5% $293 | +0% $351 | +5% $410 | +10% $468 |
| Rate | -1.0pp $421 | -0.5pp $387 | base $351 | +0.5pp $315 | +1.0pp $279 |
UW: 25.0% down · 7.5% · 30yr · 1.5% tax · 5.0% vac · 8.0% maint · 8.0% mgmt
Financing live
Cash to close
- Down payment
- $34,750
- Closing costs
- $4,170
- Reserves months
- —
- Total cash needed
- —
Loan-product check · same deal, 3 products live
Conventional
25% down · 7.5% · 30yr
- Down + closing
- —
- Monthly P&I
- —
- Monthly cashflow
- —
- DSCR
- —
- Eligible?
- —
Personal DTI + credit; lowest rate.
DSCR
20% down · 8.5% · 30yr
- Down + closing
- —
- Monthly P&I
- —
- Monthly cashflow
- —
- DSCR
- —
- Eligible?
- —
No personal income docs; deal must DSCR.
Hard money
10% down · 12.0% · 12mo
- Down + closing
- —
- Monthly P&I
- —
- Monthly cashflow
- —
- DSCR
- —
- Eligible?
- —
Short-term bridge; refi at stabilization.
Listing history 21 events
-
2026-06-22days on market $139,000 Active 35 DOM
-
2026-06-21days on market $139,000 Active 34 DOM
-
2026-06-19days on market $139,000 Active 32 DOM
-
2026-06-18days on market $139,000 Active 31 DOM
-
2026-06-17days on market $139,000 Active 30 DOM
-
2026-06-17price $139,000 Active 29 DOM
-
2026-06-16days on market $149,000 Active 29 DOM
-
2026-06-15days on market $149,000 Active 28 DOM
-
2026-06-14days on market $149,000 Active 26 DOM
-
2026-06-12days on market $149,000 Active 25 DOM
-
2026-06-09days on market $149,000 Active 22 DOM
-
2026-06-08days on market $149,000 Active 21 DOM
-
2026-06-07days on market $149,000 Active 20 DOM
-
2026-06-07days on market $149,000 Active 19 DOM
-
2026-06-04days on market $149,000 Active 16 DOM
-
2026-06-02days on market $149,000 Active 15 DOM
-
2026-06-01days on market $149,000 Active 14 DOM
-
2026-05-31days on market $149,000 Active 13 DOM
-
2026-05-31days on market $149,000 Active 12 DOM
-
2026-05-19$149,000 Active
-
1996-10-08soldstatus $18,000
ⓘ Source: listings_history table (triggers on properties + properties_extension) + one-shot
backfill from property_details.listing_events for pre-trigger history.
Tax reassessment forecast AZ · Resets to sale price
- Current annual tax
- $363 · $30/mo
- Projected year-2 tax
- $917 · $76/mo
- Expected delta
- +$554/yr (+$46/mo · 152.7%)
ⓘ Screening estimate from a state-policy table — verify with the county assessor before closing.
Climate risk First Street
- Flood 1/10 Low FEMA zone X (unshaded) · 0% chance over 30 yrs
- Wildfire 7/10 Severe
- Heat 2/10 Low 7 d/yr ≥87°F today · 18 d/yr by 30 yrs out
- Wind 1/10 Low
- Air quality 1/10 Low 0 unhealthy d/yr today · 0 by 30 yrs out
Nearby sold comps map
Loading sold comps map…
Walkable amenities ~0.75 mi
Loading nearby amenities…
Taxation est. · year 1
- Rental income
- $17,747
- − Mortgage interest
- −$7,786
- − Property taxes
- −$363
- − Insurance
- −$695
- − Repairs & maintenance
- −$1,420
- − Management
- −$1,420
- − Depreciation
- −$4,044
- Taxable income
- $2,019
- Est. tax owed @ 24.0%
- −$485
- After-tax cash flow
- $3,730/yr
For passive investors: Depreciation is non-cash, so a rental often shows a tax loss while cash-flowing — sheltering income. Rental losses are passive: they offset passive income freely, and up to $25,000/yr can offset ordinary (W-2) income if you actively participate and your MAGI is under $100k (phasing out to $0 by $150k); unused losses carry forward. On sale, claimed depreciation is recaptured at up to 25%, and gains may owe capital-gains tax (a 1031 exchange can defer both). Figures are a year-1 estimate at your 24.0% rate — not tax advice; consult a CPA.
Schools (NCES district)
- District
- Heber-Overgaard Unified District (4392)
- NCES district ID
- 0400026
- Math proficiency
- 52% ▼ -5.00%
- Reading proficiency
- 45% ▼ -1.00%
- Median HH income
- $37,916
- Composite
- 40.42/100
- National rank
- #3727
- State rank
- #51 of 249 in AZ
Livability — Heber-Overgaard
No livability data for this city. (Only ~50 U.S. cities are tracked.)
Census & demographics
- Census place
- Heber-Overgaard, AZ
- Population (ZIP)
- 376
Population outlook (Navajo County) Hauer SSP2
- Today (2025)
- 105,760 people
- By 2030
- 103,301 · -2.3%
- By 2040
- 97,070 · -8.2%
- By 2050
- 88,850 · -16.0%
- By 2075
- 65,180 · -38.4%
- By 2100
- 37,281 · -64.7%
Race, ethnicity, and origin ACS 2023
- Neighborhood character
- Predominantly White (100%)
- Race & ethnicity
- White 100%
- Common ancestry
- Iranian 6% Slovak 6% Lithuanian 5%
Political lean MEDSL · Navajo
- 2024 margin
- R (+17.2) · D 40.9% · R 58.1%
- 2008→2024 swing
- -5.5pp toward R · 2008: -11.7pp · 2024: -17.2pp
- All cycles
- 2024: R+17.2 2020: R+8.2 2016: R+7.9 2012: R+8.4 2008: R+11.7
Not yet ingested
- Civics
- —
Market trends
- HPI YoY
- ▲ 0.86%
- Current HPI
- 443.6984
- Rent YoY
- —
- Metro
- —
- State GDP YoY
- ▲ 4.54%
- F500 in state
- 20
Industry mix (Fortune 500 HQ in AZ)
| Industry | F500 HQs | Revenue |
|---|---|---|
| Technology | 2 | $13B |
|
||
| Mining / Metals | 1 | $23B |
|
||
| Environmental Services | 1 | $16B |
|
||
| Metals / Steel | 1 | $14B |
|
||
| Technology Distribution | 1 | $9B |
|
||
| Homebuilding | 1 | $8B |
|
||
Price history
+672.2% since first listed3 events — show timeline
- 2026-06-16 Price Changed $139,000 FSBO.com
- 2026-05-19 Listed $149,000 FSBO.com
- 1996-10-08 Sold (Public Records) $18,000 Public Records
Property tax history
+1.3%/yrLatest (2025): $363 · +1.5% YoY. Source: county tax records.
Cash-flow waterfall
monthlySold comps — $/sqft
last 12 mo · ≤1 miLoading sold comps…