194 Forest Blvd · Avon Lake, OH
Flood risk 1/10 · Minimal
- FEMA flood zone
- X (unshaded)
- Chance of flooding over 30 yrs
- 0.0%
- Est. flood insurance / yr
- $473 – $860
Fire risk 1/10 · Minimal
- Est. fire insurance / yr
- $713 – $1,323
Heat risk 3/10 · Minor
- Hot days now (above 96°F)
- 7 days/yr
- Hot days in 30 yrs
- 17 days/yr
Wind risk 1/10 · Minimal
- Chance of severe wind over 30 yrs
- —
Air-quality risk 2/10 · Minimal
- Unhealthy air days now
- 2 days/yr
- Unhealthy air days in 30 yrs
- 2 days/yr
Risk factors via First Street. Map © Google.
Why this score? — see what drove the F grade
The composite is a weighted blend of 9 inputs, each scored 0–100. Each bar is that input's sub-score; the figure is the points it added to the 100-point composite (weight × sub-score).
- Cash flow +9.5/30.0
- Schools +7.0/10.0
- Livability +4.2/5.0
- DSCR +2.7/10.0
- ARV discount +2.6/15.0
- 1% rule +2.5/10.0
- Rent growth +2.5/5.0
- Condition / age +2.5/5.0
- Appreciation +0.0/10.0
$219,900
🖨 Deal sheet 📄 Offer letter ✓ Due diligence
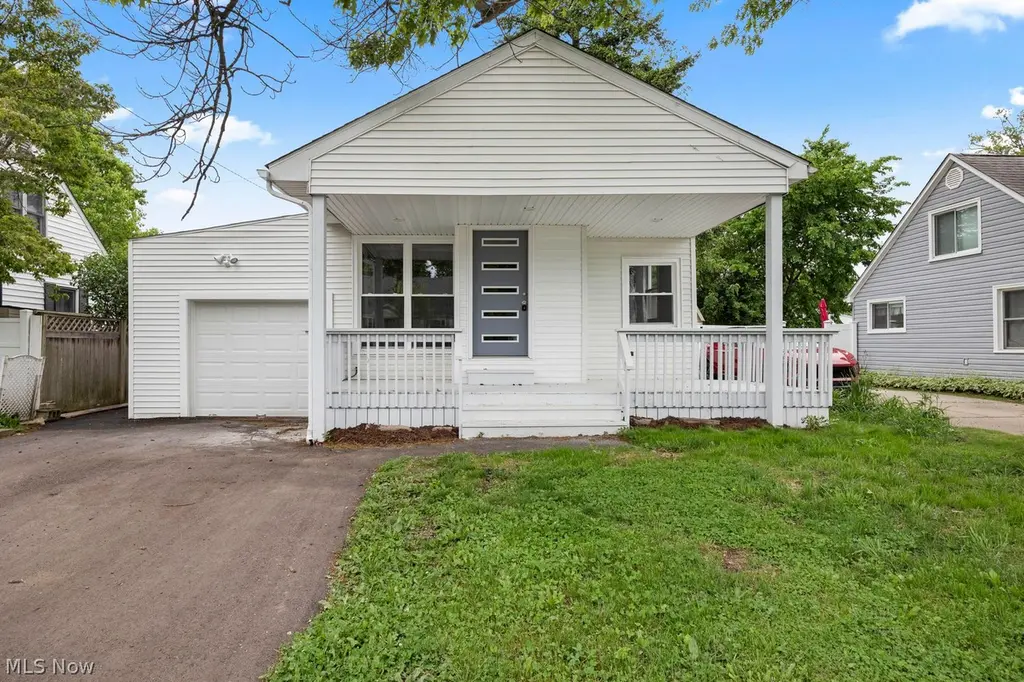
Listing remarks
Welcome home to this stunning, fully renovated 3-bedroom, 2-bathroom ranch, perfectly situated just blocks away from Lake Erie! Move right in and enjoy total peace of mind with a brand-new roof, brand-new windows, and a completely transformed modern interior. The bright living space is perfect for everyday comfort and entertaining. The pristine, updated kitchen features contemporary finishes. Step outside to enjoy the lakeside breeze in your private yard. Located in a highly desirable Avon Lake neighborhood, you are just minutes from parks, beaches, shopping, and top-rated schools. Don't miss this turnkey coastal retreat—schedule your tour today!
Key facts
- Fully renovated
- Brand-new windows
- Brand-new roof
Tags
Neighborhood map
What this means for you Summary
Snapshot
- This is a 2-bed/1.0-bath single-family listed at $220k.
Deal economics
- At list price, monthly cash flow is $-152 ($-2k/yr) — negative.
- To cash-flow at today's rent, offer at most $193k (12.2% below list).
- To meet the 1% rule (rent ≥ 1% of price), the offer needs to be $165k (24.9% below list).
- Recommended offer: $165k (24.9% below list) — sets the bar for 1% rule.
- Cap rate 5.5% vs local median 3.2% in Avon Lake — top-decile yield for the area; either an underpriced asset or a hidden risk that comps aren't pricing in. Stress-test before assuming the spread holds.
Location & tenants
- Location reads 84/100 on livability (#52 in OH, #736 nationally) — a professional / high-income tenant draw. Strengths: schools A+, crime A+, employment A+; Watch: commute F.
- Avon Lake City (suburban): math 78% / reading 80% proficiency, ranked #48 of 656 in OH (top 7%) — strong family-tenant draw, lease renewals of 3-5y typical; only 10% free/reduced lunch — higher-income household profile.
- Market conditions: 178 active listings in the ZIP; high-income renter base; 1,098 units permitted in Lorain County in 2024 (20 in 5+ unit buildings).
- This rent is only 17% of the median local income ($116k/yr) — well below the 30% rent-burden line; pricing power to push rent on renewal without tenant pushback.
Forward outlook
- Local home prices are declining (-3.0%/yr); year-one equity from $2k of loan paydown is wiped out by about $7k of value loss. Plan a longer hold.
Negotiation context
- Only 6 days on market — expect competitive offers; lowballing is unlikely to land.
- 2 sale attempts since 27y ago with the ask held roughly flat each time — persistent listings suggest the price (not the market) is what's stuck; bring a comps-based counter.
Risks & watch-outs
- Watch-outs: built in 1945 — expect roof / HVAC / electrical / plumbing capex.
Questions for the listing agent
- What do current leases actually rent for vs. the listed asking? Can we see a recent rent roll and the last 12 months of T-12 income?
- Built in 1945 — when were the roof, HVAC, electrical panel, plumbing, and water heater last replaced?
- Is there a deadline driving the sale (1031 exchange, divorce, estate, relocation)? That informs how much negotiation room exists.
- Schools are A-rated — typically a magnet for longer-tenancy family renters. What's the average tenant stay here, and is there a school-zone premium baked into asking?
- The area grade is low — what's the realistic commute time and amenity access for the typical tenant pool here? Any planned neighborhood developments (good or bad) we should know about?
- What's the average days-on-market for RENTAL listings here right now (not sales)? A rising rental-DOM trend means longer vacancies and softer asking-rent achievability than the comps imply.
- What's the recent tenant-quality profile in this submarket — average credit score on applications, eviction rate, late-payment / NSF rate, and stable-employment percentage? A property-management company in the area should have these aggregated.
- How much new for-sale + rental construction is in the pipeline within 1–3 miles? Heavy new supply typically softens prices + rents 12–24 months out; constrained supply supports both.
Investment metrics
- 1% rule
- 0.75% ✗
- Cap rate
- 5.46%
- Cash-on-cash
- -2.97%
- DSCR
- 0.87
- GRM
- 11.1
CMA / ARV
- ARV (on-the-fly)
- $198,288
- Comps found
- 4
Show comp detail 4 sales within ~0.75 mi
| Address | Dist | Beds/Ba | Sqft | Sold | Price | $/sf | Match |
|---|---|---|---|---|---|---|---|
| 195 S Point Dr | 0.25mi | 2/1.0 | 898 (+10%) | 11mo | $168,000 | $187 | 62 |
| 184 Lakewood Dr | 0.10mi | 3/1.0 (+1) | 904 (+11%) | 12mo | $220,000 | $243 | 62 |
| 191 Lear Rd | 0.29mi | 2/1.0 | 732 (-10%) | 12mo | $175,000 | $239 | 59 |
| 193 Lear Rd | 0.29mi | 2/1.0 | 728 (-11%) | 12mo | $180,000 | $247 | 58 |
Match score weights: distance 35% · size 25% · config 20% · recency 20%. Top-matched comps best support the ARV.
Projected returns pro-forma
-3.0% appreciation · 3.0% rent growth · sell at horizon
- IRR
- -21.3%
- Equity multiple
- 0.26×
- Total profit
- $-45,347
- Equity at exit
- $32,788
- IRR
- -14.8%
- Equity multiple
- 0.15×
- Total profit
- $-52,032
- Equity at exit
- $19,013
Cash invested: $61,572 (down + closing). Projections, not guarantees.
Landlord ↔ Tenant lean methodology
- Overall (STATE)
- 73 Landlord-Friendly
- State Ohio
- 73 Landlord-Friendly · R+6
- County
- — inherits STATE
- City
- — inherits STATE
ZIP-level market 44012
- Active inventory
- 178
- Price-to-rent
- 11.1×
Monthly cashflow live
- Estimated rent
- $1,652 medium interval (Pro) →
- Mortgage (P&I)
- −$1,153
- Tax from tax record
- −$212 /mo · $2,548/yr
- Insurance
- −$92
- HOA
- −$0
- Vacancy / Maint / Mgmt
- −$347
- Net cashflow
- $-152
Break-even live
UW: 25.0% down · 7.5% · 30yr · 1.5% tax · 5.0% vac · 8.0% maint · 8.0% mgmt
Financing live
Cash to close
- Down payment
- $54,975
- Closing costs
- $6,597
- Reserves months
- —
- Total cash needed
- —
Loan-product check · same deal, 3 products live
Conventional
25% down · 7.5% · 30yr
- Down + closing
- —
- Monthly P&I
- —
- Monthly cashflow
- —
- DSCR
- —
- Eligible?
- —
Personal DTI + credit; lowest rate.
DSCR
20% down · 8.5% · 30yr
- Down + closing
- —
- Monthly P&I
- —
- Monthly cashflow
- —
- DSCR
- —
- Eligible?
- —
No personal income docs; deal must DSCR.
Hard money
10% down · 12.0% · 12mo
- Down + closing
- —
- Monthly P&I
- —
- Monthly cashflow
- —
- DSCR
- —
- Eligible?
- —
Short-term bridge; refi at stabilization.
Listing history 4 events
-
2026-05-31status $219,900 Pending 6 DOM
-
2026-05-23$219,900 Active
-
2000-05-15historical
-
1999-11-15$69,900
ⓘ Source: listings_history table (triggers on properties + properties_extension) + one-shot
backfill from property_details.listing_events for pre-trigger history.
Tax reassessment forecast OH · Partial reset (capped growth)
- Current annual tax
- $2,548 · $212/mo
- Projected year-2 tax
- $2,989 · $249/mo
- Expected delta
- +$441/yr (+$37/mo · 17.3%)
ⓘ Screening estimate from a state-policy table — verify with the county assessor before closing.
Climate risk First Street
- Flood 1/10 Low FEMA zone X (unshaded) · 0% chance over 30 yrs
- Wildfire 1/10 Low
- Heat 3/10 Moderate 7 d/yr ≥96°F today · 17 d/yr by 30 yrs out
- Wind 1/10 Low
- Air quality 2/10 Low 2 unhealthy d/yr today · 2 by 30 yrs out
Nearby sold comps map
Loading sold comps map…
Walkable amenities ~0.75 mi
Loading nearby amenities…
Taxation est. · year 1
- Rental income
- $19,820
- − Mortgage interest
- −$12,318
- − Property taxes
- −$2,548
- − Insurance
- −$1,100
- − Repairs & maintenance
- −$1,586
- − Management
- −$1,586
- − Depreciation
- −$6,397
- Taxable loss
- −$5,713
- Est. tax savings @ 24.0%
- +$1,371
- After-tax cash flow
- $-456/yr
For passive investors: Depreciation is non-cash, so a rental often shows a tax loss while cash-flowing — sheltering income. Rental losses are passive: they offset passive income freely, and up to $25,000/yr can offset ordinary (W-2) income if you actively participate and your MAGI is under $100k (phasing out to $0 by $150k); unused losses carry forward. On sale, claimed depreciation is recaptured at up to 25%, and gains may owe capital-gains tax (a 1031 exchange can defer both). Figures are a year-1 estimate at your 24.0% rate — not tax advice; consult a CPA.
Schools (NCES district)
- District
- Avon Lake City
- NCES district ID
- 3904812
- Math proficiency
- 78% ▼ -10.00%
- Reading proficiency
- 80% ▼ -6.00%
- Median HH income
- $79,608
- Composite
- 69.66/100
- National rank
- #296
- State rank
- #48 of 656 in OH
Livability — Avon Lake
- Score
- 84/100
- State rank
- #52
- US rank
- #736
Category grades
Schools grade is shown separately in the Schools card above.
Census & demographics
- Census place
- Avon Lake, OH
- County
- Lorain County · 219,437 people
- City population
- 25,752
- Metro
- Cleveland-Elyria, OH
- Population (ZIP)
- 25,752
- Household income
- $115,567
- Rent vs Own
- Severe rent burden
- 290.0
Population outlook (Lorain County) Hauer SSP2
- Today (2025)
- 314,924 people
- By 2030
- 317,546 · +0.8%
- By 2040
- 317,962 · +1.0%
- By 2050
- 312,872 · -0.7%
- By 2075
- 301,806 · -4.2%
- By 2100
- 278,271 · -11.6%
Race, ethnicity, and origin ACS 2023
- Neighborhood character
- Predominantly White (91%)
- Race & ethnicity
- White 91% Two or more races 4% Hispanic / Latino 3% Asian 2% Black 1%
- Common ancestry
- Romanian 8% Slovak 2% Lithuanian 1%
- Foreign-born
- 4% · Canada, China
- Languages at home
- 94% English-only · Spanish 2% Other Indo-European 1% Other Asian/Pacific 1%
Political lean MEDSL · Lorain
- 2024 margin
- Lean R (+5.7) · D 46.7% · R 52.4%
- 2008→2024 swing
- -23.6pp toward R · 2008: 17.9pp · 2024: -5.7pp
- All cycles
- 2024: R+5.7 2020: R+2.5 2016: R+0.3 2012: D+14.4 2008: D+17.9
Not yet ingested
- Civics
- —
Market trends
- HPI YoY
- ▼ -148.16%
- Current HPI
- 207.1177
- Rent YoY
- —
- Metro
- Cleveland-Elyria, OH
- State GDP YoY
- ▲ 1.98%
- F500 in state
- 48
Industry mix (Fortune 500 HQ in OH)
| Industry | F500 HQs | Revenue |
|---|---|---|
| Insurance | 3 | $145B |
|
||
| Industrial Machinery | 3 | $49B |
|
||
| Financial Services | 3 | $24B |
|
||
| Consumer Goods | 2 | $93B |
|
||
| Aerospace / Defense | 2 | $47B |
|
||
| Utilities | 2 | $33B |
|
||
Price history
+214.6% since first listed3 events — show timeline
- 2026-05-23 Listed $219,900 MLSNOW
- 2000-05-15 Listing Removed — MLSNOW
- 1999-11-15 Listed $69,900 MLSNOW
Property tax history
+5.2%/yrLatest (2025): $2,548 · +9.4% YoY. Source: county tax records.
Cash-flow waterfall
monthlySold comps — $/sqft
last 12 mo · ≤1 miLoading sold comps…