 Multi-family
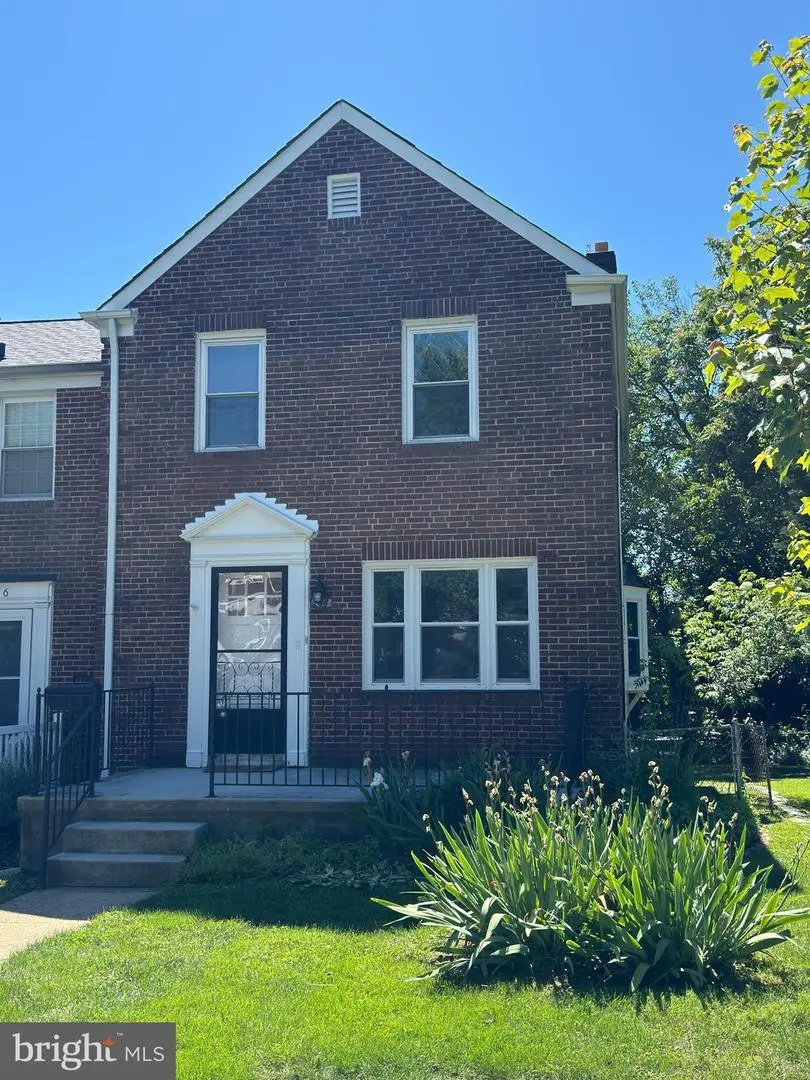
244 Blakeney Rd · Catonsville, MD
Flood risk 1/10 · Minimal
- FEMA flood zone
- X (unshaded)
- Chance of flooding over 30 yrs
- 0.0%
- Est. flood insurance / yr
- $473 – $860
Fire risk 1/10 · Minimal
- Est. fire insurance / yr
- $755 – $1,403
Heat risk 6/10 · Moderate
- Hot days now (above 103°F)
- 7 days/yr
- Hot days in 30 yrs
- 15 days/yr
Wind risk 5/10 · Moderate
- Chance of severe wind over 30 yrs
- 26.0%
Air-quality risk 3/10 · Minor
- Unhealthy air days now
- 3 days/yr
- Unhealthy air days in 30 yrs
- 4 days/yr
Risk factors via First Street. Map © Google.
Why this score? — see what drove the D grade
The composite is a weighted blend of 9 inputs, each scored 0–100. Each bar is that input's sub-score; the figure is the points it added to the 100-point composite (weight × sub-score).
- Cash flow +13.8/30.0
- ARV discount +7.5/15.0
- DSCR +4.2/10.0
- Livability +4.0/5.0
- 1% rule +3.5/10.0
- Rent growth +3.0/5.0
- Condition / age +2.5/5.0
- Schools +2.3/10.0
- Appreciation +0.0/10.0
$329,900
🖨 Deal sheet 📄 Offer letter ✓ Due diligence
Multi-family units
County records classify this as Multi-Family (2-4 Unit). Listing-text estimate: 1 unit. estimate disagrees with records
Key facts
- 3,737 sq ft lot
- Built 1955
- Listed 6 days
Property features AI
Finance
- Other: Total finished above-grade area and finished/unfinshed below-grade area recorded by assessor
- Financial info: Land and improvement assessed separately; Ground rent paid annually
Exterior
- Parking: Alley access; On-street parking
- Utilities: Public water; Public sewer
- Home design: Fee simple ownership; Built year according to assessor; Entry located at end of row
- Construction: Brick construction; Block foundation
- Exterior features: Above-grade and below-grade structures; No tidal water
Interior
- Bedrooms: Two one-bedroom units (multi-unit property)
- Heating & cooling: Forced air heating; Central air conditioning
- Interior features: End of Row/Townhouse structure
Neighborhood map
What this means for you Summary
Snapshot
- This is a 2-bed/2.0-bath multifamily listed at $330k.
Deal economics
- At list price, monthly cash flow is $30 ($355/yr) — positive.
- The deal already cash-flows at list — no discount required.
- To meet the 1% rule (rent ≥ 1% of price), the offer needs to be $279k (15.4% below list).
- Recommended offer: $279k (15.4% below list) — sets the bar for 1% rule.
- Cap rate 6.4% vs local median 3.4% in Catonsville — top-decile yield for the area; either an underpriced asset or a hidden risk that comps aren't pricing in. Stress-test before assuming the spread holds.
Location & tenants
- Location reads 81/100 on livability (#43 in MD, #1,586 nationally) — a professional / high-income tenant draw. Strengths: commute A+, employment A+, housing A+; Watch: crime D, cost of living D.
- Baltimore County Public Schools (suburban): math 15% / reading 34% proficiency, ranked #11 of 24 in MD (top 46%) — low school quality limits family demand, transient renter base, plan for 1-2y turnover.
- Market conditions: Rents rising (+1.9%/yr); 144 active listings in the ZIP; 27 comparable units currently listed for rent nearby; rentals leasing fast (median 5d on market — plan ~1-2 weeks tenant-placement turnaround); high-income renter base; 1,511 units permitted in Baltimore County in 2024 (643 in 5+ unit buildings).
Forward outlook
- Local home prices are declining (-3.0%/yr); year-one equity from $2k of loan paydown is wiped out by about $10k of value loss. Plan a longer hold.
- Baltimore County population projected at +12% by 2050 — modest demand growth; plan on rents tracking national, not racing it.
Negotiation context
- Only 7 days on market — expect competitive offers; lowballing is unlikely to land.
- Current owner paid $52k; list at $330k implies a 534% gain — meaningful room to come down on a strong offer.
Risks & watch-outs
- Watch-outs: built in 1955 — expect roof / HVAC / electrical / plumbing capex.
- Climate carrying-cost: moderate wind risk, 26% chance of damaging wind over 30y; extreme-heat days projected 7→15/yr by 2055 (HVAC capex compounding) — expect insurance premiums to compound above CPI over the hold.
Questions for the listing agent
- Built in 1955 — when were the roof, HVAC, electrical panel, plumbing, and water heater last replaced?
- Is there a deadline driving the sale (1031 exchange, divorce, estate, relocation)? That informs how much negotiation room exists.
- Crime grade is D in this area — have there been break-ins, vandalism, or insurance claims at this property in the last 3 years? What carrier currently insures it and at what premium?
- The area grade is low — what's the realistic commute time and amenity access for the typical tenant pool here? Any planned neighborhood developments (good or bad) we should know about?
- What's the average days-on-market for RENTAL listings here right now (not sales)? A rising rental-DOM trend means longer vacancies and softer asking-rent achievability than the comps imply.
- What's the recent tenant-quality profile in this submarket — average credit score on applications, eviction rate, late-payment / NSF rate, and stable-employment percentage? A property-management company in the area should have these aggregated.
- How much new apartment / multifamily construction is in the pipeline within 1–3 miles? Heavy new supply (>2% of stock underway) typically softens rents 12–24 months out; light construction supports rent growth.
Investment metrics
- 1% rule
- 0.85% ✗
- Cap rate
- 6.40%
- Cash-on-cash
- 0.38%
- DSCR
- 1.02
- GRM
- 9.9
CMA / ARV
No comps found within radius.
Projected returns pro-forma
-3.0% appreciation · 1.87% rent growth · sell at horizon
- IRR
- -16.9%
- Equity multiple
- 0.41×
- Total profit
- $-54,734
- Equity at exit
- $49,189
- IRR
- -10.9%
- Equity multiple
- 0.37×
- Total profit
- $-57,911
- Equity at exit
- $28,524
Cash invested: $92,372 (down + closing). Projections, not guarantees.
Landlord ↔ Tenant lean methodology
- Overall (STATE)
- 27 Tenant-Leaning
- State Maryland
- 27 Tenant-Leaning · D+14
- County
- — inherits STATE
- City
- — inherits STATE
ZIP-level market 21228
- Rents YoY
- 1.9%
- Active inventory
- 144
- Price-to-rent
- 19.7×
Monthly cashflow live
- Estimated rent
- $2,791 high interval (Pro) →
- Mortgage (P&I)
- −$1,730
- Tax from tax record
- −$308 /mo · $3,694/yr
- Insurance
- −$137
- HOA
- −$0
- Vacancy / Maint / Mgmt
- −$586
- Net cashflow
- $30
Break-even live
2-unit breakdown (identical units grouped — click to expand)
| Units | Beds | Baths | Est. rent |
|---|---|---|---|
| 2× units | 2 | 1 | $2,790 |
| #1 | 2 | 1 | $1,395 |
| #2 | 2 | 1 | $1,395 |
| Total (2 units) | $2,791 | ||
UW: 25.0% down · 7.5% · 30yr · 1.5% tax · 5.0% vac · 8.0% maint · 8.0% mgmt
Financing live
Cash to close
- Down payment
- $82,475
- Closing costs
- $9,897
- Reserves months
- —
- Total cash needed
- —
Loan-product check · same deal, 3 products live
Conventional
25% down · 7.5% · 30yr
- Down + closing
- —
- Monthly P&I
- —
- Monthly cashflow
- —
- DSCR
- —
- Eligible?
- —
Personal DTI + credit; lowest rate.
DSCR
20% down · 8.5% · 30yr
- Down + closing
- —
- Monthly P&I
- —
- Monthly cashflow
- —
- DSCR
- —
- Eligible?
- —
No personal income docs; deal must DSCR.
Hard money
10% down · 12.0% · 12mo
- Down + closing
- —
- Monthly P&I
- —
- Monthly cashflow
- —
- DSCR
- —
- Eligible?
- —
Short-term bridge; refi at stabilization.
Rent comps 27 comps
| Address | Beds | Baths | Sqft | Rent | $/sqft | DOM | Units | Dist |
|---|---|---|---|---|---|---|---|---|
| 51 Briarwood Rd Catonsville, MD | 3.0 | 1.0 | 1200 | $2,100 | $1.75 | 43d | 1 | 0.41mi |
| 6300 Mount Ridge Rd Unit A Catonsville, MD | 2.0 | 1.0 | 1100 | $1,750 | $1.59 | 43d | 1 | 0.42mi |
| 201 S Symington Ave Catonsville, MD | 1.0–2.0 | 1.0 | 788 | $1,519 | $1.93 | 1d | 13 | 0.46mi |
| 6316 Frederick Rd Unit 2 Catonsville, MD | 1.0 | 1.0 | 1498 | $1,150 | $0.77 | 2d | 1 | 0.47mi |
| 609 Wallerson Rd Catonsville, MD | 3.0 | 2.0 | 1704 | $3,395 | $1.99 | 20d | 1 | 0.49mi |
| 39 Bloomsbury Ave Unit 1 Catonsville, MD | 2.0 | 1.0 | 1100 | $1,800 | $1.64 | 43d | 1 | 0.50mi |
| 311 Harlem Ln Catonsville, MD | 3.0 | 2.0 | 1152 | $2,300 | $2.00 | 4d | 1 | 0.67mi |
| 238 Oglethorpe Rd Catonsville, MD | 2.0 | 1.0 | 968 | $1,650 | $1.70 | 4d | 1 | 0.69mi |
| 417 Wheaton Pl Catonsville, MD | 1.0 | 1.0 | 1000 | $1,859 | $1.86 | 43d | 1 | 0.71mi |
| 417 Wheaton Pl Catonsville, MD | 1.0 | 1.0 | 1000 | $1,819 | $1.82 | 2d | 1 | 0.71mi |
| 417 Wheaton Pl Catonsville, MD | 2.0 | 1.0 | 1200 | $2,169 | $1.81 | 3d | 1 | 0.71mi |
| 220 Stonecroft Rd Unit 230-D Baltimore, MD | 2.0 | 1.5 | 900 | $1,395 | $1.55 | 21d | 1 | 0.92mi |
| 220 Stonecroft Rd Unit 232-I Baltimore, MD | 2.0 | 1.5 | 900 | $1,295 | $1.44 | 17d | 1 | 0.92mi |
| 408 Shade Tree Pl Catonsville, MD | 1.0–2.0 | 1.0–2.0 | 805 | $1,812 | $2.25 | 4d | 1 | 0.95mi |
| 1 Summit Hill Ct Unit T-2 Baltimore, MD | 2.0 | 2.0 | 1009 | $1,900 | $1.88 | 43d | 1 | 0.98mi |
| 5364 Jamestowne Ct Baltimore, MD | 3.0 | 1.0–1.5 | 787 | $1,590 | $2.02 | 4d | 13 | 1.02mi |
| 131 N Bend Rd Unit 131-1B Baltimore, MD | 2.0 | 1.5 | 910 | $1,225 | $1.35 | 21d | 1 | 1.10mi |
| 526 Random Rd Unit 1ST FLOOR Baltimore, MD | 1.0 | 1.0 | 1140 | $1,250 | $1.10 | 43d | 1 | 1.18mi |
| 670 Queensgate Rd Baltimore, MD | 3.0 | 2.0 | 1600 | $2,100 | $1.31 | 4d | 1 | 1.22mi |
| 603 Braeside Rd Baltimore, MD | 3.0 | 2.0 | 1416 | $2,400 | $1.69 | 43d | 1 | 1.23mi |
| 5147 Frederick Ave Baltimore, MD | 3.0 | 2.0 | 1216 | $1,950 | $1.60 | 3d | 1 | 1.25mi |
| 501 Hazlett Ave Baltimore, MD | 2.0–3.0 | 1.5–2.0 | 1044 | $1,395 | $1.34 | 1d | 8 | 1.34mi |
| 410 Winters Ln Catonsville, MD | 2.0 | 2.0 | 1296 | $2,000 | $1.54 | 4d | 1 | 1.39mi |
| 930 Masefield Rd Unit 1 Woodlawn, MD | 3.0 | 1.5 | 1080 | $2,650 | $2.45 | 2d | 1 | 1.42mi |
| 565 Brisbane Rd Baltimore, MD | 2.0 | 2.0 | 1146 | $1,675 | $1.46 | 23d | 1 | 1.46mi |
| 4700 Gateway Ter Arbutus, MD | 1.0–3.0 | 1.0 | 728 | $1,336 | $1.84 | 43d | 1 | 1.47mi |
| 4630 Warren Tree Way Baltimore, MD | 3.0 | 1.5 | 1736 | $2,500 | $1.44 | 4d | 1 | 1.48mi |
Listing history 12 events
-
2026-06-18days on market $329,900 Active 7 DOM
-
2026-06-17days on market $329,900 Active 6 DOM
-
2026-06-16days on market $329,900 Active 5 DOM
-
2026-06-15days on market $329,900 Active 4 DOM
-
2026-06-13statusdays on market $329,900 Active 2 DOM
-
2026-06-09days on market $329,900 Coming Soon 9 DOM
-
2026-06-08days on market $329,900 Coming Soon 8 DOM
-
2026-06-07days on market $329,900 Coming Soon 7 DOM
-
2026-06-04days on market $329,900 Coming Soon 4 DOM
-
2026-06-03days on market $329,900 Coming Soon 3 DOM
-
2026-06-02days on market $329,900 Coming Soon 2 DOM
-
2026-06-01$329,900 Coming Soon 1 DOM
ⓘ Source: listings_history table (triggers on properties + properties_extension) + one-shot
backfill from property_details.listing_events for pre-trigger history.
Tax reassessment forecast MD · Partial reset (capped growth)
- Current annual tax
- $3,694 · $308/mo
- Projected year-2 tax
- $3,694 · $308/mo
- Expected delta
- $0/yr ($0/mo · 0.0%)
ⓘ Screening estimate from a state-policy table — verify with the county assessor before closing.
Climate risk First Street
- Flood 1/10 Low FEMA zone X (unshaded) · 0% chance over 30 yrs
- Wildfire 1/10 Low
- Heat 6/10 Major 7 d/yr ≥103°F today · 15 d/yr by 30 yrs out
- Wind 5/10 Major 26% chance of damaging wind over 30 yrs
- Air quality 3/10 Moderate 3 unhealthy d/yr today · 4 by 30 yrs out
Nearby sold comps map
Loading sold comps map…
Walkable amenities ~0.75 mi
Loading nearby amenities…
Taxation est. · year 1
- Rental income
- $33,492
- − Mortgage interest
- −$18,480
- − Property taxes
- −$3,694
- − Insurance
- −$1,650
- − Repairs & maintenance
- −$2,679
- − Management
- −$2,679
- − Depreciation
- −$9,597
- Taxable loss
- −$5,287
- Est. tax savings @ 24.0%
- +$1,269
- After-tax cash flow
- $1,624/yr
For passive investors: Depreciation is non-cash, so a rental often shows a tax loss while cash-flowing — sheltering income. Rental losses are passive: they offset passive income freely, and up to $25,000/yr can offset ordinary (W-2) income if you actively participate and your MAGI is under $100k (phasing out to $0 by $150k); unused losses carry forward. On sale, claimed depreciation is recaptured at up to 25%, and gains may owe capital-gains tax (a 1031 exchange can defer both). Figures are a year-1 estimate at your 24.0% rate — not tax advice; consult a CPA.
Schools (NCES district)
- District
- Baltimore County Public Schools
- NCES district ID
- 2400120
- Math proficiency
- 15% ▼ -16.00%
- Reading proficiency
- 34% ▼ -5.00%
- Median HH income
- $66,746
- Composite
- 23.17/100
- National rank
- #7948
- State rank
- #11 of 24 in MD
Livability — Catonsville
- Score
- 81/100
- State rank
- #43
- US rank
- #1586
Category grades
Schools grade is shown separately in the Schools card above.
Census & demographics
- Census place
- Catonsville, MD
- County
- Baltimore County · 769,527 people
- City population
- 50,492
- Metro
- Baltimore-Columbia-Towson, MD
- Population (ZIP)
- 50,492
- Household income
- $112,656
- Rent vs Own
- Severe rent burden
- 1820.0
Population outlook (Baltimore County) Hauer SSP2
- Today (2025)
- 885,518 people
- By 2030
- 909,272 · +2.7%
- By 2040
- 951,547 · +7.5%
- By 2050
- 990,955 · +11.9%
- By 2075
- 1,086,411 · +22.7%
- By 2100
- 1,135,078 · +28.2%
Race, ethnicity, and origin ACS 2023
- Neighborhood character
- Diverse neighborhood (Simpson 0.64)
- Race & ethnicity
- White 55% Black 18% Asian 14% Hispanic / Latino 7% Two or more races 7%
- Hispanic origin (detail)
- Mexican 1%
- Common ancestry
- Romanian 3% Italian 2% Slovak 2%
- Foreign-born
- 16% · Canada, Philippines, Vietnam
- Languages at home
- 81% English-only · Other Indo-European 7% Spanish 5% Other Asian/Pacific 2%
Political lean MEDSL · Baltimore
- 2024 margin
- Strong D (+24.5) · D 61.0% · R 36.5% · Other 2.5%
- 2008→2024 swing
- +9.9pp toward D · 2008: 14.6pp · 2024: 24.5pp
- All cycles
- 2024: D+24.5 2020: D+27.0 2016: D+17.4 2012: D+16.4 2008: D+14.6
Not yet ingested
- Civics
- —
Market trends
- HPI YoY
- ▼ -370.51%
- Current HPI
- 282.1593
- Rent YoY
- ▲ 1.87%
- Metro
- Baltimore-Columbia-Towson, MD
- State GDP YoY
- ▲ 2.97%
- F500 in state
- 12
Industry mix (Fortune 500 HQ in MD)
| Industry | F500 HQs | Revenue |
|---|---|---|
| Aerospace / Defense | 1 | $71B |
|
||
| Utilities | 1 | $25B |
|
||
| Hotels | 1 | $24B |
|
||
| Consumer Goods | 1 | $7B |
|
||
| Real Estate | 1 | $6B |
|
||
| Chemicals | 1 | $2B |
|
||
Price history
+534.4% since first listed2 events — show timeline
- 2026-05-31 Coming Soon $329,900 BRIGHT MLS
- 1982-10-22 Sold (Public Records) $52,000 Public Records
Property tax history
+1.1%/yrLatest (2025): $3,694 · +9.7% YoY. Source: county tax records.
Cash-flow waterfall
monthlySold comps — $/sqft
last 12 mo · ≤1 miLoading sold comps…