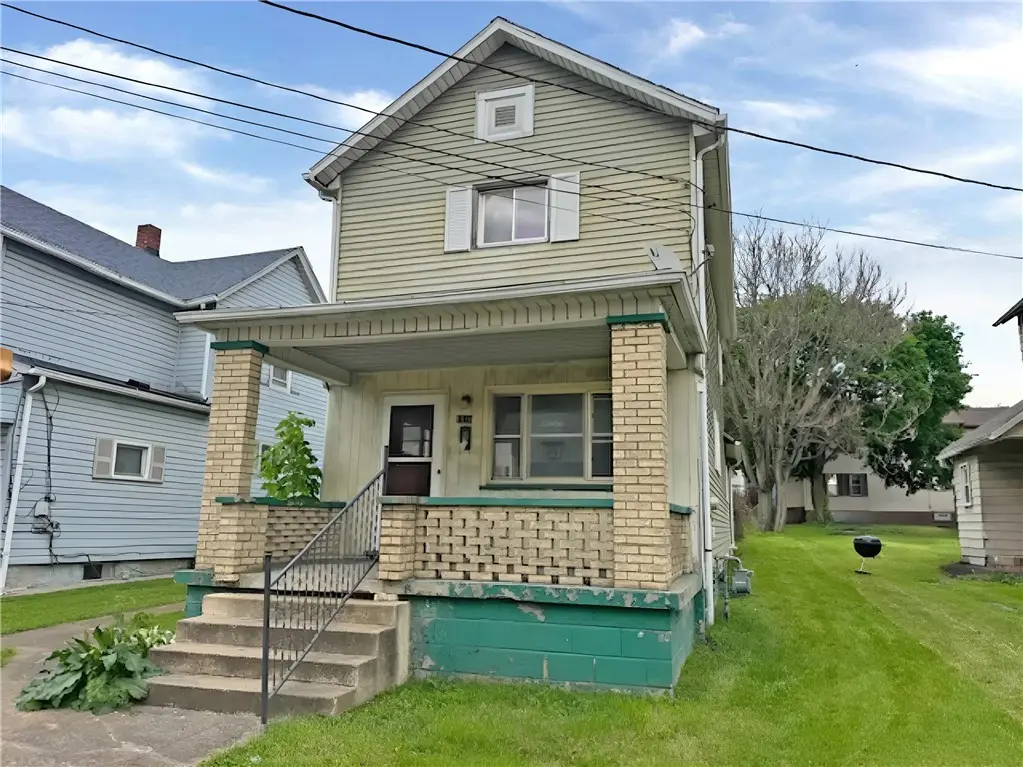
1111 Pollock Ave · New Castle, PA
Flood risk 1/10 · Minimal
- FEMA flood zone
- X (unshaded)
- Chance of flooding over 30 yrs
- 0.0%
- Est. flood insurance / yr
- $473 – $860
Fire risk 1/10 · Minimal
- Est. fire insurance / yr
- $511 – $949
Heat risk 3/10 · Minor
- Hot days now (above 96°F)
- 7 days/yr
- Hot days in 30 yrs
- 18 days/yr
Wind risk 1/10 · Minimal
- Chance of severe wind over 30 yrs
- —
Air-quality risk 2/10 · Minimal
- Unhealthy air days now
- 1 days/yr
- Unhealthy air days in 30 yrs
- 3 days/yr
Risk factors via First Street. Map © Google.
Why this score? — see what drove the B- grade
The composite is a weighted blend of 9 inputs, each scored 0–100. Each bar is that input's sub-score; the figure is the points it added to the 100-point composite (weight × sub-score).
- Cash flow +30.0/30.0
- 1% rule +10.0/10.0
- DSCR +10.0/10.0
- ARV discount +6.2/15.0
- Rent growth +5.0/5.0
- Livability +4.1/5.0
- Condition / age +2.5/5.0
- Schools +1.1/10.0
- Appreciation +0.0/10.0
$45,000
🖨 Deal sheet 📄 Offer letter ✓ Due diligence
Listing remarks MLS
HOME HAS BEEN WELL MAINTAINED. GREAT FIRST HOME OR INVESTMENT LEVEL LOT
Key facts
- Usable yard space
- Front porch
- Large kitchen
Tags
Property features AI
Exterior
- Parking: On-street parking
- Home design: 2-story building; Composition roof
- Exterior features: Lot approximately 0.13 acres; Resale condition
Interior
- Bathrooms: 1 full bathroom
- Interior features: Unfinished basement with interior entry
Neighborhood map
What this means for you Summary
Snapshot
- This is a 2-bed/1.0-bath single-family listed at $45k.
Deal economics
- At list price, monthly cash flow is $639 ($8k/yr) — positive.
- The deal already cash-flows at list — no discount required.
- Meets the 1% rule at list price ($1k rent vs $45k).
- Recommended offer: $44k (1.5% below list) — sets the bar for market timing.
- Cap rate 23.3% vs local median 8.7% in New Castle — top-decile yield for the area; either an underpriced asset or a hidden risk that comps aren't pricing in. Stress-test before assuming the spread holds.
Location & tenants
- Location reads 82/100 on livability (#137 in PA, #1,120 nationally) — a professional / high-income tenant draw. Strengths: crime A+, commute A+, cost of living A+; Watch: amenities F, employment F.
- New Castle Area SD (town): math 9% / reading 19% proficiency, ranked #519 of 539 in PA (top 96%) — low school quality limits family demand, transient renter base, plan for 1-2y turnover; 66% free/reduced lunch — lower-income household profile, screen leases tightly.
- Market conditions: Rents rising fast (+20.1%/yr); 118 active listings in the ZIP; 7 comparable units currently listed for rent nearby; rentals lingering (median 44d on market — plan ~5-8 weeks vacancy on turnover, expect pricing pressure); 100% of comp listings sitting > 30 days — soft ceiling on asking rent; 51 units permitted in Lawrence County in 2024 (0 in 5+ unit buildings).
Forward outlook
- Local home prices are declining (-3.0%/yr); year-one equity from $311 of loan paydown is wiped out by about $1k of value loss. Plan a longer hold.
- Lawrence County population projected at -25% by 2050 — secular population decline; favor cash flow + early exit over multi-decade hold.
- At projected returns (-3.0% appreciation + 8.0% rent growth), your $13k cash investment doubles in ~2 years — after that, you're playing with house money.
Negotiation context
- It's been on market 17 days — a 2% lower offer ($44k) is reasonable based on typical stale-listing flexibility.
- 3 sale attempts since 30y ago with the ask held roughly flat each time — persistent listings suggest the price (not the market) is what's stuck; bring a comps-based counter.
- Current owner paid $24k; list at $45k implies a 91% gain — meaningful room to come down on a strong offer.
Risks & watch-outs
- Watch-outs: property tax is 2.6% of price; built in 1920 — expect roof / HVAC / electrical / plumbing capex.
Questions for the listing agent
- Built in 1920 — when were the roof, HVAC, electrical panel, plumbing, and water heater last replaced?
- Property tax is high relative to price — has the assessment been appealed recently, and will the sale trigger a re-assessment?
- Is there a deadline driving the sale (1031 exchange, divorce, estate, relocation)? That informs how much negotiation room exists.
- What's the average days-on-market for RENTAL listings here right now (not sales)? A rising rental-DOM trend means longer vacancies and softer asking-rent achievability than the comps imply.
- What's the recent tenant-quality profile in this submarket — average credit score on applications, eviction rate, late-payment / NSF rate, and stable-employment percentage? A property-management company in the area should have these aggregated.
- How much new for-sale + rental construction is in the pipeline within 1–3 miles? Heavy new supply typically softens prices + rents 12–24 months out; constrained supply supports both.
Investment metrics
- 1% rule
- 2.79% ✓
- Cap rate
- 23.33%
- Cash-on-cash
- 60.85%
- DSCR
- 3.71
- GRM
- 3.0
CMA / ARV
- ARV (on-the-fly)
- $43,776
- Comps found
- 12
Show comp detail 12 sales within ~0.75 mi
| Address | Dist | Beds/Ba | Sqft | Sold | Price | $/sf | Match |
|---|---|---|---|---|---|---|---|
| 311 E Reynolds St | 0.03mi | 2/1.0 | 1,136 (-7%) | 0mo | $10,000 | $9 | 87 |
| 221 Friendship St | 0.30mi | 2/1.0 | 1,184 (-3%) | 0mo | $23,000 | $19 | 81 |
| 506 E Long Ave | 0.13mi | 3/1.0 (+1) | 1,280 (+5%) | 2mo | $9,500 | $7 | 79 |
| 1308 Cunningham Ave | 0.24mi | 3/1.0 (+1) | 1,288 (+6%) | 1mo | $25,000 | $19 | 73 |
| 1203 Cunningham Ave | 0.23mi | 3/1.0 (+1) | 1,328 (+9%) | 3mo | $25,000 | $19 | 66 |
| 18 W Chartes St | 0.57mi | 3/1.0 (+1) | 1,200 (-1%) | 2mo | $54,000 | $45 | 65 |
| 418 E Division St | 0.32mi | 3/1.5 (+1) | 1,120 (-8%) | 0mo | $18,000 | $16 | 65 |
| 827 Morton St | 0.53mi | 3/1.0 (+1) | 1,123 (-8%) | 0mo | $40,000 | $36 | 57 |
| 1816 Moravia St | 0.74mi | 3/2.0 (+1) | 1,204 (-1%) | 2mo | $95,000 | $79 | 53 |
| 110 W Chartes St | 0.63mi | 3/2.0 (+1) | 1,308 (+8%) | 3mo | $55,000 | $42 | 46 |
| 1307 Huron Ave | 0.71mi | 3/1.0 (+1) | 1,320 (+9%) | 2mo | $86,000 | $65 | 46 |
| 746 Castle St | 0.64mi | 3/1.0 (+1) | 1,066 (-12%) | 2mo | $169,900 | $159 | 43 |
Match score weights: distance 35% · size 25% · config 20% · recency 20%. Top-matched comps best support the ARV.
Projected returns pro-forma
-3.0% appreciation · 8.0% rent growth · sell at horizon
- IRR
- 65.5%
- Equity multiple
- 4.18×
- Total profit
- $40,081
- Equity at exit
- $6,710
- IRR
- 71.5%
- Equity multiple
- 10.34×
- Total profit
- $117,683
- Equity at exit
- $3,891
Cash invested: $12,600 (down + closing). Projections, not guarantees.
Landlord ↔ Tenant lean methodology
- Overall (STATE)
- 62 Landlord-Friendly
- State Pennsylvania
- 62 Landlord-Friendly · EVEN
- County
- — inherits STATE
- City
- — inherits STATE
ZIP-level market 16101
- Home prices YoY
- -26.3%
- Rents YoY
- 20.1%
- Active inventory
- 118
- Price-to-rent
- 3.0×
Monthly cashflow live
- Estimated rent
- $1,256 high interval (Pro) →
- Mortgage (P&I)
- −$236
- Tax from tax record
- −$98 /mo · $1,179/yr
- Insurance
- −$19
- HOA
- −$0
- Vacancy / Maint / Mgmt
- −$264
- Net cashflow
- $639
Break-even live
UW: 25.0% down · 7.5% · 30yr · 1.5% tax · 5.0% vac · 8.0% maint · 8.0% mgmt
Financing live
Cash to close
- Down payment
- $11,250
- Closing costs
- $1,350
- Reserves months
- —
- Total cash needed
- —
Loan-product check · same deal, 3 products live
Conventional
25% down · 7.5% · 30yr
- Down + closing
- —
- Monthly P&I
- —
- Monthly cashflow
- —
- DSCR
- —
- Eligible?
- —
Personal DTI + credit; lowest rate.
DSCR
20% down · 8.5% · 30yr
- Down + closing
- —
- Monthly P&I
- —
- Monthly cashflow
- —
- DSCR
- —
- Eligible?
- —
No personal income docs; deal must DSCR.
Hard money
10% down · 12.0% · 12mo
- Down + closing
- —
- Monthly P&I
- —
- Monthly cashflow
- —
- DSCR
- —
- Eligible?
- —
Short-term bridge; refi at stabilization.
Rent comps 7 comps
| Address | Beds | Baths | Sqft | Rent | $/sqft | DOM | Units | Dist |
|---|---|---|---|---|---|---|---|---|
| 503 Galbreath St New Castle, PA | 2.0 | 1.0 | 1228 | $1,295 | $1.05 | 43d | 1 | 0.30mi |
| 712 E Reynolds St New Castle, PA | 3.0 | 1.0 | 1182 | $975 | $0.82 | 43d | 1 | 0.38mi |
| 1112 Williams St New Castle, PA | 2.0 | 1.0 | 1026 | $1,400 | $1.36 | 43d | 1 | 0.42mi |
| 1605 S Jefferson St New Castle, PA | 3.0 | 1.0 | 1500 | $1,500 | $1.00 | 43d | 1 | 0.44mi |
| 1708 Moravia St New Castle, PA | 3.0 | 2.0 | 1500 | $1,500 | $1.00 | 43d | 1 | 0.68mi |
| 932 Morton St New Castle, PA | 3.0 | 1.0 | 1440 | $1,375 | $0.95 | 43d | 1 | 0.74mi |
| 1056 Adams St New Castle, PA | 3.0 | 1.0 | 1116 | $1,500 | $1.34 | 43d | 1 | 1.10mi |
Listing history 12 events
-
2026-06-19days on market $45,000 Active 17 DOM
-
2026-06-18days on market $45,000 Active 16 DOM
-
2026-06-17days on market $45,000 Active 15 DOM
-
2026-06-16days on market $45,000 Active 14 DOM
-
2026-06-15days on market $45,000 Active 13 DOM
-
2026-06-14days on market $45,000 Active 11 DOM
-
2026-06-12days on market $45,000 Active 10 DOM
-
2026-06-09days on market $45,000 Active 7 DOM
-
2026-06-08days on market $45,000 Active 6 DOM
-
2026-06-07days on market $45,000 Active 5 DOM
-
2026-06-03remarks 699-char remark
-
2026-06-03$45,000 Active 1 DOM
ⓘ Source: listings_history table (triggers on properties + properties_extension) + one-shot
backfill from property_details.listing_events for pre-trigger history.
Tax reassessment forecast PA · Partial reset (capped growth)
- Current annual tax
- $1,179 · $98/mo
- Projected year-2 tax
- $1,179 · $98/mo
- Expected delta
- $0/yr ($0/mo · 0.0%)
ⓘ Screening estimate from a state-policy table — verify with the county assessor before closing.
Climate risk First Street
- Flood 1/10 Low FEMA zone X (unshaded) · 0% chance over 30 yrs
- Wildfire 1/10 Low
- Heat 3/10 Moderate 7 d/yr ≥96°F today · 18 d/yr by 30 yrs out
- Wind 1/10 Low
- Air quality 2/10 Low 1 unhealthy d/yr today · 3 by 30 yrs out
Nearby sold comps map
Loading sold comps map…
Walkable amenities ~0.75 mi
Loading nearby amenities…
Taxation est. · year 1
- Rental income
- $15,066
- − Mortgage interest
- −$2,521
- − Property taxes
- −$1,179
- − Insurance
- −$225
- − Repairs & maintenance
- −$1,205
- − Management
- −$1,205
- − Depreciation
- −$1,309
- Taxable income
- $7,422
- Est. tax owed @ 24.0%
- −$1,781
- After-tax cash flow
- $5,886/yr
For passive investors: Depreciation is non-cash, so a rental often shows a tax loss while cash-flowing — sheltering income. Rental losses are passive: they offset passive income freely, and up to $25,000/yr can offset ordinary (W-2) income if you actively participate and your MAGI is under $100k (phasing out to $0 by $150k); unused losses carry forward. On sale, claimed depreciation is recaptured at up to 25%, and gains may owe capital-gains tax (a 1031 exchange can defer both). Figures are a year-1 estimate at your 24.0% rate — not tax advice; consult a CPA.
Schools (NCES district)
- District
- New Castle Area SD
- NCES district ID
- 4216620
- Math proficiency
- 9% ▼ -13.00%
- Reading proficiency
- 19% ▼ -23.00%
- Median HH income
- $30,967
- Composite
- 11.08/100
- National rank
- #9736
- State rank
- #519 of 539 in PA
Livability — New Castle
- Score
- 82/100
- State rank
- #137
- US rank
- #1120
Category grades
Schools grade is shown separately in the Schools card above.
Census & demographics
- Census place
- New Castle, PA
- County
- Lawrence County · 30,767 people
- City population
- 30,767
- Metro
- New Castle, PA
- Population (ZIP)
- 30,767
- Household income
- $51,128
- Rent vs Own
- Severe rent burden
- 1047.0
Population outlook (Lawrence County) Hauer SSP2
- Today (2025)
- 81,781 people
- By 2030
- 77,978 · -4.7%
- By 2040
- 69,522 · -15.0%
- By 2050
- 61,344 · -25.0%
- By 2075
- 45,027 · -44.9%
- By 2100
- 31,305 · -61.7%
Race, ethnicity, and origin ACS 2023
- Neighborhood character
- Predominantly White (82%)
- Race & ethnicity
- White 82% Two or more races 8% Black 7% Hispanic / Latino 3%
- Common ancestry
- Romanian 7% Serbian 3% Iranian 1%
- Foreign-born
- 2% · Canada
- Languages at home
- 96% English-only · Spanish 2% Other Indo-European 1%
Political lean MEDSL · Lawrence
- 2024 margin
- Solid R (+33.8) · D 32.8% · R 66.5%
- 2008→2024 swing
- -28.7pp toward R · 2008: -5.1pp · 2024: -33.8pp
- All cycles
- 2024: R+33.8 2020: R+29.6 2016: R+28.1 2012: R+9.0 2008: R+5.1
Not yet ingested
- Civics
- —
Market trends
- HPI YoY
- ▼ -56.77%
- Current HPI
- 159.3091
- Rent YoY
- ▲ 20.05%
- Metro
- New Castle, PA
- State GDP YoY
- ▲ 1.68%
- F500 in state
- 34
Industry mix (Fortune 500 HQ in PA)
| Industry | F500 HQs | Revenue |
|---|---|---|
| Healthcare | 2 | $309B |
|
||
| Insurance | 2 | $27B |
|
||
| Telecommunications / Media | 1 | $124B |
|
||
| Industrial Distribution | 1 | $22B |
|
||
| Financial Services | 1 | $20B |
|
||
| Chemicals / Materials | 1 | $18B |
|
||
Price history
+80.0% since first listed6 events — show timeline
- 2026-06-01 Listed $45,000 West Penn MLS
- 2025-08-11 Price Changed $64,900 AVBREALTORS
- 2025-05-30 Listed $74,900 AVBREALTORS
- 1997-05-28 Sold (Public Records) $23,500 Public Records
- 1997-05-28 Sold (MLS) $23,500 West Penn MLS
- 1996-09-24 Listed $25,000 West Penn MLS
Property tax history
+1.9%/yrLatest (2026): $1,179 · +2.0% YoY. Source: county tax records.
Cash-flow waterfall
monthlySold comps — $/sqft
last 12 mo · ≤1 miLoading sold comps…