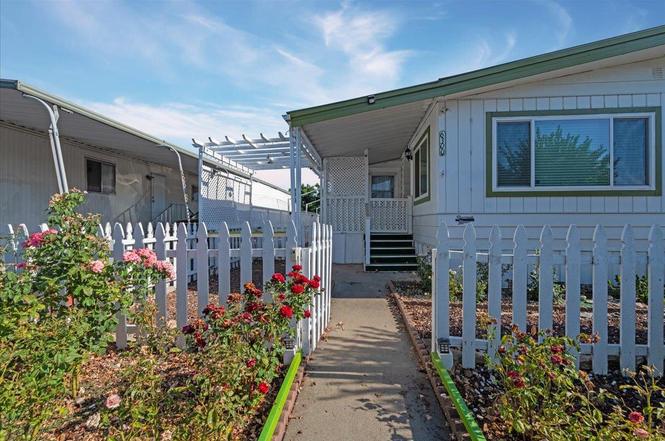
6300 Election Ln #118 · Sacramento, CA
Flood risk 1/10 · Minimal
- FEMA flood zone
- X (shaded)
- Chance of flooding over 30 yrs
- 0.0%
- Est. flood insurance / yr
- $507 – $1,088
Fire risk 1/10 · Minimal
- Est. fire insurance / yr
- $659 – $1,223
Heat risk 7/10 · Major
- Hot days now (above 102°F)
- 7 days/yr
- Hot days in 30 yrs
- 15 days/yr
Wind risk 1/10 · Minimal
- Chance of severe wind over 30 yrs
- —
Air-quality risk 10/10 · Severe
- Unhealthy air days now
- 28 days/yr
- Unhealthy air days in 30 yrs
- 33 days/yr
Risk factors via First Street. Map © Google.
Why this score? — see what drove the B+ grade
The composite is a weighted blend of 9 inputs, each scored 0–100. Each bar is that input's sub-score; the figure is the points it added to the 100-point composite (weight × sub-score).
- Cash flow +30.0/30.0
- ARV discount +15.0/15.0
- 1% rule +10.0/10.0
- DSCR +10.0/10.0
- Livability +3.6/5.0
- Schools +3.5/10.0
- Condition / age +2.5/5.0
- Rent growth +2.4/5.0
- Appreciation +1.3/10.0
$99,000
🖨 Deal sheet 📄 Offer letter ✓ Due diligence
Listing remarks
Welcome to your new home in an all-age community park located in the heart of Sacramento's 95828 zip code! This well-cared-for mobile home offers comfortable living with a blend of privacy, convenience, and community amenities perfect for families, retirees, or first-time buyers looking for an affordable Sacramento lifestyle. Situated on a private corner lot, the home offers a spacious layout with 2 bedrooms, 2 bathrooms, and over 1200 sq ft of living space. This unit includes some dual-pane windows for energy efficiency, laminate floors, a covered carport, and an outdoor storage shed for added convenience. The lot is low-maintenance and offers the flexibility for personalization, whether t
Key facts
- Low-maintenance lot
- Dual-pane windows
- Outdoor storage shed
Tags
Neighborhood map
What this means for you Summary
Snapshot
- This is a 2-bed/2.0-bath manufactured listed at $99k.
Deal economics
- At list price, monthly cash flow is $1k ($13k/yr) — positive.
- The deal already cash-flows at list — no discount required.
- Meets the 1% rule at list price ($2k rent vs $99k).
- Recommended offer: $90k (9.0% below list) — sets the bar for market timing.
- Cap rate 19.0% vs local median 3.0% in Sacramento — top-decile yield for the area; either an underpriced asset or a hidden risk that comps aren't pricing in. Stress-test before assuming the spread holds.
Location & tenants
- Location reads 71/100 on livability (#218 in CA) — a middle-class / working-renter tenant base. Strengths: amenities A+, commute A+, housing A; Watch: schools D+, crime F, cost of living F.
- Sacramento City Unified (urban): math 32% / reading 43% proficiency, ranked #804 of 1,400 in CA (top 57%) — families likely to look elsewhere, expect single-tenant / working-renter base with shorter leases; 63% free/reduced lunch — lower-income household profile, screen leases tightly.
- Market conditions: Rents soft (-0.2%/yr); 212 active listings in the ZIP; 24 comparable units currently listed for rent nearby; rentals at typical pace (median 24d on market — plan ~3-4 weeks tenant-placement turnaround); 42% of comp listings sitting > 30 days — soft ceiling on asking rent; solid renter incomes; 6,825 units permitted in Sacramento County in 2024 (1,752 in 5+ unit buildings).
- This rent runs 32% of the median local income ($82k/yr) — at the standard rent-burdened threshold; future hikes will face affordability resistance.
Forward outlook
- Local home prices are declining (-3.0%/yr); year-one equity from $684 of loan paydown is wiped out by about $3k of value loss. Plan a longer hold.
- Sacramento County population projected at +17% by 2050 — long-run rental-demand tailwind backs the buy-and-hold thesis.
- At projected returns (-3.0% appreciation + 0.0% rent growth), your $28k cash investment doubles in ~3 years — after that, you're playing with house money.
Negotiation context
- It's been on market 105 days — a 9% lower offer ($90k) is reasonable based on typical stale-listing flexibility.
Risks & watch-outs
- Climate carrying-cost: extreme-heat days projected 7→15/yr by 2055 (HVAC capex compounding) — expect insurance premiums to compound above CPI over the hold.
Questions for the listing agent
- It's been on market 105 days. Have you received any prior offers? Is the seller open to a 9% concession, seller financing, or rate buy-down credit?
- Built in 1975 — when were the roof, HVAC, electrical panel, plumbing, and water heater last replaced?
- Why hasn't it sold? Are there any deal-killer items the seller is aware of (foundation, flood, title, zoning, code violations)?
- Is there a deadline driving the sale (1031 exchange, divorce, estate, relocation)? That informs how much negotiation room exists.
- Schools are D-rated, which usually means shorter tenancies and higher turnover. Who's the typical renter profile here, and what's been the actual vacancy rate?
- Crime grade is F in this area — have there been break-ins, vandalism, or insurance claims at this property in the last 3 years? What carrier currently insures it and at what premium?
- What's the average days-on-market for RENTAL listings here right now (not sales)? A rising rental-DOM trend means longer vacancies and softer asking-rent achievability than the comps imply.
- What's the recent tenant-quality profile in this submarket — average credit score on applications, eviction rate, late-payment / NSF rate, and stable-employment percentage? A property-management company in the area should have these aggregated.
- How much new for-sale + rental construction is in the pipeline within 1–3 miles? Heavy new supply typically softens prices + rents 12–24 months out; constrained supply supports both.
Investment metrics
- 1% rule
- 2.22% ✓
- Cap rate
- 19.04%
- Cash-on-cash
- 45.53%
- DSCR
- 3.03
- GRM
- 3.8
CMA / ARV
- ARV (on-the-fly)
- $124,063
- Comps found
- 9
Show comp detail 9 sales within ~0.75 mi
| Address | Dist | Beds/Ba | Sqft | Sold | Price | $/sf | Match |
|---|---|---|---|---|---|---|---|
| 6307 State Ln #90 | 0.09mi | 2/2.0 | 1,248 (-2%) | 12mo | $170,000 | $136 | 82 |
| 6205 Presidential Ln #135 | 0.08mi | 2/2.0 | 1,254 (-2%) | 16mo | $75,000 | $60 | 80 |
| 6311 Election Ln | 0.05mi | 2/2.0 | 1,344 (+5%) | 12mo | $135,000 | $100 | 79 |
| 6800 Capital Cir | 0.14mi | 2/2.0 | 1,152 (-10%) | 0mo | $120,000 | $104 | 77 |
| 6719 Representative Way #166 | 0.11mi | 2/2.0 | 1,440 (+13%) | 6mo | $140,000 | $97 | 69 |
| 6827 Capital Cir #203 | 0.14mi | 2/2.0 | 1,440 (+13%) | 4mo | $81,000 | $56 | 69 |
| 6713 Representative Way #169 | 0.10mi | 2/2.0 | 1,440 (+13%) | 8mo | $109,000 | $76 | 68 |
| 6201 Presidential Ln #137 | 0.10mi | 3/2.0 (+1) | 1,120 (-12%) | 12mo | $128,000 | $114 | 59 |
| 6815 Capital Cir #209 | 0.16mi | 2/2.0 | 1,440 (+13%) | 18mo | $118,900 | $83 | 56 |
Match score weights: distance 35% · size 25% · config 20% · recency 20%. Top-matched comps best support the ARV.
Projected returns pro-forma
-3.0% appreciation · 0.0% rent growth · sell at horizon
- IRR
- 39.2%
- Equity multiple
- 2.61×
- Total profit
- $44,540
- Equity at exit
- $14,761
- IRR
- 44.2%
- Equity multiple
- 4.62×
- Total profit
- $100,290
- Equity at exit
- $8,560
Cash invested: $27,720 (down + closing). Projections, not guarantees.
Landlord ↔ Tenant lean methodology
- Overall (STATE)
- 18 Strongly Tenant-Friendly
- State California
- 18 Strongly Tenant-Friendly · D+13
- County
- — inherits STATE
- City
- — inherits STATE
ZIP-level market 95828
- Home prices YoY
- -0.8%
- Rents YoY
- -0.2%
- Active inventory
- 212
- Price-to-rent
- 3.8×
Monthly cashflow live
- Estimated rent
- $2,197 high interval (Pro) →
- Mortgage (P&I)
- −$519
- Tax est. 1.5%
- −$124 /mo · $1,485/yr
- Insurance
- −$41
- HOA
- −$0
- Vacancy / Maint / Mgmt
- −$461
- Net cashflow
- $1,052
Break-even live
UW: 25.0% down · 7.5% · 30yr · 1.5% tax · 5.0% vac · 8.0% maint · 8.0% mgmt
Financing live
Cash to close
- Down payment
- $24,750
- Closing costs
- $2,970
- Reserves months
- —
- Total cash needed
- —
Loan-product check · same deal, 3 products live
Conventional
25% down · 7.5% · 30yr
- Down + closing
- —
- Monthly P&I
- —
- Monthly cashflow
- —
- DSCR
- —
- Eligible?
- —
Personal DTI + credit; lowest rate.
DSCR
20% down · 8.5% · 30yr
- Down + closing
- —
- Monthly P&I
- —
- Monthly cashflow
- —
- DSCR
- —
- Eligible?
- —
No personal income docs; deal must DSCR.
Hard money
10% down · 12.0% · 12mo
- Down + closing
- —
- Monthly P&I
- —
- Monthly cashflow
- —
- DSCR
- —
- Eligible?
- —
Short-term bridge; refi at stabilization.
Rent comps 24 comps
| Address | Beds | Baths | Sqft | Rent | $/sqft | DOM | Units | Dist |
|---|---|---|---|---|---|---|---|---|
| 6824 Mangosteen Ln Sacramento, CA | 3.0 | 2.5 | 1404 | $2,245 | $1.60 | 7d | 1 | 0.16mi |
| 6475 Stockton Blvd Sacramento, CA | 2.0 | 2.0 | 988 | $2,600 | $2.63 | 19d | 1 | 0.35mi |
| 6470 Stockton Blvd Sacramento, CA | 1.0–2.0 | 1.0–2.0 | 856 | $1,845 | $2.16 | 43d | 2 | 0.42mi |
| 6519 Prentiss Dr Sacramento, CA | 3.0 | 2.0 | 1029 | $2,300 | $2.24 | 12d | 1 | 0.64mi |
| 7252 Florin Mall Dr Unit 7252 Sacramento, CA | 2.0 | 2.0 | 900 | $1,725 | $1.92 | 43d | 1 | 0.87mi |
| 5934 69th St Sacramento, CA | 3.0 | 1.0 | 1091 | $1,995 | $1.83 | 3d | 1 | 0.92mi |
| 7283 Florin Mall Dr #14 Sacramento, CA | 2.0 | 2.0 | 902 | $1,675 | $1.86 | 43d | 1 | 0.93mi |
| 7140 Chris Ave Sacramento, CA | 2.0 | 1.0 | 1248 | $2,300 | $1.84 | 43d | 1 | 0.95mi |
| 4911 50th Ave Unit 11 Sacramento, CA | 2.0 | 2.0 | 875 | $1,660 | $1.90 | 23d | 1 | 0.98mi |
| 5500 38th Ave Sacramento, CA | 3.0 | 1.0 | 1100 | $2,100 | $1.91 | 43d | 1 | 1.08mi |
| 6053 36th Ave Sacramento, CA | 3.0 | 1.0 | 1166 | $2,600 | $2.23 | 43d | 1 | 1.12mi |
| 4913 Sky Pkwy Sacramento, CA | 3.0 | 2.0 | 1456 | $2,200 | $1.51 | 43d | 1 | 1.13mi |
| 5834 55th St Sacramento, CA | 3.0 | 1.0 | 1027 | $2,100 | $2.04 | 16d | 1 | 1.14mi |
| 5885 Wilkinson St Sacramento, CA | 3.0 | 2.0 | 1368 | $2,399 | $1.75 | 43d | 1 | 1.26mi |
| 5936 Clover Manor Way Sacramento, CA | 3.0 | 2.0 | 1345 | $2,400 | $1.78 | 43d | 1 | 1.28mi |
| 5905 Clover Manor Way Unit 5907 CLOVER Sacramento, CA | 3.0 | 1.0 | 1000 | $2,000 | $2.00 | 2d | 1 | 1.31mi |
| 5544 33rd Ave Unit NA Sacramento, CA | 2.0 | 1.0 | 1200 | $2,250 | $1.88 | 7d | 1 | 1.35mi |
| 5988 Sampson Blvd Sacramento, CA | 2.0 | 1.0 | 1025 | $2,125 | $2.07 | 23d | 1 | 1.38mi |
| 4812 D Pkwy Sacramento, CA | 3.0 | 1.5 | 1505 | $2,295 | $1.52 | 23d | 1 | 1.39mi |
| 7238 East Pkwy Apt B5 Sacramento, CA | 2.0 | 1.5 | 1020 | $1,645 | $1.61 | 7d | 1 | 1.40mi |
| 7236 East Pkwy Sacramento, CA | 2.0 | 1.0–1.5 | 776 | $1,645 | $2.12 | 2d | 1 | 1.40mi |
| 5316 Nelson St Sacramento, CA | 3.0 | 2.0 | 1018 | $2,245 | $2.21 | 12d | 1 | 1.42mi |
| 5701 Fruitridge Rd Sacramento, CA | 2.0 | 1.0 | 875 | $1,495 | $1.71 | 43d | 1 | 1.44mi |
| 7351 Gigi Pl Unit 7353 Sacramento, CA | 2.0 | 1.0 | 1000 | $1,775 | $1.77 | 23d | 1 | 1.48mi |
Climate risk First Street
- Flood 1/10 Low FEMA zone X (shaded) · 0% chance over 30 yrs
- Wildfire 1/10 Low
- Heat 7/10 Severe 7 d/yr ≥102°F today · 15 d/yr by 30 yrs out
- Wind 1/10 Low
- Air quality 10/10 Extreme 28 unhealthy d/yr today · 33 by 30 yrs out
Nearby sold comps map
Loading sold comps map…
Walkable amenities ~0.75 mi
Loading nearby amenities…
Taxation est. · year 1
- Rental income
- $26,369
- − Mortgage interest
- −$5,546
- − Property taxes
- −$1,485
- − Insurance
- −$495
- − Repairs & maintenance
- −$2,110
- − Management
- −$2,110
- − Depreciation
- −$2,880
- Taxable income
- $11,744
- Est. tax owed @ 24.0%
- −$2,819
- After-tax cash flow
- $9,803/yr
For passive investors: Depreciation is non-cash, so a rental often shows a tax loss while cash-flowing — sheltering income. Rental losses are passive: they offset passive income freely, and up to $25,000/yr can offset ordinary (W-2) income if you actively participate and your MAGI is under $100k (phasing out to $0 by $150k); unused losses carry forward. On sale, claimed depreciation is recaptured at up to 25%, and gains may owe capital-gains tax (a 1031 exchange can defer both). Figures are a year-1 estimate at your 24.0% rate — not tax advice; consult a CPA.
Schools (NCES district)
- District
- Sacramento City Unified
- NCES district ID
- 0633840
- Math proficiency
- 32% ▬ 0.00%
- Reading proficiency
- 43% ▲ 3.00%
- Median HH income
- $49,280
- Composite
- 34.86/100
- National rank
- #10000
- State rank
- #804 of 1400 in CA
Livability — Sacramento
- Score
- 71/100
- State rank
- #218
- US rank
- #6957
Category grades
Schools grade is shown separately in the Schools card above.
Census & demographics
- Census place
- Sacramento, CA
- County
- Sacramento County · 1,539,646 people
- City population
- 761,410
- Metro
- Sacramento-Roseville-Folsom, CA
- Population (ZIP)
- 61,686
- Household income
- $81,778
- Rent vs Own
- Severe rent burden
- 1765.0
Population outlook (Sacramento County) Hauer SSP2
- Today (2025)
- 1,660,763 people
- By 2030
- 1,732,990 · +4.3%
- By 2040
- 1,855,755 · +11.7%
- By 2050
- 1,941,335 · +16.9%
- By 2075
- 2,046,162 · +23.2%
- By 2100
- 1,961,444 · +18.1%
Race, ethnicity, and origin ACS 2023
- Neighborhood character
- Highly diverse neighborhood (Simpson 0.75)
- Race & ethnicity
- Asian 37% Hispanic / Latino 26% White 16% Two or more races 12% Black 10% Pacific Islander 4%
- Hispanic origin (detail)
- Mexican 22%
- Common ancestry
- Italian 1% Russian 1% Portuguese 1%
- Foreign-born
- 35% · Vietnam, Canada, China
- Languages at home
- 47% English-only · Spanish 17% Other Asian/Pacific 13% Vietnamese 8%
Political lean MEDSL · Sacramento
- 2024 margin
- D (+19.7) · D 58.1% · R 38.4% · Other 3.5%
- 2008→2024 swing
- +0.7pp no change · 2008: 19.0pp · 2024: 19.7pp
- All cycles
- 2024: D+19.7 2020: D+25.3 2016: D+23.7 2012: D+16.3 2008: D+19.0
Not yet ingested
- Civics
- —
Market trends
- HPI YoY
- ▼ -7.49%
- Current HPI
- 962.47
- Rent YoY
- ▼ -0.24%
- Metro
- Sacramento-Roseville-Folsom, CA
- State GDP YoY
- ▲ 3.21%
- F500 in state
- 116
Industry mix (Fortune 500 HQ in CA)
| Industry | F500 HQs | Revenue |
|---|---|---|
| Technology | 27 | $1,492B |
|
||
| Financial Services | 3 | $174B |
|
||
| Retail | 3 | $44B |
|
||
| Insurance | 3 | $26B |
|
||
| Media / Entertainment | 2 | $115B |
|
||
| Pharmaceuticals / Biotech | 2 | $62B |
|
||
Property tax history
+1.6%/yrLatest (2025): $163 · -2.7% YoY. Source: county tax records.
Cash-flow waterfall
monthlySold comps — $/sqft
last 12 mo · ≤1 miLoading sold comps…