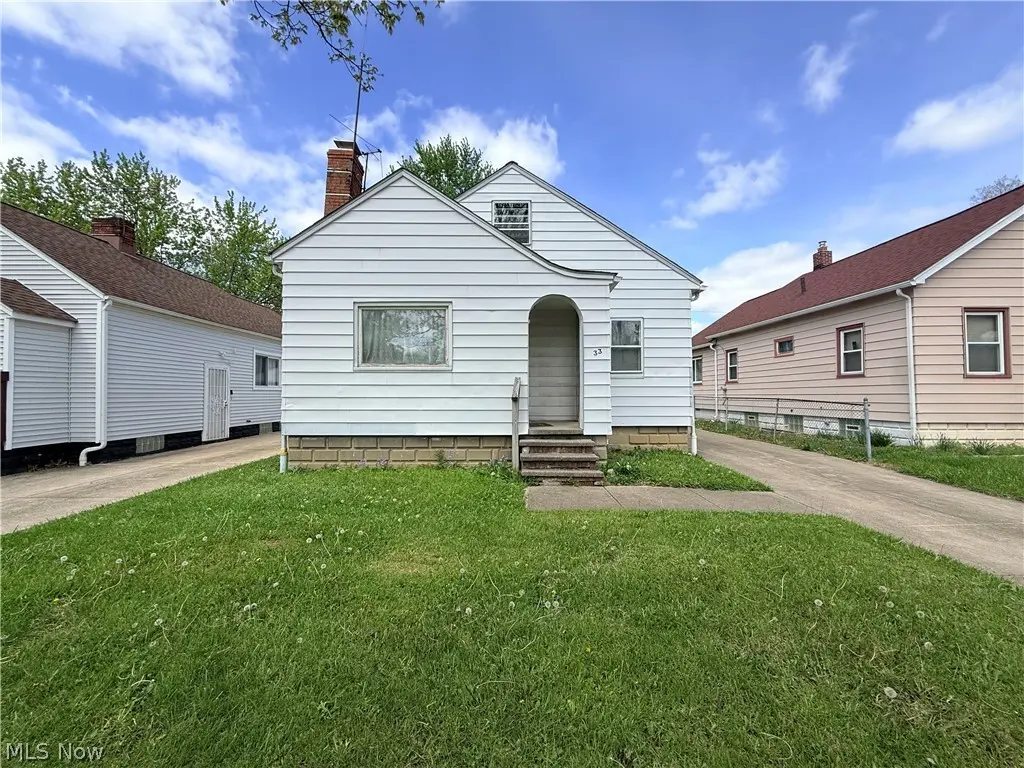
33 Henry St · Bedford, OH
Flood risk 1/10 · Minimal
- FEMA flood zone
- X (unshaded)
- Chance of flooding over 30 yrs
- 0.0%
- Est. flood insurance / yr
- $473 – $860
Fire risk 1/10 · Minimal
- Est. fire insurance / yr
- $713 – $1,323
Heat risk 3/10 · Minor
- Hot days now (above 94°F)
- 7 days/yr
- Hot days in 30 yrs
- 17 days/yr
Wind risk 1/10 · Minimal
- Chance of severe wind over 30 yrs
- —
Air-quality risk 3/10 · Minor
- Unhealthy air days now
- 2 days/yr
- Unhealthy air days in 30 yrs
- 4 days/yr
Risk factors via First Street. Map © Google.
Why this score? — see what drove the B grade
The composite is a weighted blend of 9 inputs, each scored 0–100. Each bar is that input's sub-score; the figure is the points it added to the 100-point composite (weight × sub-score).
- Cash flow +26.4/30.0
- ARV discount +15.0/15.0
- DSCR +9.0/10.0
- 1% rule +8.4/10.0
- Rent growth +4.0/5.0
- Livability +3.7/5.0
- Condition / age +2.5/5.0
- Schools +2.2/10.0
- Appreciation +0.0/10.0
$99,999
🖨 Deal sheet 📄 Offer letter ✓ Due diligence
Listing remarks
33 Henry St presents a strong opportunity for investors, flippers, or contractors looking for their next project. This property requires significant renovation and is being sold as-is, making it ideal for those ready to bring their vision to life. With solid fundamentals and plenty of room for improvement, this is a great candidate for a full rehab. Whether you're looking to renovate and resell or add to your rental portfolio, the potential here is clear. Conveniently located near local amenities, major highways, and everything Bedford has to offer.
Key facts
- Local amenities
- Major highways
- 5,279 sq ft lot
Tags
Property features AI
Exterior
- Parking: 2-car garage; Driveway parking; Concrete surfaces
- Utilities: Public water; Public sewer
- Home design: Single-family property (fixer condition); Shingle roof; Entry level and number of stories not specified; Facing direction not specified
- Construction: Aluminum siding; Block foundation; Built year per public records
- Exterior features: Covered patio/porch; Front yard and backyard; Chain-link fence in backyard
Interior
- Bedrooms: Total rooms: 6 (bedroom count not specified)
- Bathrooms: 1 full bathroom (main level)
- Heating & cooling: Central air conditioning; Forced air heating
- Interior features: Wood-framed windows; Unfinished basement with sump pump; Living room fireplace (1)
- Laundry & utility: Laundry located in basement
Neighborhood map
What this means for you Summary
Snapshot
- This is a 3-bed/1.0-bath single-family listed at $100k.
Deal economics
- At list price, monthly cash flow is $261 ($3k/yr) — positive.
- The deal already cash-flows at list — no discount required.
- Meets the 1% rule at list price ($1k rent vs $100k).
- Cap rate 9.4% vs local median 5.4% in Bedford — top-decile yield for the area; either an underpriced asset or a hidden risk that comps aren't pricing in. Stress-test before assuming the spread holds.
Location & tenants
- Location reads 73/100 on livability (#324 in OH) — a middle-class / working-renter tenant base. Strengths: crime A+, cost of living A+, housing A+; Watch: amenities F, commute F, employment D-.
- Bedford City (suburban): math 19% / reading 32% proficiency, ranked #597 of 656 in OH (top 91%) — low school quality limits family demand, transient renter base, plan for 1-2y turnover.
- Market conditions: Rents rising fast (+5.8%/yr); 105 active listings in the ZIP; 8 comparable units currently listed for rent nearby; rentals leasing fast (median 8d on market — plan ~1-2 weeks tenant-placement turnaround); 1,441 units permitted in Cuyahoga County in 2024 (700 in 5+ unit buildings).
Forward outlook
- Local home prices are declining (-3.0%/yr); year-one equity from $691 of loan paydown is wiped out by about $3k of value loss. Plan a longer hold.
- Cuyahoga County population projected to shrink 8% by 2050 — rents likely to lag national; underwrite the cash flow, not the appreciation.
- At projected returns (-3.0% appreciation + 5.8% rent growth), your $28k cash investment doubles in ~8 years — after that, you're playing with house money.
Negotiation context
- Only 8 days on market — expect competitive offers; lowballing is unlikely to land.
- 2 sale attempts with the ask held roughly flat each time — persistent listings suggest the price (not the market) is what's stuck; bring a comps-based counter.
- Current owner paid $12k; list at $100k implies a 733% gain — meaningful room to come down on a strong offer.
Risks & watch-outs
- Watch-outs: property tax is 2.8% of price; built in 1927 — expect roof / HVAC / electrical / plumbing capex.
Questions for the listing agent
- Built in 1927 — when were the roof, HVAC, electrical panel, plumbing, and water heater last replaced?
- Property tax is high relative to price — has the assessment been appealed recently, and will the sale trigger a re-assessment?
- Is there a deadline driving the sale (1031 exchange, divorce, estate, relocation)? That informs how much negotiation room exists.
- What's the average days-on-market for RENTAL listings here right now (not sales)? A rising rental-DOM trend means longer vacancies and softer asking-rent achievability than the comps imply.
- What's the recent tenant-quality profile in this submarket — average credit score on applications, eviction rate, late-payment / NSF rate, and stable-employment percentage? A property-management company in the area should have these aggregated.
- How much new for-sale + rental construction is in the pipeline within 1–3 miles? Heavy new supply typically softens prices + rents 12–24 months out; constrained supply supports both.
Investment metrics
- 1% rule
- 1.34% ✓
- Cap rate
- 9.43%
- Cash-on-cash
- 11.19%
- DSCR
- 1.50
- GRM
- 6.2
CMA / ARV
- ARV (median comp)
- $160,613
- List price
- $99,999
- Delta
- -37.74%
- Verdict
- UNDERPRICED
- Comps
- 20 within 1.0 mi
Show comp detail 12 sales within ~0.75 mi
| Address | Dist | Beds/Ba | Sqft | Sold | Price | $/sf | Match |
|---|---|---|---|---|---|---|---|
| 48 William St | 0.04mi | 3/1.0 | 924 (-8%) | 2mo | $160,700 | $174 | 83 |
| 92 John St | 0.12mi | 3/1.5 | 972 (-3%) | 8mo | $168,000 | $173 | 80 |
| 21171 Forbes Rd | 0.21mi | 3/1.0 | 1,004 (-0%) | 15mo | $150,000 | $149 | 77 |
| 132 Best St | 0.23mi | 3/1.0 | 969 (-4%) | 11mo | $88,000 | $91 | 74 |
| 330 Paul St | 0.20mi | 3/2.0 | 925 (-8%) | 2mo | $165,000 | $178 | 72 |
| 378 Union St | 0.28mi | 3/2.0 | 1,050 (+4%) | 5mo | $225,000 | $214 | 71 |
| 161 Forbes Rd | 0.30mi | 2/1.0 (-1) | 1,080 (+7%) | 1mo | $109,900 | $102 | 68 |
| 171 Best St | 0.28mi | 3/2.0 | 1,056 (+5%) | 9mo | $155,590 | $147 | 67 |
| 22 Best St | 0.15mi | 3/2.5 | 1,080 (+7%) | 10mo | $106,000 | $98 | 67 |
| 57 Forbes Rd | 0.19mi | 3/1.5 | 1,088 (+8%) | 16mo | $143,000 | $131 | 62 |
| 1334 Broadway Ave | 0.31mi | 3/1.5 | 1,122 (+12%) | 10mo | $154,000 | $137 | 56 |
| 41 W Interstate St | 0.30mi | 2/1.5 (-1) | 867 (-14%) | 11mo | $76,600 | $88 | 47 |
Match score weights: distance 35% · size 25% · config 20% · recency 20%. Top-matched comps best support the ARV.
Projected returns pro-forma
-3.0% appreciation · 5.83% rent growth · sell at horizon
- IRR
- 4.0%
- Equity multiple
- 1.16×
- Total profit
- $4,435
- Equity at exit
- $14,910
- IRR
- 16.2%
- Equity multiple
- 2.52×
- Total profit
- $42,693
- Equity at exit
- $8,646
Cash invested: $28,000 (down + closing). Projections, not guarantees.
Landlord ↔ Tenant lean methodology
- Overall (STATE)
- 73 Landlord-Friendly
- State Ohio
- 73 Landlord-Friendly · R+6
- County
- — inherits STATE
- City
- — inherits STATE
ZIP-level market 44146
- Rents YoY
- 5.8%
- Active inventory
- 105
- Price-to-rent
- 6.2×
Monthly cashflow live
- Estimated rent
- $1,341 high interval (Pro) →
- Mortgage (P&I)
- −$524
- Tax from tax record
- −$232 /mo · $2,783/yr
- Insurance
- −$42
- HOA
- −$0
- Vacancy / Maint / Mgmt
- −$282
- Net cashflow
- $261
Break-even live
UW: 25.0% down · 7.5% · 30yr · 1.5% tax · 5.0% vac · 8.0% maint · 8.0% mgmt
Financing live
Cash to close
- Down payment
- $25,000
- Closing costs
- $3,000
- Reserves months
- —
- Total cash needed
- —
Loan-product check · same deal, 3 products live
Conventional
25% down · 7.5% · 30yr
- Down + closing
- —
- Monthly P&I
- —
- Monthly cashflow
- —
- DSCR
- —
- Eligible?
- —
Personal DTI + credit; lowest rate.
DSCR
20% down · 8.5% · 30yr
- Down + closing
- —
- Monthly P&I
- —
- Monthly cashflow
- —
- DSCR
- —
- Eligible?
- —
No personal income docs; deal must DSCR.
Hard money
10% down · 12.0% · 12mo
- Down + closing
- —
- Monthly P&I
- —
- Monthly cashflow
- —
- DSCR
- —
- Eligible?
- —
Short-term bridge; refi at stabilization.
Rent comps 8 comps
| Address | Beds | Baths | Sqft | Rent | $/sqft | DOM | Units | Dist |
|---|---|---|---|---|---|---|---|---|
| 153 Henry St Bedford, OH | 2.0 | 1.5 | 1176 | $1,350 | $1.15 | 10d | 1 | 0.19mi |
| 215 Dalepark Dr #4 Bedford, OH | 2.0 | 1.0 | 896 | $1,400 | $1.56 | 17d | 1 | 0.44mi |
| 199 Dalepark Dr Bedford, OH | 2.0 | 1.0 | 896 | $1,300 | $1.45 | 43d | 1 | 0.47mi |
| 204 Solon Rd Bedford, OH | 2.0 | 1.0 | 900 | $1,200 | $1.33 | 2d | 1 | 0.82mi |
| 204 Solon Rd Apt 2 Bedford, OH | 2.0 | 1.0 | 900 | $1,200 | $1.33 | 4d | 1 | 0.82mi |
| 200 Solon Rd Unit 3 Bedford, OH | 2.0 | 1.0 | 850 | $1,100 | $1.29 | 4d | 1 | 0.82mi |
| 681 Washington St Unit 1496061P Bedford, OH | 3.0 | 1.0 | 1151 | $3,518 | $3.06 | 7d | 1 | 1.26mi |
| 6699 Deer Ct Bedford, OH | 3.0 | 1.5 | 1372 | $1,800 | $1.31 | 1d | 1 | 1.44mi |
Listing history 7 events
-
2026-06-18days on market $99,999 Active 8 DOM
-
2026-06-17days on market $99,999 Active 7 DOM
-
2026-06-16days on market $99,999 Active 6 DOM
-
2026-06-15status $99,999 Active 5 DOM
-
2026-05-03status Pending 555-char remark
-
2026-04-27$99,999 Active 555-char remark
-
1974-03-01soldstatus $12,000
ⓘ Source: listings_history table (triggers on properties + properties_extension) + one-shot
backfill from property_details.listing_events for pre-trigger history.
Tax reassessment forecast OH · Partial reset (capped growth)
- Current annual tax
- $2,783 · $232/mo
- Projected year-2 tax
- $2,783 · $232/mo
- Expected delta
- $0/yr ($0/mo · 0.0%)
ⓘ Screening estimate from a state-policy table — verify with the county assessor before closing.
Climate risk First Street
- Flood 1/10 Low FEMA zone X (unshaded) · 0% chance over 30 yrs
- Wildfire 1/10 Low
- Heat 3/10 Moderate 7 d/yr ≥94°F today · 17 d/yr by 30 yrs out
- Wind 1/10 Low
- Air quality 3/10 Moderate 2 unhealthy d/yr today · 4 by 30 yrs out
Nearby sold comps map
Loading sold comps map…
Walkable amenities ~0.75 mi
Loading nearby amenities…
Taxation est. · year 1
- Rental income
- $16,087
- − Mortgage interest
- −$5,601
- − Property taxes
- −$2,783
- − Insurance
- −$500
- − Repairs & maintenance
- −$1,287
- − Management
- −$1,287
- − Depreciation
- −$2,909
- Taxable income
- $1,720
- Est. tax owed @ 24.0%
- −$413
- After-tax cash flow
- $2,720/yr
For passive investors: Depreciation is non-cash, so a rental often shows a tax loss while cash-flowing — sheltering income. Rental losses are passive: they offset passive income freely, and up to $25,000/yr can offset ordinary (W-2) income if you actively participate and your MAGI is under $100k (phasing out to $0 by $150k); unused losses carry forward. On sale, claimed depreciation is recaptured at up to 25%, and gains may owe capital-gains tax (a 1031 exchange can defer both). Figures are a year-1 estimate at your 24.0% rate — not tax advice; consult a CPA.
Schools (NCES district)
- District
- Bedford City
- NCES district ID
- 3910017
- Math proficiency
- 19% ▼ -23.00%
- Reading proficiency
- 32% ▼ -16.00%
- Median HH income
- $42,353
- Composite
- 21.69/100
- National rank
- #8273
- State rank
- #597 of 656 in OH
Livability — Bedford
- Score
- 73/100
- State rank
- #324
- US rank
- #5334
Category grades
Schools grade is shown separately in the Schools card above.
Census & demographics
- Census place
- Bedford, OH
- County
- Cuyahoga County · 1,090,369 people
- City population
- 29,349
- Metro
- Cleveland-Elyria, OH
- Population (ZIP)
- 29,349
- Household income
- $54,925
- Rent vs Own
- Severe rent burden
- 1314.0
Population outlook (Cuyahoga County) Hauer SSP2
- Today (2025)
- 1,244,621 people
- By 2030
- 1,230,093 · -1.2%
- By 2040
- 1,189,108 · -4.5%
- By 2050
- 1,145,706 · -7.9%
- By 2075
- 1,076,557 · -13.5%
- By 2100
- 978,987 · -21.3%
Race, ethnicity, and origin ACS 2023
- Neighborhood character
- Majority Black (59%)
- Race & ethnicity
- Black 59% White 33% Two or more races 6% Hispanic / Latino 3%
- Common ancestry
- Romanian 5% Serbian 1% Armenian 1%
- Foreign-born
- 2% · Canada
- Languages at home
- 96% English-only · Spanish 2% Arabic 1%
Political lean MEDSL · Cuyahoga
- 2024 margin
- Solid D (+31.5) · D 65.4% · R 33.9%
- 2008→2024 swing
- -7.4pp toward R · 2008: 38.9pp · 2024: 31.5pp
- All cycles
- 2024: D+31.5 2020: D+34.1 2016: D+35.0 2012: D+38.7 2008: D+38.9
Not yet ingested
- Civics
- —
Market trends
- HPI YoY
- ▼ -114.08%
- Current HPI
- 172.9421
- Rent YoY
- ▲ 5.83%
- Metro
- Cleveland-Elyria, OH
- State GDP YoY
- ▲ 1.98%
- F500 in state
- 48
Industry mix (Fortune 500 HQ in OH)
| Industry | F500 HQs | Revenue |
|---|---|---|
| Insurance | 3 | $145B |
|
||
| Industrial Machinery | 3 | $49B |
|
||
| Financial Services | 3 | $24B |
|
||
| Consumer Goods | 2 | $93B |
|
||
| Aerospace / Defense | 2 | $47B |
|
||
| Utilities | 2 | $33B |
|
||
Price history
+733.3% since first listed4 events — show timeline
- 2026-06-15 Relisted — MLSNOW
- 2026-05-03 Pending — MLSNOW
- 2026-04-27 Listed $99,999 MLSNOW
- 1974-03-01 Sold (Public Records) $12,000 Public Records
Property tax history
+7.7%/yrLatest (2025): $2,783 · +35.3% YoY. Source: county tax records.
Cash-flow waterfall
monthlySold comps — $/sqft
last 12 mo · ≤1 miLoading sold comps…