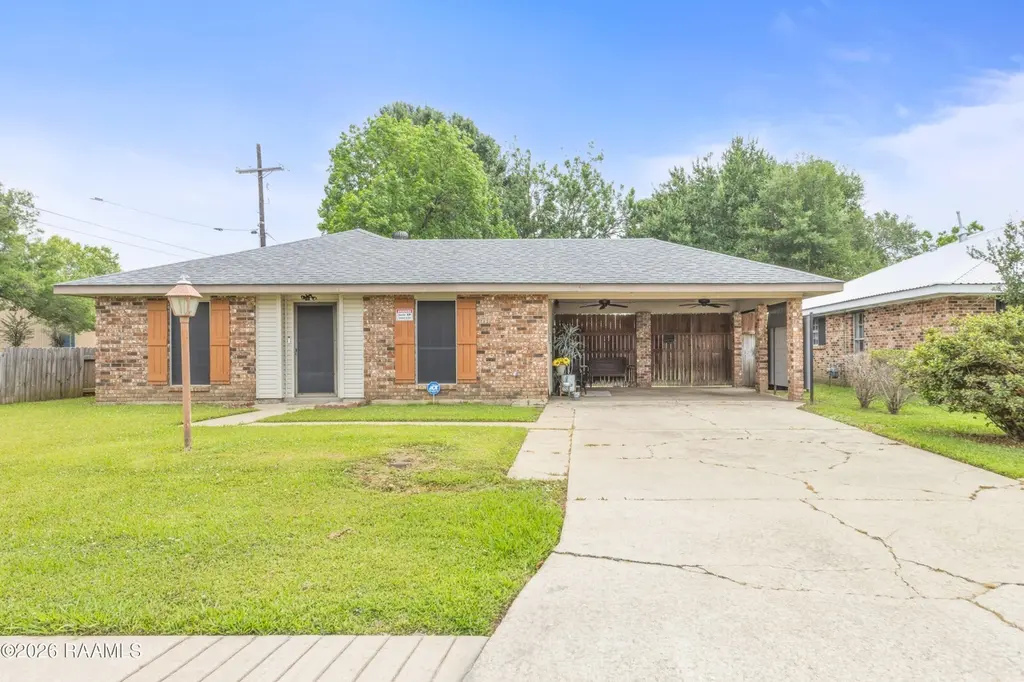
103 Winsor Dr · Lafayette, LA
Flood risk 3/10 · Minor
- FEMA flood zone
- X (unshaded)
- Chance of flooding over 30 yrs
- 0.2%
- Est. flood insurance / yr
- $507 – $1,088
Fire risk 3/10 · Minor
- Est. fire insurance / yr
- $1,269 – $2,357
Heat risk 8/10 · Major
- Hot days now (above 109°F)
- 7 days/yr
- Hot days in 30 yrs
- 21 days/yr
Wind risk 9/10 · Severe
- Chance of severe wind over 30 yrs
- 99.0%
Air-quality risk 2/10 · Minimal
- Unhealthy air days now
- 1 days/yr
- Unhealthy air days in 30 yrs
- 1 days/yr
Risk factors via First Street. Map © Google.
Why this score? — see what drove the C grade
The composite is a weighted blend of 9 inputs, each scored 0–100. Each bar is that input's sub-score; the figure is the points it added to the 100-point composite (weight × sub-score).
- Cash flow +23.4/30.0
- ARV discount +10.4/15.0
- DSCR +7.5/10.0
- 1% rule +5.3/10.0
- Schools +3.6/10.0
- Livability +3.5/5.0
- Rent growth +2.5/5.0
- Condition / age +2.5/5.0
- Appreciation +0.0/10.0
$140,000
🖨 Deal sheet (PDF) 📄 Offer letter ✓ Due diligence
Listing remarks
Move in ready home in Lafayette with easy I 49 access. This 3 bedroom 2 bathroom home is a great option if you are looking for an affordable home with functional space, covered parking, and extra storage. Located in the established Winrock Valley Subdivision, this home offers approximately 1,365 square feet of living space with a practical layout designed for everyday comfort. The living area flows into the kitchen and dining space, creating a setup that is ideal for both daily living and casual entertaining. Designed for buyers who want a solid home with potential, this property gives you the flexibility to make it your own over time. The backyard is easy to maintain and includes a metal s
Key facts
- Covered parking
- Extra storage
- Practical layout
Tags
Property features AI
Exterior
- Parking: 2 covered parking spaces; 2-car carport
- Utilities: Natural gas service (Atmos); Public sewer; City electric
- Home design: Single family residence; Located on a paved city street
- Construction: Brick veneer exterior; Composition roof
- Exterior features: Open patio/porch; Chain link fencing; Shed/storage
Interior
- Kitchen: Electric stove
- Flooring: Laminate
- Bathrooms: 2 full bathrooms
- Heating & cooling: Central heating (natural gas); Central air conditioning
- Interior features: Formica counters; Lighting
- Laundry & utility: Washer hookup; Electric dryer hookup
Neighborhood map
What this means for you Summary
Snapshot
- This is a 3-bed/2.0-bath single-family listed at $140k.
Deal economics
- At list price, monthly cash flow is $258 ($3k/yr) — positive.
- The deal already cash-flows at list — no discount required.
- Meets the 1% rule at list price ($1k rent vs $140k).
- Cap rate 8.5% vs local median 4.7% in Lafayette — top-decile yield for the area; either an underpriced asset or a hidden risk that comps aren't pricing in. Stress-test before assuming the spread holds.
Location & tenants
- Location reads 70/100 on livability (#63 in LA) — a middle-class / working-renter tenant base. Strengths: cost of living A+, housing A+, health & safety A+; Watch: amenities C-, employment C-, crime F.
- Lafayette Parish (urban): math 38% / reading 46% proficiency, ranked #19 of 98 in LA (top 19%) — families likely to look elsewhere, expect single-tenant / working-renter base with shorter leases.
- Zoned schools: Evangeline Elementary School (math 20% / reading 33%, grade F, #372 of 646 statewide, top 58%, 613 students, 84% FRL); Acadian Middle School (math 13% / reading 27%, grade F, #166 of 218 statewide, top 76%, 372 students, 74% FRL); Northside High School (math 17% / reading 22%, grade F, #186 of 265 statewide, top 73%, 655 students, 83% FRL) — zoned schools average 80% FRL vs 56% district-wide (24 pts higher); higher-poverty schools than district average — tighter screening recommended.
- Zoned-school proficiency averages 22% at this address vs 42% district-wide (-20 pts) — the specific schools serving this property underperform the Lafayette Parish average; the district grade overstates school quality for this exact location.
- Market conditions: 330 active listings in the ZIP; 19 comparable units currently listed for rent nearby; rentals at typical pace (median 23d on market — plan ~3-4 weeks tenant-placement turnaround); 47% of comp listings sitting > 30 days — soft ceiling on asking rent; 1,585 units permitted in Lafayette Parish in 2024 (10 in 5+ unit buildings).
Forward outlook
- Local home prices are declining (-3.0%/yr); year-one equity from $968 of loan paydown is wiped out by about $4k of value loss. Plan a longer hold.
- Lafayette County population projected at +34% by 2050 — long-run rental-demand tailwind backs the buy-and-hold thesis.
Negotiation context
- Only 2 days on market — expect competitive offers; lowballing is unlikely to land.
Risks & watch-outs
- Climate carrying-cost: severe wind risk, 99% chance of damaging wind over 30y; extreme-heat days projected 7→21/yr by 2055 (HVAC capex compounding) — expect insurance premiums to compound above CPI over the hold.
Questions for the listing agent
- Built in 1964 — when were the roof, HVAC, electrical panel, plumbing, and water heater last replaced?
- Is there a deadline driving the sale (1031 exchange, divorce, estate, relocation)? That informs how much negotiation room exists.
- Schools are B-rated — typically a magnet for longer-tenancy family renters. What's the average tenant stay here, and is there a school-zone premium baked into asking?
- Crime grade is F in this area — have there been break-ins, vandalism, or insurance claims at this property in the last 3 years? What carrier currently insures it and at what premium?
- What's the average days-on-market for RENTAL listings here right now (not sales)? A rising rental-DOM trend means longer vacancies and softer asking-rent achievability than the comps imply.
- What's the recent tenant-quality profile in this submarket — average credit score on applications, eviction rate, late-payment / NSF rate, and stable-employment percentage? A property-management company in the area should have these aggregated.
- How much new for-sale + rental construction is in the pipeline within 1–3 miles? Heavy new supply typically softens prices + rents 12–24 months out; constrained supply supports both.
Investment metrics
- 1% rule
- 1.03% ✓
- Cap rate
- 8.51%
- Cash-on-cash
- 7.90%
- DSCR
- 1.35
- GRM
- 8.1
CMA / ARV
- ARV (on-the-fly)
- $149,820
- Comps found
- 8
Show comp detail 8 sales within ~0.75 mi
| Address | Dist | Beds/Ba | Sqft | Sold | Price | $/sf | Match |
|---|---|---|---|---|---|---|---|
| 103 Winsor Dr | 0.00mi | 3/2.0 | 1,365 (+0%) | 1mo | $140,000 | $103 | 99 |
| 207 Crestline Dr | 0.38mi | 3/2.0 | 1,326 (-3%) | 8mo | $160,000 | $121 | 72 |
| 201 Summit Dr | 0.19mi | 3/1.0 | 1,235 (-9%) | 13mo | $155,000 | $126 | 61 |
| 3818 Moss St | 0.51mi | 3/2.0 | 1,488 (+9%) | 2mo | $159,900 | $107 | 59 |
| 110 Judge Dr | 0.59mi | 3/2.0 | 1,261 (-7%) | 10mo | $73,000 | $58 | 52 |
| 124 Julian Cir | 0.30mi | 3/1.0 | 1,243 (-9%) | 23mo | $95,000 | $76 | 48 |
| 3905 Moss St | 0.61mi | 3/1.5 | 1,248 (-8%) | 15mo | $160,000 | $128 | 43 |
| 105 Tyler Dr | 0.71mi | 3/2.0 | 1,224 (-10%) | 23mo | $135,000 | $110 | 31 |
Match score weights: distance 35% · size 25% · config 20% · recency 20%. Top-matched comps best support the ARV.
Projected returns pro-forma
-3.0% appreciation · 3.0% rent growth · sell at horizon
- IRR
- -4.3%
- Equity multiple
- 0.84×
- Total profit
- $-6,273
- Equity at exit
- $20,874
- IRR
- 5.4%
- Equity multiple
- 1.40×
- Total profit
- $15,580
- Equity at exit
- $12,105
Cash invested: $39,200 (down + closing). Projections, not guarantees.
Landlord ↔ Tenant lean methodology
- Overall (STATE)
- 90 Strongly Landlord-Friendly
- State Louisiana
- 90 Strongly Landlord-Friendly · R+12
- County
- — inherits STATE
- City
- — inherits STATE
ZIP-level market 70507
- Home prices YoY
- -20.6%
- Active inventory
- 330
- Price-to-rent
- 8.1×
Monthly cashflow live
- Estimated rent
- $1,438 high interval (Pro) →
- Mortgage (P&I)
- −$734
- Tax from tax record
- −$85 /mo · $1,025/yr
- Insurance
- −$58
- HOA
- −$0
- Vacancy / Maint / Mgmt
- −$302
- Net cashflow
- $258
Break-even live
Sensitivity live
| Price | -10% $337 | -5% $298 | +0% $258 | +5% $219 | +10% $179 |
|---|---|---|---|---|---|
| Rent | -10% $145 | -5% $201 | +0% $258 | +5% $315 | +10% $372 |
| Rate | -1.0pp $329 | -0.5pp $294 | base $258 | +0.5pp $222 | +1.0pp $185 |
UW: 25.0% down · 7.5% · 30yr · 1.5% tax · 5.0% vac · 8.0% maint · 8.0% mgmt
Financing live
Cash to close
- Down payment
- $35,000
- Closing costs
- $4,200
- Reserves months
- —
- Total cash needed
- —
Loan-product check · same deal, 3 products live
Conventional
25% down · 7.5% · 30yr
- Down + closing
- —
- Monthly P&I
- —
- Monthly cashflow
- —
- DSCR
- —
- Eligible?
- —
Personal DTI + credit; lowest rate.
DSCR
20% down · 8.5% · 30yr
- Down + closing
- —
- Monthly P&I
- —
- Monthly cashflow
- —
- DSCR
- —
- Eligible?
- —
No personal income docs; deal must DSCR.
Hard money
10% down · 12.0% · 12mo
- Down + closing
- —
- Monthly P&I
- —
- Monthly cashflow
- —
- DSCR
- —
- Eligible?
- —
Short-term bridge; refi at stabilization.
Rent comps 19 comps
| Address | Beds | Baths | Sqft | Rent | $/sqft | DOM | Units | Dist |
|---|---|---|---|---|---|---|---|---|
| 106 Rue Royale Apt B Lafayette, LA | 2.0 | 1.5 | 912 | $775 | $0.85 | 15d | 1 | 0.06mi |
| 104 Foggy Ln Lafayette, LA | 3.0 | 2.0 | 1564 | $1,735 | $1.11 | 45d | 1 | 0.64mi |
| 202 Teddy Ln Lafayette, LA | 4.0 | 2.5 | 1788 | $1,945 | $1.09 | 22d | 1 | 0.65mi |
| 206 Teddy Ln Lafayette, LA | 4.0 | 2.5 | 1788 | $1,945 | $1.09 | 45d | 1 | 0.66mi |
| 105 Salvat Dr Lafayette, LA | 3.0 | 2.0 | 1593 | $1,740 | $1.09 | 45d | 1 | 0.70mi |
| 111 Salvat Dr Lafayette, LA | 4.0 | 2.5 | 1788 | $1,945 | $1.09 | 45d | 1 | 0.70mi |
| 315 Sidney Martin Rd Unit 1 Lafayette, LA | 3.0 | 1.5 | 1218 | $1,400 | $1.15 | 22d | 1 | 0.81mi |
| 13 Larkspur Ln Unit 13 Lafayette, LA | 3.0 | 1.5 | 1380 | $1,200 | $0.87 | 45d | 1 | 0.98mi |
| 201 High Meadows Blvd Unit 208 Lafayette, LA | 2.0 | 1.5 | 900 | $1,100 | $1.22 | 22d | 1 | 0.98mi |
| 2830 Louisiana Ave #6 Lafayette, LA | 2.0 | 1.5 | 1100 | $950 | $0.86 | 15d | 1 | 1.01mi |
| 2826 Louisiana Ave #907 Lafayette, LA | 2.0 | 2.5 | 1100 | $950 | $0.86 | 22d | 1 | 1.07mi |
| 2826 Louisiana Ave #1111 Lafayette, LA | 2.0 | 2.0 | 1140 | $1,200 | $1.05 | 46d | 1 | 1.07mi |
| 2820 Louisiana Ave Lafayette, LA | 1.0–2.0 | 1.0–2.0 | 821 | $1,145 | $1.39 | 15d | 20 | 1.14mi |
| 206 Chestnut Oak Dr Lafayette, LA | 4.0 | 2.0 | 1836 | $2,000 | $1.09 | 45d | 1 | 1.32mi |
| 301 Nottingham Cir Lafayette, LA | 3.0 | 2.5 | 1833 | $1,600 | $0.87 | 45d | 1 | 1.32mi |
| 100 Teal Ln #57 Lafayette, LA | 4.0 | 2.0 | 1400 | $1,320 | $0.94 | 45d | 1 | 1.39mi |
| 215 Peggy St Lafayette, LA | 3.0 | 2.0 | 1100 | $1,100 | $1.00 | 15d | 1 | 1.48mi |
| 215 Peggy St Lafayette, LA | 3.0 | 2.0 | 1100 | $1,100 | $1.00 | 22d | 1 | 1.48mi |
| 406 Starlight Dr Lafayette, LA | 4.0 | 2.0 | 1867 | $3,500 | $1.87 | 15d | 1 | 1.49mi |
Listing history 2 events
-
2026-05-07status Pending
-
2026-05-04$140,000 Active
ⓘ Source: listings_history table (triggers on properties + properties_extension) + one-shot
backfill from property_details.listing_events for pre-trigger history.
Tax reassessment forecast LA · Resets to sale price
- Current annual tax
- $1,025 · $85/mo
- Projected year-2 tax
- $1,025 · $85/mo
- Expected delta
- $0/yr ($0/mo · 0.0%)
ⓘ Screening estimate from a state-policy table — verify with the county assessor before closing.
Climate risk First Street
- Flood 3/10 Moderate FEMA zone X (unshaded) · 20% chance over 30 yrs
- Wildfire 3/10 Moderate
- Heat 8/10 Severe 7 d/yr ≥109°F today · 21 d/yr by 30 yrs out
- Wind 9/10 Extreme 99% chance of damaging wind over 30 yrs
- Air quality 2/10 Low 1 unhealthy d/yr today · 1 by 30 yrs out
Nearby sold comps map
Loading sold comps map…
Walkable amenities ~0.75 mi
Loading nearby amenities…
Taxation est. · year 1
- Rental income
- $17,258
- − Mortgage interest
- −$7,842
- − Property taxes
- −$1,025
- − Insurance
- −$700
- − Repairs & maintenance
- −$1,381
- − Management
- −$1,381
- − Depreciation
- −$4,073
- Taxable income
- $857
- Est. tax owed @ 24.0%
- −$206
- After-tax cash flow
- $2,893/yr
For passive investors: Depreciation is non-cash, so a rental often shows a tax loss while cash-flowing — sheltering income. Rental losses are passive: they offset passive income freely, and up to $25,000/yr can offset ordinary (W-2) income if you actively participate and your MAGI is under $100k (phasing out to $0 by $150k); unused losses carry forward. On sale, claimed depreciation is recaptured at up to 25%, and gains may owe capital-gains tax (a 1031 exchange can defer both). Figures are a year-1 estimate at your 24.0% rate — not tax advice; consult a CPA.
Schools (NCES district)
- District
- Lafayette Parish
- NCES district ID
- 2200870
- Math proficiency
- 38% ▼ -32.00%
- Reading proficiency
- 46% ▼ -24.00%
- Median HH income
- $50,238
- Composite
- 36.15/100
- National rank
- #4741
- State rank
- #19 of 98 in LA
Livability — Lafayette
- Score
- 70/100
- State rank
- #63
- US rank
- #8133
Category grades
Schools grade is shown separately in the Schools card above.
Census & demographics
- Census place
- Lafayette, LA
- County
- Lafayette Parish · 207,544 people
- City population
- 158,114
- Metro
- Lafayette, LA
- Population (ZIP)
- 20,096
- Household income
- $64,049
- Rent vs Own
- Severe rent burden
- 503.0
Population outlook (Lafayette County) Hauer SSP2
- Today (2025)
- 280,930 people
- By 2030
- 301,092 · +7.2%
- By 2040
- 339,456 · +20.8%
- By 2050
- 375,156 · +33.5%
- By 2075
- 451,672 · +60.8%
- By 2100
- 497,203 · +77.0%
Race, ethnicity, and origin ACS 2023
- Neighborhood character
- Diverse neighborhood (Simpson 0.57)
- Race & ethnicity
- Black 47% White 45% Two or more races 6% Hispanic / Latino 3%
- Common ancestry
- Lithuanian 15%
- Foreign-born
- 2% · Canada
- Languages at home
- 94% English-only · French/Haitian/Cajun 4% Spanish 2%
Political lean MEDSL · Lafayette
- 2024 margin
- Solid R (+31.4) · D 33.5% · R 64.8% · Other 1.7%
- 2008→2024 swing
- -0.1pp no change · 2008: -31.3pp · 2024: -31.4pp
- All cycles
- 2024: R+31.4 2020: R+28.7 2016: R+33.6 2012: R+33.7 2008: R+31.3
Not yet ingested
- Civics
- —
Market trends
- HPI YoY
- ▼ -40.84%
- Current HPI
- 156.889
- Rent YoY
- —
- Metro
- Lafayette, LA
- State GDP YoY
- ▲ 3.29%
- F500 in state
- 10
Industry mix (Fortune 500 HQ in LA)
| Industry | F500 HQs | Revenue |
|---|---|---|
| Telecommunications | 2 | $23B |
|
||
| Utilities | 1 | $12B |
|
||
| Wholesale / Distribution | 1 | $5B |
|
||
| Advertising | 1 | $2B |
|
||
Price history
2 events — show timeline
- 2026-05-07 Pending — AcadianaMLS
- 2026-05-04 Listed $140,000 AcadianaMLS
Property tax history
+16.8%/yrLatest (2025): $1,025 · -1.1% YoY. Source: county tax records.
Cash-flow waterfall
monthlySold comps — $/sqft
last 12 mo · ≤1 miLoading sold comps…