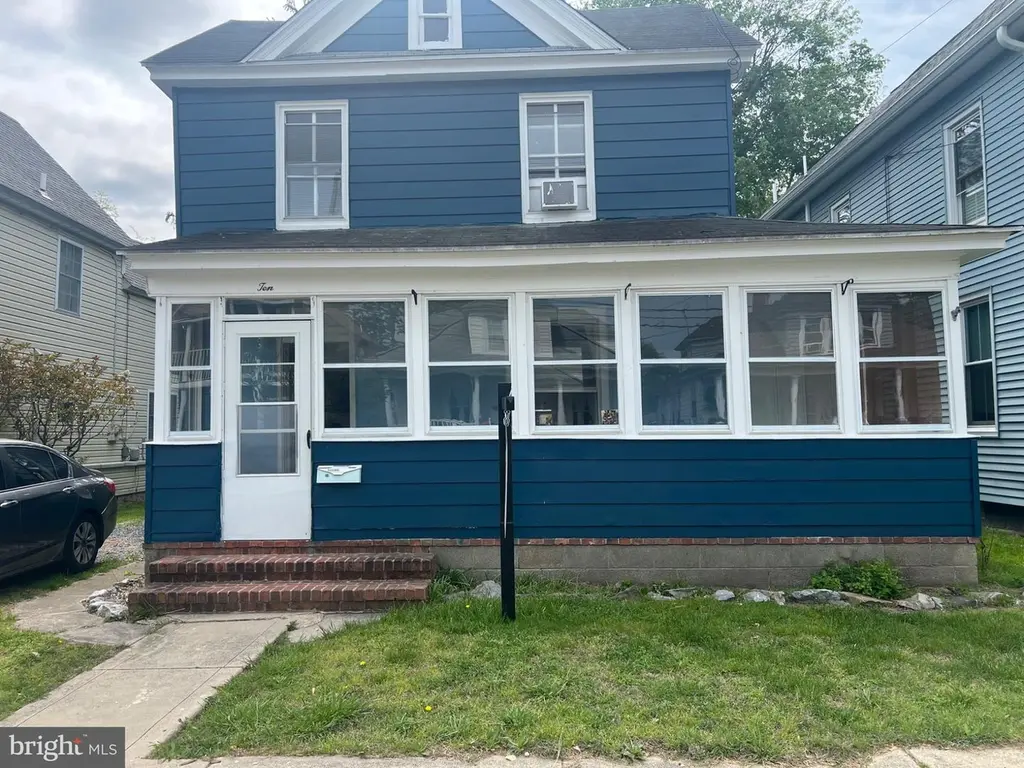
10 Willis St · Cambridge, MD
Flood risk 10/10 · Severe
- FEMA flood zone
- AE
- Chance of flooding over 30 yrs
- 0.99%
- Est. flood insurance / yr
- $1,737 – $8,500
Fire risk 3/10 · Minor
- Est. fire insurance / yr
- $755 – $1,403
Heat risk 9/10 · Severe
- Hot days now (above 105°F)
- 7 days/yr
- Hot days in 30 yrs
- 16 days/yr
Wind risk 7/10 · Major
- Chance of severe wind over 30 yrs
- 76.0%
Air-quality risk 3/10 · Minor
- Unhealthy air days now
- 2 days/yr
- Unhealthy air days in 30 yrs
- 3 days/yr
Risk factors via First Street. Map © Google.
Why this score? — see what drove the B grade
The composite is a weighted blend of 9 inputs, each scored 0–100. Each bar is that input's sub-score; the figure is the points it added to the 100-point composite (weight × sub-score).
- Cash flow +29.3/30.0
- ARV discount +15.0/15.0
- DSCR +10.0/10.0
- 1% rule +8.3/10.0
- Livability +3.2/5.0
- Rent growth +2.5/5.0
- Condition / age +2.5/5.0
- Schools +1.5/10.0
- Appreciation +0.0/10.0
$165,000
🖨 Deal sheet 📄 Offer letter ✓ Due diligence
Listing remarks MLS
Welcome to 10 Willis St, Step into timeless charm with this 1908 Colonial-style home ideally located in a highly desirable waterfront area. This property offers the perfect blend of historic character and investment potential. Featuring 3 of bedrooms and 1 bathroom, this home boasts classic architectural details, spacious living areas, and plenty of natural light throughout. Situated just moments from the water, the location alone makes this a standout opportunity. This property does require minor repairs and updates, making it ideal for investors, flippers, or buyers looking to build equity quickly. With strong upside potential, this home is a great candidate for renovation, rental income, or resale. Highlights: Prime waterfront location Historic 1908 Colonial with original charm Solid structure with value-add potential Spacious layout with generous room sizes Strong ARV (After Repair Value) potential Located in a desirable and established neighborhood Property is being sold AS-IS. Inspections are for informational purposes only. Don’t miss this chance to own a piece of history and unlock its full potential. Schedule your showing today!
Key facts
- 4,609 sq ft lot
- Built 1908
- Listed 78 days
Neighborhood map
What this means for you Summary
Snapshot
- This is a 3-bed/1.0-bath single-family listed at $165k.
Deal economics
- At list price, monthly cash flow is $156 ($2k/yr) — positive.
- The deal already cash-flows at list — no discount required.
- Meets the 1% rule at list price ($2k rent vs $165k).
- Recommended offer: $155k (6.0% below list) — sets the bar for market timing.
- Cap rate 10.5% vs local median 4.2% in Cambridge — top-decile yield for the area; either an underpriced asset or a hidden risk that comps aren't pricing in. Stress-test before assuming the spread holds.
Location & tenants
- Location reads 65/100 on livability (#255 in MD) — a middle-class / working-renter tenant base. Strengths: cost of living A+, health & safety A+, housing B+; Watch: amenities D, schools F, crime F.
- Dorchester County Public Schools (rural): math 10% / reading 23% proficiency, ranked #23 of 24 in MD (top 96%) — low school quality limits family demand, transient renter base, plan for 1-2y turnover.
- Market conditions: 292 active listings in the ZIP; 5 comparable units currently listed for rent nearby; rentals lingering (median 44d on market — plan ~5-8 weeks vacancy on turnover, expect pricing pressure); 100% of comp listings sitting > 30 days — soft ceiling on asking rent; 81 units permitted in Dorchester County in 2024 (0 in 5+ unit buildings).
Forward outlook
- Local home prices are declining (-3.0%/yr); year-one equity from $1k of loan paydown is wiped out by about $5k of value loss. Plan a longer hold.
- Dorchester County population projected to shrink 10% by 2050 — rents likely to lag national; underwrite the cash flow, not the appreciation.
Negotiation context
- It's been on market 78 days — a 6% lower offer ($155k) is reasonable based on typical stale-listing flexibility.
- 9 sale attempts since 28y ago; this cycle's ask has dropped $10k (6%) from the opening price — seller is motivated, your offer sets the floor, not the list.
- Current owner paid $85k; list at $165k implies a 94% gain — meaningful room to come down on a strong offer.
Risks & watch-outs
- Watch-outs: flood insurance adds $427/mo; built in 1908 — expect roof / HVAC / electrical / plumbing capex.
- Climate carrying-cost: in FEMA flood zone AE (mandatory federal flood insurance); major wind risk, 76% chance of damaging wind over 30y; extreme-heat days projected 7→16/yr by 2055 (HVAC capex compounding) — expect insurance premiums to compound above CPI over the hold.
Questions for the listing agent
- It's been on market 78 days. Have you received any prior offers? Is the seller open to a 6% concession, seller financing, or rate buy-down credit?
- Built in 1908 — when were the roof, HVAC, electrical panel, plumbing, and water heater last replaced?
- What's the actual annual flood-insurance premium (NFIP or private), and is the property in a SFHA with mandatory coverage?
- Why hasn't it sold? Are there any deal-killer items the seller is aware of (foundation, flood, title, zoning, code violations)?
- Is there a deadline driving the sale (1031 exchange, divorce, estate, relocation)? That informs how much negotiation room exists.
- Schools are F-rated, which usually means shorter tenancies and higher turnover. Who's the typical renter profile here, and what's been the actual vacancy rate?
- Crime grade is F in this area — have there been break-ins, vandalism, or insurance claims at this property in the last 3 years? What carrier currently insures it and at what premium?
- What's the average days-on-market for RENTAL listings here right now (not sales)? A rising rental-DOM trend means longer vacancies and softer asking-rent achievability than the comps imply.
- What's the recent tenant-quality profile in this submarket — average credit score on applications, eviction rate, late-payment / NSF rate, and stable-employment percentage? A property-management company in the area should have these aggregated.
- How much new for-sale + rental construction is in the pipeline within 1–3 miles? Heavy new supply typically softens prices + rents 12–24 months out; constrained supply supports both.
Investment metrics
- 1% rule
- 1.33% ✓
- Cap rate
- 10.53%
- Cash-on-cash
- 15.12%
- DSCR
- 1.67
- GRM
- 6.2
CMA / ARV
- ARV (median comp)
- $316,322
- List price
- $165,000
- Delta
- -47.84%
- Verdict
- UNDERPRICED
- Comps
- 20 within 1.0 mi
Show comp detail 12 sales within ~0.75 mi
| Address | Dist | Beds/Ba | Sqft | Sold | Price | $/sf | Match |
|---|---|---|---|---|---|---|---|
| 210 Choptank Ave | 0.20mi | 3/1.5 | 1,744 (+3%) | 2mo | $245,000 | $140 | 82 |
| 211 Choptank Ave | 0.19mi | 3/2.0 | 1,608 (-5%) | 0mo | $205,000 | $127 | 78 |
| 1205 Hambrooks Blvd | 0.28mi | 3/2.0 | 1,657 (-2%) | 1mo | $315,000 | $190 | 78 |
| 5 Willis St | 0.03mi | 3/2.0 | 1,863 (+10%) | 1mo | $270,000 | $145 | 77 |
| 114 Belvedere Ave | 0.17mi | 3/1.5 | 1,624 (-4%) | 8mo | $289,900 | $179 | 77 |
| 107 W End Ave | 0.05mi | 3/2.0 | 1,836 (+8%) | 4mo | $275,000 | $150 | 77 |
| 3 Merryweather Dr | 0.73mi | 3/2.0 | 1,660 (-2%) | 0mo | $295,000 | $178 | 58 |
| 1 Somerset Ave | 0.43mi | 2/1.0 (-1) | 1,578 (-7%) | 6mo | $276,500 | $175 | 58 |
| 405 Leonards Ln | 0.49mi | 4/2.0 (+1) | 1,608 (-5%) | 5mo | $234,000 | $146 | 55 |
| 314 Muir St | 0.73mi | 3/1.5 | 1,796 (+6%) | 1mo | $76,500 | $43 | 54 |
| 306 Oakley St | 0.26mi | 4/2.0 (+1) | 1,905 (+12%) | 6mo | $415,000 | $218 | 53 |
| 412 Talbot Ave | 0.57mi | 3/2.0 | 1,809 (+7%) | 7mo | $325,000 | $180 | 53 |
Match score weights: distance 35% · size 25% · config 20% · recency 20%. Top-matched comps best support the ARV.
Projected returns pro-forma
-3.0% appreciation · 3.0% rent growth · sell at horizon
- IRR
- -9.8%
- Equity multiple
- 0.64×
- Total profit
- $-16,525
- Equity at exit
- $24,602
- IRR
- -0.1%
- Equity multiple
- 0.99×
- Total profit
- $-391
- Equity at exit
- $14,266
Cash invested: $46,200 (down + closing). Projections, not guarantees.
Landlord ↔ Tenant lean methodology
- Overall (STATE)
- 27 Tenant-Leaning
- State Maryland
- 27 Tenant-Leaning · D+14
- County
- — inherits STATE
- City
- — inherits STATE
ZIP-level market 21613
- Home prices YoY
- -25.1%
- Active inventory
- 292
- Price-to-rent
- 6.2×
Monthly cashflow live
- Estimated rent
- $2,202 high interval (Pro) →
- Mortgage (P&I)
- −$865
- Tax from tax record
- −$224 /mo · $2,684/yr
- Insurance
- −$69
- Flood insurance flood zone
- −$427 /mo · $5,118/yr
- HOA
- −$0
- Vacancy / Maint / Mgmt
- −$462
- Net cashflow
- $156
Break-even live
UW: 25.0% down · 7.5% · 30yr · 1.5% tax · 5.0% vac · 8.0% maint · 8.0% mgmt
Financing live
Cash to close
- Down payment
- $41,250
- Closing costs
- $4,950
- Reserves months
- —
- Total cash needed
- —
Loan-product check · same deal, 3 products live
Conventional
25% down · 7.5% · 30yr
- Down + closing
- —
- Monthly P&I
- —
- Monthly cashflow
- —
- DSCR
- —
- Eligible?
- —
Personal DTI + credit; lowest rate.
DSCR
20% down · 8.5% · 30yr
- Down + closing
- —
- Monthly P&I
- —
- Monthly cashflow
- —
- DSCR
- —
- Eligible?
- —
No personal income docs; deal must DSCR.
Hard money
10% down · 12.0% · 12mo
- Down + closing
- —
- Monthly P&I
- —
- Monthly cashflow
- —
- DSCR
- —
- Eligible?
- —
Short-term bridge; refi at stabilization.
Rent comps 5 comps
| Address | Beds | Baths | Sqft | Rent | $/sqft | DOM | Units | Dist |
|---|---|---|---|---|---|---|---|---|
| 414 Waterfield Ct Cambridge, MD | 3.0 | 2.5 | 2000 | $2,395 | $1.20 | 43d | 1 | 0.74mi |
| 401 N Seaway Ct Cambridge, MD | 3.0 | 2.5 | 1867 | $2,600 | $1.39 | 43d | 1 | 0.86mi |
| 804 Allen St Cambridge, MD | 4.0 | 2.0 | 1326 | $1,800 | $1.36 | 43d | 1 | 1.04mi |
| 406 Robbins St Cambridge, MD | 3.0 | 2.0 | 1296 | $1,800 | $1.39 | 43d | 1 | 1.11mi |
| 318 E Appleby Ave Cambridge, MD | 3.0 | 2.5 | 1536 | $2,100 | $1.37 | 43d | 1 | 1.46mi |
Listing history 42 events
-
2026-06-18days on market $165,000 Active 78 DOM
-
2026-06-17days on market $165,000 Active 77 DOM
-
2026-06-16days on market $165,000 Active 76 DOM
-
2026-06-15days on market $165,000 Active 75 DOM
-
2026-06-13days on market $165,000 Active 73 DOM
-
2026-06-12days on market $165,000 Active 72 DOM
-
2026-06-09days on market $165,000 Active 69 DOM
-
2026-06-09price $165,000 Active 68 DOM
-
2026-06-08days on market $175,000 Active 68 DOM
-
2026-06-07days on market $175,000 Active 67 DOM
-
2026-06-07days on market $175,000 Active 66 DOM
-
2026-06-04days on market $175,000 Active 63 DOM
-
2026-06-02days on market $175,000 Active 62 DOM
-
2026-06-01days on market $175,000 Active 61 DOM
-
2026-05-31days on market $175,000 Active 60 DOM
-
2026-05-31days on market $175,000 Active 59 DOM
-
2026-04-01$175,000 Active 1162-char remark
Show marketing remark (1162 chars)
Welcome to 10 Willis St, Step into timeless charm with this 1908 Colonial-style home ideally located in a highly desirable waterfront area. This property offers the perfect blend of historic character and investment potential. Featuring 3 of bedrooms and 1 bathroom, this home boasts classic architectural details, spacious living areas, and plenty of natural light throughout. Situated just moments from the water, the location alone makes this a standout opportunity. This property does require minor repairs and updates, making it ideal for investors, flippers, or buyers looking to build equity quickly. With strong upside potential, this home is a great candidate for renovation, rental income, or resale. Highlights: Prime waterfront location Historic 1908 Colonial with original charm Solid structure with value-add potential Spacious layout with generous room sizes Strong ARV (After Repair Value) potential Located in a desirable and established neighborhood Property is being sold AS-IS. Inspections are for informational purposes only. Don’t miss this chance to own a piece of history and unlock its full potential. Schedule your showing today!
-
2026-03-20historical $175,000 1162-char remark
Show marketing remark (1162 chars)
Welcome to 10 Willis St, Step into timeless charm with this 1908 Colonial-style home ideally located in a highly desirable waterfront area. This property offers the perfect blend of historic character and investment potential. Featuring 3 of bedrooms and 1 bathroom, this home boasts classic architectural details, spacious living areas, and plenty of natural light throughout. Situated just moments from the water, the location alone makes this a standout opportunity. This property does require minor repairs and updates, making it ideal for investors, flippers, or buyers looking to build equity quickly. With strong upside potential, this home is a great candidate for renovation, rental income, or resale. Highlights: Prime waterfront location Historic 1908 Colonial with original charm Solid structure with value-add potential Spacious layout with generous room sizes Strong ARV (After Repair Value) potential Located in a desirable and established neighborhood Property is being sold AS-IS. Inspections are for informational purposes only. Don’t miss this chance to own a piece of history and unlock its full potential. Schedule your showing today!
-
2024-10-03historical
-
2024-09-09status Active
-
2024-08-30status Pending
-
2024-08-17price $199,900
-
2024-08-02$209,000 Active
-
2024-07-27historical
-
2022-07-18soldstatus $85,000
-
2020-11-20soldstatus $105,500 Closed
-
2020-10-12status Pending
-
2020-09-26Active Under Contract
-
2020-09-26$115,000
-
2005-06-27historical
-
2005-05-25
-
2004-12-06soldstatus $166,000
-
2004-10-27soldstatus $166,000
-
2004-09-26historical
-
2004-09-20$178,500
-
2001-08-28soldstatus $73,000
-
2001-08-07historical
-
2001-07-19$72,500
-
1998-12-21soldstatus $57,500
-
1998-12-15soldstatus $57,500
-
1998-11-06historical
-
1998-08-06$57,500
ⓘ Source: listings_history table (triggers on properties + properties_extension) + one-shot
backfill from property_details.listing_events for pre-trigger history.
Tax reassessment forecast MD · Partial reset (capped growth)
- Current annual tax
- $2,684 · $224/mo
- Projected year-2 tax
- $2,684 · $224/mo
- Expected delta
- $0/yr ($0/mo · 0.0%)
ⓘ Screening estimate from a state-policy table — verify with the county assessor before closing.
Climate risk First Street
- Flood 10/10 Extreme FEMA zone AE · 99% chance over 30 yrs
- Wildfire 3/10 Moderate
- Heat 9/10 Extreme 7 d/yr ≥105°F today · 16 d/yr by 30 yrs out
- Wind 7/10 Severe 76% chance of damaging wind over 30 yrs
- Air quality 3/10 Moderate 2 unhealthy d/yr today · 3 by 30 yrs out
Nearby sold comps map
Loading sold comps map…
Walkable amenities ~0.75 mi
Loading nearby amenities…
Taxation est. · year 1
- Rental income
- $26,427
- − Mortgage interest
- −$9,243
- − Property taxes
- −$2,684
- − Insurance
- −$5,944
- − Repairs & maintenance
- −$2,114
- − Management
- −$2,114
- − Depreciation
- −$4,800
- Taxable loss
- −$471
- Est. tax savings @ 24.0%
- +$113
- After-tax cash flow
- $1,980/yr
For passive investors: Depreciation is non-cash, so a rental often shows a tax loss while cash-flowing — sheltering income. Rental losses are passive: they offset passive income freely, and up to $25,000/yr can offset ordinary (W-2) income if you actively participate and your MAGI is under $100k (phasing out to $0 by $150k); unused losses carry forward. On sale, claimed depreciation is recaptured at up to 25%, and gains may owe capital-gains tax (a 1031 exchange can defer both). Figures are a year-1 estimate at your 24.0% rate — not tax advice; consult a CPA.
Schools (NCES district)
- District
- Dorchester County Public Schools
- NCES district ID
- 2400300
- Math proficiency
- 10% ▼ -14.00%
- Reading proficiency
- 23% ▼ -12.00%
- Median HH income
- $46,767
- Composite
- 14.65/100
- National rank
- #9404
- State rank
- #23 of 24 in MD
Livability — Cambridge
- Score
- 65/100
- State rank
- #255
- US rank
- #13046
Category grades
Schools grade is shown separately in the Schools card above.
Census & demographics
- Census place
- Cambridge, MD
- Population (ZIP)
- 18,167
Population outlook (Dorchester County) Hauer SSP2
- Today (2025)
- 31,699 people
- By 2030
- 31,054 · -2.0%
- By 2040
- 29,712 · -6.3%
- By 2050
- 28,618 · -9.7%
- By 2075
- 28,436 · -10.3%
- By 2100
- 28,937 · -8.7%
Race, ethnicity, and origin ACS 2023
- Neighborhood character
- Diverse neighborhood (Simpson 0.62)
- Race & ethnicity
- White 52% Black 33% Two or more races 10% Hispanic / Latino 6% Asian 2%
- Hispanic origin (detail)
- Puerto Rican 3%
- Common ancestry
- Romanian 1% Lithuanian 1% Italian 1%
- Foreign-born
- 4% · Canada
- Languages at home
- 95% English-only · Spanish 3% Other Indo-European 1% German/W. Germanic 1%
Political lean MEDSL · Dorchester
- 2024 margin
- R (+14.6) · D 41.6% · R 56.1% · Other 2.3%
- 2008→2024 swing
- -6.3pp toward R · 2008: -8.2pp · 2024: -14.6pp
- All cycles
- 2024: R+14.6 2020: R+11.9 2016: R+16.0 2012: R+6.6 2008: R+8.2
Not yet ingested
- Civics
- —
Market trends
- HPI YoY
- ▼ -91.03%
- Current HPI
- 271.1127
- Rent YoY
- —
- Metro
- —
- State GDP YoY
- ▲ 2.97%
- F500 in state
- 12
Industry mix (Fortune 500 HQ in MD)
| Industry | F500 HQs | Revenue |
|---|---|---|
| Aerospace / Defense | 1 | $71B |
|
||
| Utilities | 1 | $25B |
|
||
| Hotels | 1 | $24B |
|
||
| Consumer Goods | 1 | $7B |
|
||
| Real Estate | 1 | $6B |
|
||
| Chemicals | 1 | $2B |
|
||
Price history
+204.3% since first listed26 events — show timeline
- 2026-04-01 Listed $175,000 BRIGHT MLS
- 2026-03-20 Coming Soon $175,000 BRIGHT MLS
- 2024-10-03 Listing Removed — BRIGHT MLS
- 2024-09-09 Relisted — BRIGHT MLS
- 2024-08-30 Pending — BRIGHT MLS
- 2024-08-17 Price Changed $199,900 BRIGHT MLS
- 2024-08-02 Listed $209,000 BRIGHT MLS
- 2024-07-27 Coming Soon — BRIGHT MLS
- 2022-07-18 Sold (Public Records) $85,000 Public Records
- 2020-11-20 Sold (MLS) $105,500 BRIGHT MLS
- 2020-10-12 Pending — BRIGHT MLS
- 2020-09-26 Listed — BRIGHT MLS
- 2020-09-26 Listed $115,000 BRIGHT MLS
- 2005-06-27 Delisted — MRIS
- 2005-05-25 Listed — MRIS
- 2004-12-06 Sold (Public Records) $166,000 Public Records
- 2004-10-27 Sold (MLS) $166,000 MRIS
- 2004-09-26 Delisted — MRIS
- 2004-09-20 Listed $178,500 MRIS
- 2001-08-28 Sold (MLS) $73,000 MRIS
- 2001-08-07 Delisted — MRIS
- 2001-07-19 Listed $72,500 MRIS
- 1998-12-21 Sold (Public Records) $57,500 Public Records
- 1998-12-15 Sold (MLS) $57,500 MRIS
- 1998-11-06 Delisted — MRIS
- 1998-08-06 Listed $57,500 MRIS
Property tax history
+3.4%/yrLatest (2025): $2,684 · +6.4% YoY. Source: county tax records.
Cash-flow waterfall
monthlySold comps — $/sqft
last 12 mo · ≤1 miLoading sold comps…