76 Rose Park · Melrose, MN
Flood risk 4/10 · Minor
- FEMA flood zone
- X (unshaded)
- Chance of flooding over 30 yrs
- 0.21%
- Est. flood insurance / yr
- $507 – $1,088
Fire risk 1/10 · Minimal
- Est. fire insurance / yr
- $888 – $1,650
Heat risk 1/10 · Minimal
- Hot days now (above 98°F)
- 7 days/yr
- Hot days in 30 yrs
- 13 days/yr
Wind risk 2/10 · Minimal
- Chance of severe wind over 30 yrs
- —
Air-quality risk 2/10 · Minimal
- Unhealthy air days now
- 2 days/yr
- Unhealthy air days in 30 yrs
- 2 days/yr
Risk factors via First Street. Map © Google.
Why this score? — see what drove the A- grade
The composite is a weighted blend of 9 inputs, each scored 0–100. Each bar is that input's sub-score; the figure is the points it added to the 100-point composite (weight × sub-score).
- Cash flow +30.0/30.0
- 1% rule +10.0/10.0
- DSCR +10.0/10.0
- Appreciation +10.0/10.0
- ARV discount +7.5/15.0
- Schools +4.1/10.0
- Livability +3.8/5.0
- Rent growth +2.5/5.0
- Condition / age +2.2/5.0
$115,000
🖨 Deal sheet 📄 Offer letter ✓ Due diligence
Listing remarks
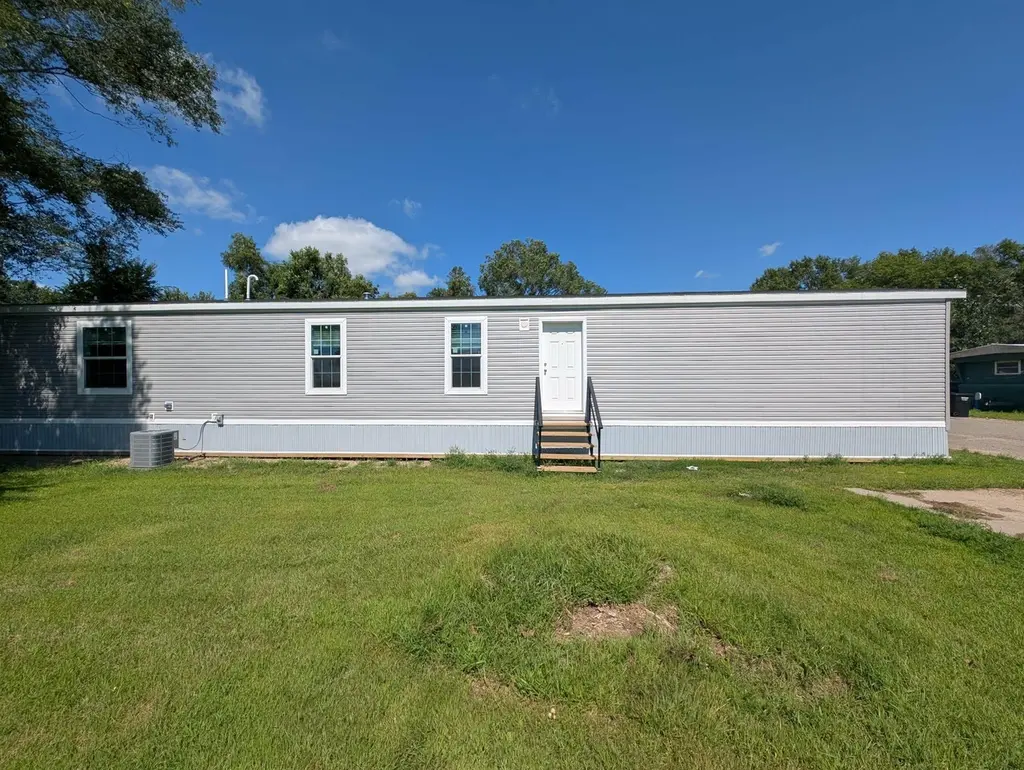
Rose Park is a welcoming manufactured housing community located in the heart of Melrose, Minnesota — a charming small town known for its strong sense of community, excellent schools, and family-friendly atmosphere. Our neighborhood offers quiet streets, friendly neighbors, and an environment where families, retirees, and individuals can feel comfortable and connected. Residents enjoy the benefits of small-town living while still having convenient access to local shopping, dining, parks, healthcare, and recreation. Melrose is known for its highly regarded school system, safe neighborhoods, and active community events throughout the year. Whether you're raising a family, downsizing, or
Key facts
- Quiet streets
- Spacious lots
- Built 2024
Tags
Property features AI
Finance
- Financial info: Land lease payment: $535
- HOA & community: Land is leased
Exterior
- Parking: Driveway with other surface
- Utilities: City water connected; City sewer connected; Natural gas
- Home design: Residential manufactured home; One level
- Construction: New construction; Built on a foundation
- Exterior features: Vinyl exterior
Interior
- Kitchen: Dishwasher, Range, Refrigerator
- Bedrooms: 3 bedrooms
- Bathrooms: 2 full bathrooms
- Heating & cooling: Forced air heating; Central air conditioning
- Interior features: Dishwasher, Range, Refrigerator; No basement; Central air
Neighborhood map
What this means for you Summary
Snapshot
- This is a 3-bed/2.0-bath single-family listed at $115k. Condition is rated fair.
Deal economics
- At list price, monthly cash flow is $572 ($7k/yr) — positive.
- The deal already cash-flows at list — no discount required.
- Meets the 1% rule at list price ($2k rent vs $115k).
- Recommended offer: $113k (1.5% below list) — sets the bar for market timing.
Location & tenants
- Location reads 76/100 on livability (#164 in MN, #3,568 nationally) — a middle-class / working-renter tenant base. Strengths: crime A+, cost of living A+, housing A+; Watch: amenities F, commute F.
- Melrose Public School District (rural): math 45% / reading 50% proficiency, ranked #142 of 301 in MN (top 47%) — families likely to look elsewhere, expect single-tenant / working-renter base with shorter leases.
- Market conditions: 31 active listings in the ZIP; 1 comparable units currently listed for rent nearby; 661 units permitted in Stearns County in 2024 (291 in 5+ unit buildings).
Forward outlook
- In year one you build about $12k of equity ($795 loan paydown + $12k appreciation (10.0% local appreciation)).
- Stearns County population projected at +9% by 2050 — modest demand growth; plan on rents tracking national, not racing it.
- At projected returns (10.0% appreciation + 3.0% rent growth), your $32k cash investment doubles in ~2 years — after that, you're playing with house money.
- By year 3, paydown + projected appreciation supports a ~$31k cash-out refi (75% LTV) — recoverable capital for the next deal without selling this one.
Negotiation context
- It's been on market 24 days — a 2% lower offer ($113k) is reasonable based on typical stale-listing flexibility.
- 3 sale attempts with the ask held roughly flat each time — persistent listings suggest the price (not the market) is what's stuck; bring a comps-based counter.
Questions for the listing agent
- Have any recent inspections been done? Can we get a copy of the seller's disclosures and any deferred-maintenance estimates?
- Is there a deadline driving the sale (1031 exchange, divorce, estate, relocation)? That informs how much negotiation room exists.
- Schools are B-rated — typically a magnet for longer-tenancy family renters. What's the average tenant stay here, and is there a school-zone premium baked into asking?
- What's the average days-on-market for RENTAL listings here right now (not sales)? A rising rental-DOM trend means longer vacancies and softer asking-rent achievability than the comps imply.
- What's the recent tenant-quality profile in this submarket — average credit score on applications, eviction rate, late-payment / NSF rate, and stable-employment percentage? A property-management company in the area should have these aggregated.
- How much new for-sale + rental construction is in the pipeline within 1–3 miles? Heavy new supply typically softens prices + rents 12–24 months out; constrained supply supports both.
Investment metrics
- 1% rule
- 1.50% ✓
- Cap rate
- 12.26%
- Cash-on-cash
- 21.32%
- DSCR
- 1.95
- GRM
- 5.5
CMA / ARV
No comps found within radius.
Projected returns pro-forma
10.0% appreciation · 3.0% rent growth · sell at horizon
- IRR
- 40.2%
- Equity multiple
- 4.08×
- Total profit
- $99,087
- Equity at exit
- $103,601
- IRR
- 34.7%
- Equity multiple
- 9.17×
- Total profit
- $263,199
- Equity at exit
- $223,420
Cash invested: $32,200 (down + closing). Projections, not guarantees.
Landlord ↔ Tenant lean methodology
- Overall (STATE)
- 46 Balanced
- State Minnesota
- 46 Balanced · D+2
- County
- — inherits STATE
- City
- — inherits STATE
ZIP-level market 56352
- Home prices YoY
- 6.1%
- Active inventory
- 31
- Price-to-rent
- 5.5×
Monthly cashflow live
- Estimated rent
- $1,730 medium interval (Pro) →
- Mortgage (P&I)
- −$603
- Tax est. 1.5%
- −$144 /mo · $1,725/yr
- Insurance
- −$48
- HOA
- −$0
- Vacancy / Maint / Mgmt
- −$363
- Net cashflow
- $572
Break-even live
UW: 25.0% down · 7.5% · 30yr · 1.5% tax · 5.0% vac · 8.0% maint · 8.0% mgmt
Financing live
Cash to close
- Down payment
- $28,750
- Closing costs
- $3,450
- Reserves months
- —
- Total cash needed
- —
Loan-product check · same deal, 3 products live
Conventional
25% down · 7.5% · 30yr
- Down + closing
- —
- Monthly P&I
- —
- Monthly cashflow
- —
- DSCR
- —
- Eligible?
- —
Personal DTI + credit; lowest rate.
DSCR
20% down · 8.5% · 30yr
- Down + closing
- —
- Monthly P&I
- —
- Monthly cashflow
- —
- DSCR
- —
- Eligible?
- —
No personal income docs; deal must DSCR.
Hard money
10% down · 12.0% · 12mo
- Down + closing
- —
- Monthly P&I
- —
- Monthly cashflow
- —
- DSCR
- —
- Eligible?
- —
Short-term bridge; refi at stabilization.
Rent comps 1 comps
| Address | Beds | Baths | Sqft | Rent | $/sqft | DOM | Units | Dist |
|---|---|---|---|---|---|---|---|---|
| 1250 W Railroad Ave Melrose, MN | 1.0–3.0 | 1.0–2.0 | 950 | $1,730 | $1.82 | 43d | 17 | 0.99mi |
Listing history 20 events
-
2026-06-18days on market $115,000 Active 24 DOM
-
2026-06-17days on market $115,000 Active 23 DOM
-
2026-06-16days on market $115,000 Active 22 DOM
-
2026-06-15days on market $115,000 Active 21 DOM
-
2026-06-13days on market $115,000 Active 19 DOM
-
2026-06-12days on market $115,000 Active 18 DOM
-
2026-06-09days on market $115,000 Active 15 DOM
-
2026-06-08days on market $115,000 Active 14 DOM
-
2026-06-07days on market $115,000 Active 13 DOM
-
2026-06-07days on market $115,000 Active 12 DOM
-
2026-06-04days on market $115,000 Active 9 DOM
-
2026-06-02days on market $115,000 Active 8 DOM
-
2026-06-01days on market $115,000 Active 7 DOM
-
2026-05-31days on market $115,000 Active 6 DOM
-
2026-05-31days on market $115,000 Active 5 DOM
-
2026-05-25$115,000 Active
-
2026-02-21historical
-
2026-01-29status Active
-
2025-09-18historical Contingent - Subject to Financing
-
2025-08-20$115,000 Active
ⓘ Source: listings_history table (triggers on properties + properties_extension) + one-shot
backfill from property_details.listing_events for pre-trigger history.
Climate risk First Street
- Flood 4/10 Moderate FEMA zone X (unshaded) · 21% chance over 30 yrs
- Wildfire 1/10 Low
- Heat 1/10 Low 7 d/yr ≥98°F today · 13 d/yr by 30 yrs out
- Wind 2/10 Low
- Air quality 2/10 Low 2 unhealthy d/yr today · 2 by 30 yrs out
Nearby sold comps map
Loading sold comps map…
Walkable amenities ~0.75 mi
Loading nearby amenities…
Taxation est. · year 1
- Rental income
- $20,760
- − Mortgage interest
- −$6,442
- − Property taxes
- −$1,725
- − Insurance
- −$575
- − Repairs & maintenance
- −$1,661
- − Management
- −$1,661
- − Depreciation
- −$3,345
- Taxable income
- $5,351
- Est. tax owed @ 24.0%
- −$1,284
- After-tax cash flow
- $5,579/yr
For passive investors: Depreciation is non-cash, so a rental often shows a tax loss while cash-flowing — sheltering income. Rental losses are passive: they offset passive income freely, and up to $25,000/yr can offset ordinary (W-2) income if you actively participate and your MAGI is under $100k (phasing out to $0 by $150k); unused losses carry forward. On sale, claimed depreciation is recaptured at up to 25%, and gains may owe capital-gains tax (a 1031 exchange can defer both). Figures are a year-1 estimate at your 24.0% rate — not tax advice; consult a CPA.
Condition & rehab AI · 3 photos
The home requires significant exterior repairs and maintenance, including painting, landscaping, and repairs to the roof, siding, and concrete slab. These updates will improve the home's condition and make it more attractive to both buyers and renters.
Repairs flagged
- Major siding — The siding is visibly weathered and in poor condition.
- Major roof — The roof appears to be in need of repair or replacement.
- Major concrete slab — The concrete slab in front of the house shows signs of wear and potential cracking, which may need repair or replacement.
- Moderate HVAC and electrical systems — The exterior suggests the need for updates to the HVAC and electrical systems, which are not visible in the provided photos.
Value-add opportunities
- Resale painting the exterior — Painting the exterior can significantly improve the curb appeal and resale value.
- Rental landscaping and curb appeal improvements — Enhancing the landscaping and curb appeal can attract more renters and increase rental value.
- Both repairing the roof and siding — Repairing the roof and siding will improve the home's condition and make it more attractive to both buyers and renters.
- Both repairing the concrete slab — Repairing the concrete slab will improve the home's condition and make it more attractive to both buyers and renters.
- Both upgrading HVAC and electrical systems — Upgrading the HVAC and electrical systems will improve the home's condition and make it more attractive to both buyers and renters.
Renovation cost estimate screening
| Repair item | Severity | Est. cost |
|---|---|---|
| siding · The siding is visibly weathered and in poor condition. | Major | $15,000–50,000 |
| roof · The roof appears to be in need of repair or replacement. | Major | $15,000–50,000 |
| concrete slab · The concrete slab in front of the house shows signs of wear and potential cracking, which may need repair or replacement. | Major | $15,000–50,000 |
| HVAC and electrical systems · The exterior suggests the need for updates to the HVAC and electrical systems, which are not visible in the provided photos. | Moderate | $3,000–15,000 |
| Total estimated repair cost · 4 items | $48,000–165,000 |
Value-add ROI direction
- Resale painting the exterior — Painting the exterior can significantly improve the curb appeal and resale value. ↑
- Rental landscaping and curb appeal improvements — Enhancing the landscaping and curb appeal can attract more renters and increase rental value. ↑
- Both repairing the roof and siding — Repairing the roof and siding will improve the home's condition and make it more attractive to both buyers and renters. ↑
- Both repairing the concrete slab — Repairing the concrete slab will improve the home's condition and make it more attractive to both buyers and renters. ↑
- Both upgrading HVAC and electrical systems — Upgrading the HVAC and electrical systems will improve the home's condition and make it more attractive to both buyers and renters. ↑
ⓘ Cost ranges are severity-bucket heuristics (US national rule-of-thumb). Get contractor quotes + a written scope before underwriting a rehab budget.
Schools (NCES district)
- District
- Melrose Public School District
- NCES district ID
- 2720550
- Math proficiency
- 45% ▼ -14.00%
- Reading proficiency
- 50% ▼ -5.00%
- Median HH income
- $55,833
- Composite
- 41.26/100
- National rank
- #3525
- State rank
- #142 of 301 in MN
Livability — Melrose
- Score
- 76/100
- State rank
- #164
- US rank
- #3568
Category grades
Schools grade is shown separately in the Schools card above.
Census & demographics
- Census place
- Melrose, MN
- Population (ZIP)
- 5,955
Population outlook (Stearns County) Hauer SSP2
- Today (2025)
- 162,629 people
- By 2030
- 166,495 · +2.4%
- By 2040
- 172,661 · +6.2%
- By 2050
- 177,480 · +9.1%
- By 2075
- 192,907 · +18.6%
- By 2100
- 206,274 · +26.8%
Race, ethnicity, and origin ACS 2023
- Neighborhood character
- Predominantly White (86%)
- Race & ethnicity
- White 86% Hispanic / Latino 12% Two or more races 2%
- Hispanic origin (detail)
- Mexican 11%
- Common ancestry
- Portuguese 4% Romanian 4% Lithuanian 2%
- Foreign-born
- 5% · Canada
- Languages at home
- 87% English-only · Spanish 11% German/W. Germanic 1%
Political lean MEDSL · Stearns
- 2024 margin
- Strong R (+26.8) · D 35.7% · R 62.5% · Other 1.9%
- 2008→2024 swing
- -19.8pp toward R · 2008: -7.0pp · 2024: -26.8pp
- All cycles
- 2024: R+26.8 2020: R+22.5 2016: R+27.9 2012: R+12.1 2008: R+7.0
Not yet ingested
- Civics
- —
Market trends
- HPI YoY
- ▲ 23.62%
- Current HPI
- 410.59
- Rent YoY
- —
- Metro
- —
- State GDP YoY
- ▲ 2.41%
- F500 in state
- 34
Industry mix (Fortune 500 HQ in MN)
| Industry | F500 HQs | Revenue |
|---|---|---|
| Healthcare | 2 | $407B |
|
||
| Retail | 2 | $150B |
|
||
| Consumer Goods | 2 | $32B |
|
||
| Industrial Machinery | 2 | $6B |
|
||
| Agriculture | 1 | $40B |
|
||
| Healthcare / Medical Devices | 1 | $32B |
|
||
Price history
+0.0% since first listed5 events — show timeline
- 2026-05-25 Listed $115,000 NORTHSTARMLS as Distributed by MLS Grid
- 2026-02-21 Listing Removed — NORTHSTARMLS as Distributed by MLS Grid
- 2026-01-29 Relisted — NORTHSTARMLS as Distributed by MLS Grid
- 2025-09-18 Contingent — NORTHSTARMLS as Distributed by MLS Grid
- 2025-08-20 Listed $115,000 NORTHSTARMLS as Distributed by MLS Grid
Cash-flow waterfall
monthlySold comps — $/sqft
last 12 mo · ≤1 miLoading sold comps…