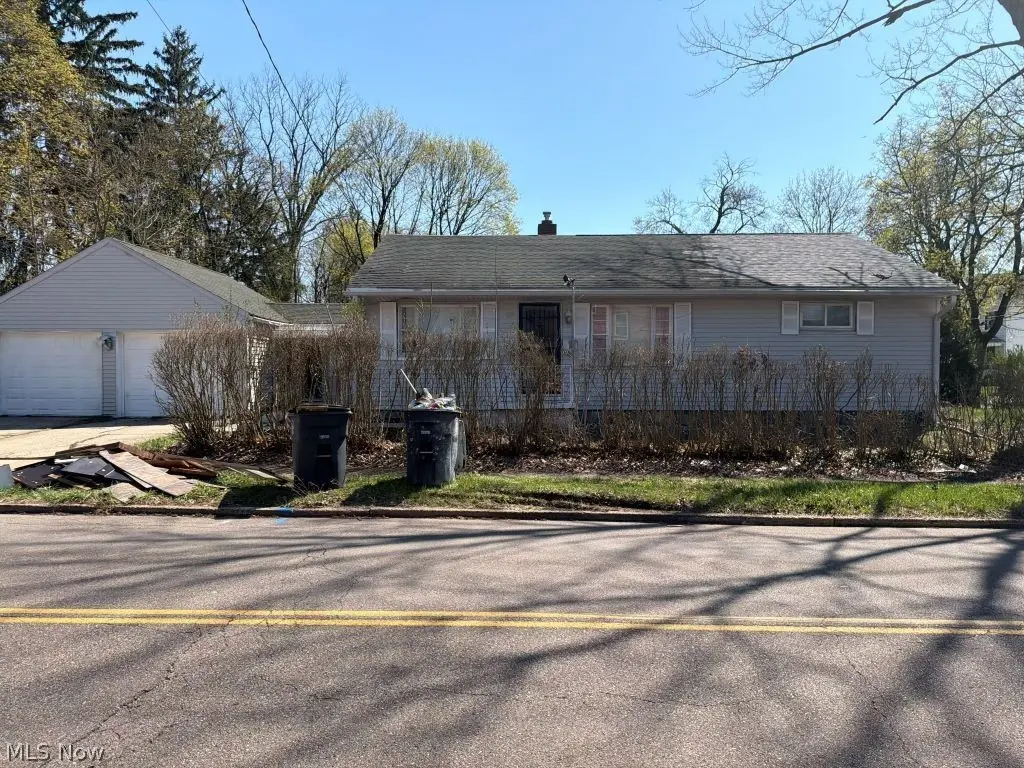
22 Uhler Ave · Akron, OH
Flood risk 1/10 · Minimal
- FEMA flood zone
- X (unshaded)
- Chance of flooding over 30 yrs
- 0.0%
- Est. flood insurance / yr
- $473 – $860
Fire risk 1/10 · Minimal
- Est. fire insurance / yr
- $713 – $1,323
Heat risk 3/10 · Minor
- Hot days now (above 97°F)
- 7 days/yr
- Hot days in 30 yrs
- 16 days/yr
Wind risk 1/10 · Minimal
- Chance of severe wind over 30 yrs
- —
Air-quality risk 3/10 · Minor
- Unhealthy air days now
- 2 days/yr
- Unhealthy air days in 30 yrs
- 4 days/yr
Risk factors via First Street. Map © Google.
Why this score? — see what drove the B+ grade
The composite is a weighted blend of 9 inputs, each scored 0–100. Each bar is that input's sub-score; the figure is the points it added to the 100-point composite (weight × sub-score).
- Cash flow +29.5/30.0
- ARV discount +15.0/15.0
- DSCR +10.0/10.0
- 1% rule +8.8/10.0
- Livability +4.0/5.0
- Rent growth +3.7/5.0
- Condition / age +2.5/5.0
- Schools +2.1/10.0
- Appreciation +0.0/10.0
$83,000
🖨 Deal sheet 📄 Offer letter ✓ Due diligence
Listing remarks MLS
"The property features a recently renovated kitchen and bathroom, new flooring throughout, and a roof that is approximately 5 years old. Electrical and plumbing systems are in good working condition, making this a great option for a light rehab or rental-ready investment. With key updates already completed, this property offers strong potential with minimal upfront work.
Key facts
- Renovated bathroom
- New flooring
- Renovated kitchen
Tags
Neighborhood map
What this means for you Summary
Snapshot
- This is a 3-bed/2.0-bath single-family listed at $83k.
Deal economics
- At list price, monthly cash flow is $298 ($4k/yr) — positive.
- The deal already cash-flows at list — no discount required.
- Meets the 1% rule at list price ($1k rent vs $83k).
- Recommended offer: $78k (6.0% below list) — sets the bar for market timing.
- Cap rate 10.6% vs local median 6.6% in Akron — top-decile yield for the area; either an underpriced asset or a hidden risk that comps aren't pricing in. Stress-test before assuming the spread holds.
Location & tenants
- Location reads 81/100 on livability (#104 in OH, #1,591 nationally) — a professional / high-income tenant draw. Strengths: amenities A+, commute A+, cost of living A+; Watch: crime F, employment F.
- Akron City (urban): math 22% / reading 30% proficiency, ranked #602 of 656 in OH (top 92%) — low school quality limits family demand, transient renter base, plan for 1-2y turnover; 66% free/reduced lunch — lower-income household profile, screen leases tightly.
- Market conditions: Rents rising fast (+4.8%/yr); 86 active listings in the ZIP; 25 comparable units currently listed for rent nearby; rentals at typical pace (median 23d on market — plan ~3-4 weeks tenant-placement turnaround); 48% of comp listings sitting > 30 days — soft ceiling on asking rent; lower-income renter base — watch delinquency; 1,114 units permitted in Summit County in 2024 (397 in 5+ unit buildings).
- This rent runs 33% of the median local income ($41k/yr) — at the standard rent-burdened threshold; future hikes will face affordability resistance.
Forward outlook
- Local home prices are declining (-3.0%/yr); year-one equity from $574 of loan paydown is wiped out by about $2k of value loss. Plan a longer hold.
- Summit County population projected to shrink 6% by 2050 — rents likely to lag national; underwrite the cash flow, not the appreciation.
- At projected returns (-3.0% appreciation + 4.8% rent growth), your $23k cash investment doubles in ~7 years — after that, you're playing with house money.
Negotiation context
- It's been on market 63 days — a 6% lower offer ($78k) is reasonable based on typical stale-listing flexibility.
- 6 sale attempts since 3y ago; this cycle's ask has dropped $17k (17%) from the opening price — seller is motivated, your offer sets the floor, not the list.
- Current owner paid $58k; 43% above their basis — modest negotiation headroom, anchor on the comps not their cost.
Risks & watch-outs
- Watch-outs: built in 1954 — expect roof / HVAC / electrical / plumbing capex.
Questions for the listing agent
- It's been on market 63 days. Have you received any prior offers? Is the seller open to a 6% concession, seller financing, or rate buy-down credit?
- Built in 1954 — when were the roof, HVAC, electrical panel, plumbing, and water heater last replaced?
- Why hasn't it sold? Are there any deal-killer items the seller is aware of (foundation, flood, title, zoning, code violations)?
- Is there a deadline driving the sale (1031 exchange, divorce, estate, relocation)? That informs how much negotiation room exists.
- Crime grade is F in this area — have there been break-ins, vandalism, or insurance claims at this property in the last 3 years? What carrier currently insures it and at what premium?
- What's the average days-on-market for RENTAL listings here right now (not sales)? A rising rental-DOM trend means longer vacancies and softer asking-rent achievability than the comps imply.
- What's the recent tenant-quality profile in this submarket — average credit score on applications, eviction rate, late-payment / NSF rate, and stable-employment percentage? A property-management company in the area should have these aggregated.
- How much new for-sale + rental construction is in the pipeline within 1–3 miles? Heavy new supply typically softens prices + rents 12–24 months out; constrained supply supports both.
Investment metrics
- 1% rule
- 1.38% ✓
- Cap rate
- 10.60%
- Cash-on-cash
- 15.37%
- DSCR
- 1.68
- GRM
- 6.0
CMA / ARV
- ARV (median comp)
- $105,907
- List price
- $83,000
- Delta
- -21.63%
- Verdict
- UNDERPRICED
- Comps
- 20 within 1.0 mi
Show comp detail 12 sales within ~0.75 mi
| Address | Dist | Beds/Ba | Sqft | Sold | Price | $/sf | Match |
|---|---|---|---|---|---|---|---|
| 761 Garfield St | 0.24mi | 3/1.5 | 1,208 (-7%) | 6mo | $155,000 | $128 | 71 |
| 447 Cuyahoga St | 0.48mi | 3/1.0 | 1,277 (-2%) | 2mo | $100,000 | $78 | 70 |
| 841 Springdale St | 0.30mi | 3/2.5 | 1,200 (-7%) | 4mo | $163,600 | $136 | 69 |
| 1026 Woodward Ave | 0.59mi | 3/1.0 | 1,302 (+0%) | 1mo | $128,000 | $98 | 67 |
| 600 Robinette Ct | 0.62mi | 3/2.0 | 1,264 (-2%) | 1mo | $105,000 | $83 | 66 |
| 462 Spaulding St | 0.55mi | 3/2.5 | 1,332 (+3%) | 2mo | $159,000 | $119 | 66 |
| 81 E Dalton St | 0.31mi | 2/1.0 (-1) | 1,373 (+6%) | 2mo | $112,000 | $82 | 65 |
| 1033 Chalker St | 0.48mi | 3/1.0 | 1,210 (-7%) | 4mo | $99,000 | $82 | 59 |
| 230 Helen Ave | 0.50mi | 4/1.5 (+1) | 1,390 (+7%) | 1mo | $154,000 | $111 | 57 |
| 958 Woodward Ave | 0.50mi | 3/1.5 | 1,439 (+11%) | 6mo | $115,000 | $80 | 52 |
| 203 E York St | 0.63mi | 3/1.5 | 1,415 (+9%) | 6mo | $75,000 | $53 | 48 |
| 1076 Chalker St | 0.55mi | 4/1.5 (+1) | 1,427 (+10%) | 5mo | $165,000 | $116 | 46 |
Match score weights: distance 35% · size 25% · config 20% · recency 20%. Top-matched comps best support the ARV.
Projected returns pro-forma
-3.0% appreciation · 4.82% rent growth · sell at horizon
- IRR
- 8.2%
- Equity multiple
- 1.33×
- Total profit
- $7,682
- Equity at exit
- $12,376
- IRR
- 19.1%
- Equity multiple
- 2.74×
- Total profit
- $40,351
- Equity at exit
- $7,176
Cash invested: $23,240 (down + closing). Projections, not guarantees.
Landlord ↔ Tenant lean methodology
- Overall (STATE)
- 73 Landlord-Friendly
- State Ohio
- 73 Landlord-Friendly · R+6
- County
- — inherits STATE
- City
- — inherits STATE
ZIP-level market 44310
- Rents YoY
- 4.8%
- Active inventory
- 86
- Price-to-rent
- 6.0×
Monthly cashflow live
- Estimated rent
- $1,146 high interval (Pro) →
- Mortgage (P&I)
- −$435
- Tax from tax record
- −$138 /mo · $1,651/yr
- Insurance
- −$35
- HOA
- −$0
- Vacancy / Maint / Mgmt
- −$241
- Net cashflow
- $298
Break-even live
UW: 25.0% down · 7.5% · 30yr · 1.5% tax · 5.0% vac · 8.0% maint · 8.0% mgmt
Financing live
Cash to close
- Down payment
- $20,750
- Closing costs
- $2,490
- Reserves months
- —
- Total cash needed
- —
Loan-product check · same deal, 3 products live
Conventional
25% down · 7.5% · 30yr
- Down + closing
- —
- Monthly P&I
- —
- Monthly cashflow
- —
- DSCR
- —
- Eligible?
- —
Personal DTI + credit; lowest rate.
DSCR
20% down · 8.5% · 30yr
- Down + closing
- —
- Monthly P&I
- —
- Monthly cashflow
- —
- DSCR
- —
- Eligible?
- —
No personal income docs; deal must DSCR.
Hard money
10% down · 12.0% · 12mo
- Down + closing
- —
- Monthly P&I
- —
- Monthly cashflow
- —
- DSCR
- —
- Eligible?
- —
Short-term bridge; refi at stabilization.
Rent comps 25 comps
| Address | Beds | Baths | Sqft | Rent | $/sqft | DOM | Units | Dist |
|---|---|---|---|---|---|---|---|---|
| 835 Carlysle St Akron, OH | 3.0 | 1.0 | 1152 | $1,250 | $1.09 | 43d | 1 | 0.12mi |
| 805 Carpenter St Akron, OH | 3.0 | 1.0 | 1056 | $1,100 | $1.04 | 23d | 1 | 0.16mi |
| 825 Avon St Unit 1 Akron, OH | 2.0 | 1.0 | 960 | $875 | $0.91 | 21d | 1 | 0.20mi |
| 674 Thayer St #676 Akron, OH | 2.0 | 1.0 | 1208 | $795 | $0.66 | 43d | 1 | 0.44mi |
| 674 Thayer St Unit 674 Akron, OH | 2.0 | 1.0 | 1208 | $825 | $0.68 | 43d | 1 | 0.44mi |
| 15 W York St Akron, OH | 2.0 | 1.5 | 1178 | $1,150 | $0.98 | 14d | 1 | 0.47mi |
| 15 W York St Akron, OH | 3.0 | 1.0 | 1178 | $1,150 | $0.98 | 21d | 1 | 0.47mi |
| 570 Dayton St Akron, OH | 3.0 | 1.0 | 1140 | $1,350 | $1.18 | 14d | 1 | 0.60mi |
| 559 Dayton St Akron, OH | 3.0 | 1.0 | 1200 | $1,200 | $1.00 | 43d | 1 | 0.63mi |
| 586 Robinette Ct Akron, OH | 4.0 | 1.0 | 1040 | $1,250 | $1.20 | 43d | 1 | 0.65mi |
| 265 Cranz Pl Akron, OH | 4.0 | 1.0 | 1376 | $1,300 | $0.94 | 43d | 1 | 0.75mi |
| 649 Patterson Ave Unit B Akron, OH | 3.0 | 1.0 | 1200 | $900 | $0.75 | 43d | 1 | 0.77mi |
| 649 Patterson Ave Unit a Akron, OH | 2.0 | 1.0 | 1000 | $775 | $0.78 | 43d | 1 | 0.78mi |
| 500 Delmar Ave Unit 502 Akron, OH | 2.0 | 1.0 | 1000 | $775 | $0.78 | 23d | 1 | 0.80mi |
| 539 E Cuyahoga Falls Ave Unit 1 Akron, OH | 2.0 | 1.0 | 1000 | $895 | $0.90 | 23d | 1 | 0.98mi |
| 1088 Lexington Ave Akron, OH | 3.0 | 1.0 | 1008 | $1,600 | $1.59 | 13d | 1 | 0.99mi |
| 1180 Murray Ave Akron, OH | 3.0 | 2.0 | 1340 | $1,175 | $0.88 | 21d | 1 | 1.02mi |
| 1390 N Howard St Akron, OH | 2.0 | 1.0 | 1000 | $1,000 | $1.00 | 43d | 1 | 1.04mi |
| 39 N Balch St Akron, OH | 4.0 | 1.0 | 1000 | $995 | $0.99 | 43d | 1 | 1.28mi |
| 45 Oakdale Ave Unit A Akron, OH | 2.0 | 1.0 | 1000 | $875 | $0.88 | 23d | 1 | 1.44mi |
| 45 Oakdale Ave Akron, OH | 2.0 | 1.0 | 1000 | $900 | $0.90 | 14d | 1 | 1.44mi |
| 207 Crosby St Akron, OH | 4.0 | 1.0 | 1200 | $1,395 | $1.16 | 43d | 1 | 1.44mi |
| 55 S Balch St Unit A Akron, OH | 2.0 | 1.0 | 1500 | $800 | $0.53 | 23d | 1 | 1.46mi |
| 53 S Balch St Unit 55 Akron, OH | 2.0 | 1.0 | 1500 | $850 | $0.57 | 14d | 1 | 1.46mi |
| 311 Crestwood Ave Akron, OH | 4.0 | 2.0 | 1800 | $1,395 | $0.78 | 43d | 1 | 1.47mi |
Listing history 24 events
-
2026-06-13days on market $83,000 Active 63 DOM
-
2026-06-10days on market $83,000 Active 61 DOM
-
2026-06-09days on market $83,000 Active 60 DOM
-
2026-06-08days on market $83,000 Active 59 DOM
-
2026-06-07days on market $83,000 Active 58 DOM
-
2026-06-05days on market $83,000 Active 55 DOM
-
2026-06-03days on market $83,000 Active 54 DOM
-
2026-06-02days on market $83,000 Active 53 DOM
-
2026-06-01days on market $83,000 Active 52 DOM
-
2026-05-31days on market $83,000 Active 51 DOM
-
2026-05-31days on market $83,000 Active 50 DOM
-
2026-04-16price $83,000 378-char remark
Show marketing remark (378 chars)
"The property features a recently renovated kitchen and bathroom, new flooring throughout, and a roof that is approximately 5 years old. Electrical and plumbing systems are in good working condition, making this a great option for a light rehab or rental-ready investment. With key updates already completed, this property offers strong potential with minimal upfront work.
-
2026-04-10$100,000 Active 378-char remark
Show marketing remark (378 chars)
"The property features a recently renovated kitchen and bathroom, new flooring throughout, and a roof that is approximately 5 years old. Electrical and plumbing systems are in good working condition, making this a great option for a light rehab or rental-ready investment. With key updates already completed, this property offers strong potential with minimal upfront work.
-
2026-02-02historical
-
2025-10-20price $110,000
-
2025-09-21$120,000 Active
-
2024-07-10status Active
-
2024-07-09historical
-
2024-07-02historical Contingent
-
2024-07-01status Active
-
2024-06-26$93,600 Active
-
2023-12-11soldstatus $58,000 Closed
-
2023-11-17status Pending
-
2023-11-02$47,700 Active
ⓘ Source: listings_history table (triggers on properties + properties_extension) + one-shot
backfill from property_details.listing_events for pre-trigger history.
Tax reassessment forecast OH · Partial reset (capped growth)
- Current annual tax
- $1,651 · $138/mo
- Projected year-2 tax
- $1,651 · $138/mo
- Expected delta
- $0/yr ($0/mo · 0.0%)
ⓘ Screening estimate from a state-policy table — verify with the county assessor before closing.
Climate risk First Street
- Flood 1/10 Low FEMA zone X (unshaded) · 0% chance over 30 yrs
- Wildfire 1/10 Low
- Heat 3/10 Moderate 7 d/yr ≥97°F today · 16 d/yr by 30 yrs out
- Wind 1/10 Low
- Air quality 3/10 Moderate 2 unhealthy d/yr today · 4 by 30 yrs out
Nearby sold comps map
Loading sold comps map…
Walkable amenities ~0.75 mi
Loading nearby amenities…
Taxation est. · year 1
- Rental income
- $13,748
- − Mortgage interest
- −$4,649
- − Property taxes
- −$1,651
- − Insurance
- −$415
- − Repairs & maintenance
- −$1,100
- − Management
- −$1,100
- − Depreciation
- −$2,415
- Taxable income
- $2,418
- Est. tax owed @ 24.0%
- −$580
- After-tax cash flow
- $2,991/yr
For passive investors: Depreciation is non-cash, so a rental often shows a tax loss while cash-flowing — sheltering income. Rental losses are passive: they offset passive income freely, and up to $25,000/yr can offset ordinary (W-2) income if you actively participate and your MAGI is under $100k (phasing out to $0 by $150k); unused losses carry forward. On sale, claimed depreciation is recaptured at up to 25%, and gains may owe capital-gains tax (a 1031 exchange can defer both). Figures are a year-1 estimate at your 24.0% rate — not tax advice; consult a CPA.
Schools (NCES district)
- District
- Akron City
- NCES district ID
- 3904348
- Math proficiency
- 22% ▼ -17.00%
- Reading proficiency
- 30% ▼ -12.00%
- Median HH income
- $33,811
- Composite
- 21.31/100
- National rank
- #8383
- State rank
- #602 of 656 in OH
Livability — Akron
- Score
- 81/100
- State rank
- #104
- US rank
- #1591
Category grades
Schools grade is shown separately in the Schools card above.
Census & demographics
- Census place
- Akron, OH
- County
- Summit County · 440,783 people
- City population
- 174,375
- Metro
- Akron, OH
- Population (ZIP)
- 25,496
- Household income
- $41,066
- Rent vs Own
- Severe rent burden
- 2058.0
Population outlook (Summit County) Hauer SSP2
- Today (2025)
- 546,583 people
- By 2030
- 544,028 · -0.5%
- By 2040
- 531,363 · -2.8%
- By 2050
- 514,923 · -5.8%
- By 2075
- 481,765 · -11.9%
- By 2100
- 432,265 · -20.9%
Race, ethnicity, and origin ACS 2023
- Neighborhood character
- Highly diverse neighborhood (Simpson 0.73)
- Race & ethnicity
- White 40% Black 25% Asian 20% Hispanic / Latino 10% Two or more races 9%
- Hispanic origin (detail)
- Mexican 6% Puerto Rican 2%
- Common ancestry
- Romanian 2% Slovak 1% Italian 1%
- Foreign-born
- 25% · Canada, India, Philippines
- Languages at home
- 69% English-only · Other Indo-European 13% Spanish 7% Other Asian/Pacific 6%
Political lean MEDSL · Summit
- 2024 margin
- Lean D (+7.0) · D 53.0% · R 46.0%
- 2008→2024 swing
- -9.6pp toward R · 2008: 16.6pp · 2024: 7.0pp
- All cycles
- 2024: D+7.0 2020: D+9.6 2016: D+8.2 2012: D+14.8 2008: D+16.6
Not yet ingested
- Civics
- —
Market trends
- HPI YoY
- ▼ -194.41%
- Current HPI
- 203.4431
- Rent YoY
- ▲ 4.82%
- Metro
- Akron, OH
- State GDP YoY
- ▲ 1.98%
- F500 in state
- 48
Industry mix (Fortune 500 HQ in OH)
| Industry | F500 HQs | Revenue |
|---|---|---|
| Insurance | 3 | $145B |
|
||
| Industrial Machinery | 3 | $49B |
|
||
| Financial Services | 3 | $24B |
|
||
| Consumer Goods | 2 | $93B |
|
||
| Aerospace / Defense | 2 | $47B |
|
||
| Utilities | 2 | $33B |
|
||
Price history
+74.0% since first listed13 events — show timeline
- 2026-04-16 Price Changed $83,000 MLSNOW
- 2026-04-10 Listed $100,000 MLSNOW
- 2026-02-02 Listing Removed — MLSNOW
- 2025-10-20 Price Changed $110,000 MLSNOW
- 2025-09-21 Listed $120,000 MLSNOW
- 2024-07-10 Relisted — MLSNOW
- 2024-07-09 Listing Removed — MLSNOW
- 2024-07-02 Contingent — MLSNOW
- 2024-07-01 Relisted — MLSNOW
- 2024-06-26 Listed $93,600 MLSNOW
- 2023-12-11 Sold (MLS) $58,000 MLSNOW
- 2023-11-17 Pending — MLSNOW
- 2023-11-02 Listed $47,700 MLSNOW
Property tax history
+10.3%/yrLatest (2025): $1,651 · +1.8% YoY. Source: county tax records.
Cash-flow waterfall
monthlySold comps — $/sqft
last 12 mo · ≤1 miLoading sold comps…