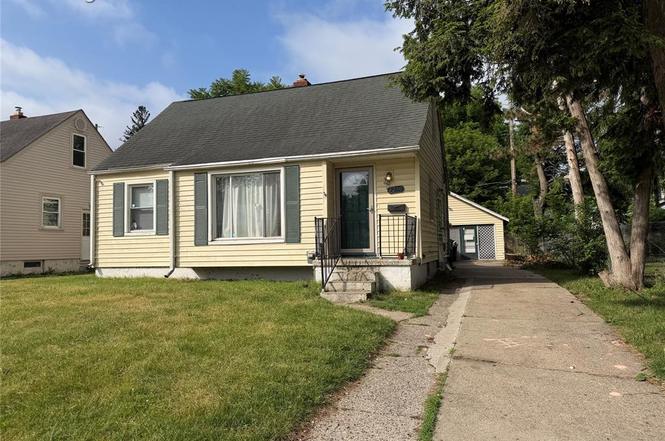
4230 Custer Ave · Flint, MI
Flood risk 1/10 · Minimal
- FEMA flood zone
- X (unshaded)
- Chance of flooding over 30 yrs
- 0.0%
- Est. flood insurance / yr
- $507 – $1,088
Fire risk 1/10 · Minimal
- Est. fire insurance / yr
- $784 – $1,456
Heat risk 2/10 · Minimal
- Hot days now (above 97°F)
- 7 days/yr
- Hot days in 30 yrs
- 15 days/yr
Wind risk 2/10 · Minimal
- Chance of severe wind over 30 yrs
- —
Air-quality risk 3/10 · Minor
- Unhealthy air days now
- 3 days/yr
- Unhealthy air days in 30 yrs
- 4 days/yr
Risk factors via First Street. Map © Google.
Why this score? — see what drove the B grade
The composite is a weighted blend of 9 inputs, each scored 0–100. Each bar is that input's sub-score; the figure is the points it added to the 100-point composite (weight × sub-score).
- Cash flow +28.9/30.0
- ARV discount +15.0/15.0
- DSCR +10.0/10.0
- 1% rule +8.9/10.0
- Livability +3.7/5.0
- Condition / age +2.5/5.0
- Rent growth +2.2/5.0
- Schools +1.1/10.0
- Appreciation +0.0/10.0
$83,900
🖨 Deal sheet 📄 Offer letter ✓ Due diligence
Listing remarks MLS
Move right in and make yourself at home! Located on a quiet street near I-75, this charming 3-bedroom home offers a versatile loft bedroom, finished basement, and oversized garage with endless possibilities. Enjoy the privacy and convenience of a fenced backyard, perfect for pets, play, gardening, or relaxing outdoors. From cozy nights in to gathering with family and friends, you'll appreciate the space, flexibility, and comfort this home has to offer. Schedule your private tour today!
Key facts
- Finished basement
- Loft bedroom
- Fenced backyard
Tags
Property features AI
Finance
- Other: Subdivision: FARNAMWOOD; Cross streets: Atherton / S. Saginaw; Directions: Atherton Rd to Red Arrow Rd to Leta then to Custer
Exterior
- Parking: Detached 1-car garage
- Utilities: Public water; Public sewer
- Home design: Single-family residence; One and one-half story; Ground-level entry with steps; Vinyl siding
- Construction: Built with vinyl siding; Block foundation
- Exterior features: Fenced yard; Paved road access; Lot dimensions approximately 45 x 110 (0.11 acres)
Interior
- Kitchen: Dishwasher; Free-standing refrigerator
- Bathrooms: 1 full bathroom
- Heating & cooling: Forced air heating (natural gas); Central air conditioning
- Interior features: Dishwasher; Free-standing refrigerator; Partially finished basement; Basement present
Neighborhood map
What this means for you Summary
Snapshot
- This is a 3-bed/1.0-bath single-family listed at $84k.
Deal economics
- At list price, monthly cash flow is $285 ($3k/yr) — positive.
- The deal already cash-flows at list — no discount required.
- Meets the 1% rule at list price ($1k rent vs $84k).
Location & tenants
- Location reads 74/100 on livability (#196 in MI, #4,946 nationally) — a middle-class / working-renter tenant base. Strengths: commute A+, cost of living A+, housing A+; Watch: schools F, crime F, employment F.
- Flint School District (urban): math 7% / reading 13% proficiency, ranked #714 of 760 in MI (top 94%) — low school quality limits family demand, transient renter base, plan for 1-2y turnover; 83% free/reduced lunch — lower-income household profile, screen leases tightly.
- Market conditions: Rents soft (-1.0%/yr); 206 active listings in the ZIP; 12 comparable units currently listed for rent nearby; rentals leasing fast (median 14d on market — plan ~1-2 weeks tenant-placement turnaround); 419 units permitted in Genesee County in 2024 (68 in 5+ unit buildings).
- This rent runs 30% of the median local income ($47k/yr) — at the standard rent-burdened threshold; future hikes will face affordability resistance.
Forward outlook
- Local home prices are declining (-3.0%/yr); year-one equity from $580 of loan paydown is wiped out by about $3k of value loss. Plan a longer hold.
- Genesee County population projected at -27% by 2050 — secular population decline; favor cash flow + early exit over multi-decade hold.
Negotiation context
- Only 7 days on market — expect competitive offers; lowballing is unlikely to land.
- 9 sale attempts since 28y ago with the ask held roughly flat each time — persistent listings suggest the price (not the market) is what's stuck; bring a comps-based counter.
Risks & watch-outs
- Watch-outs: built in 1951 — expect roof / HVAC / electrical / plumbing capex.
Questions for the listing agent
- Built in 1951 — when were the roof, HVAC, electrical panel, plumbing, and water heater last replaced?
- Is there a deadline driving the sale (1031 exchange, divorce, estate, relocation)? That informs how much negotiation room exists.
- Schools are F-rated, which usually means shorter tenancies and higher turnover. Who's the typical renter profile here, and what's been the actual vacancy rate?
- Crime grade is F in this area — have there been break-ins, vandalism, or insurance claims at this property in the last 3 years? What carrier currently insures it and at what premium?
- What's the average days-on-market for RENTAL listings here right now (not sales)? A rising rental-DOM trend means longer vacancies and softer asking-rent achievability than the comps imply.
- What's the recent tenant-quality profile in this submarket — average credit score on applications, eviction rate, late-payment / NSF rate, and stable-employment percentage? A property-management company in the area should have these aggregated.
- How much new for-sale + rental construction is in the pipeline within 1–3 miles? Heavy new supply typically softens prices + rents 12–24 months out; constrained supply supports both.
Investment metrics
- 1% rule
- 1.39% ✓
- Cap rate
- 10.37%
- Cash-on-cash
- 14.56%
- DSCR
- 1.65
- GRM
- 6.0
CMA / ARV
- ARV (on-the-fly)
- $102,114
- Comps found
- 12
Show comp detail 12 sales within ~0.75 mi
| Address | Dist | Beds/Ba | Sqft | Sold | Price | $/sf | Match |
|---|---|---|---|---|---|---|---|
| 352 Buckingham Ave | 0.26mi | 3/1.0 | 1,055 (-4%) | 0mo | $98,500 | $93 | 81 |
| 802 McKeighan Ave | 0.37mi | 3/1.0 | 1,056 (-4%) | 3mo | $95,900 | $91 | 74 |
| 4133 Custer Ave | 0.07mi | 2/1.5 (-1) | 1,192 (+9%) | 3mo | $114,000 | $96 | 73 |
| 326 Burroughs Ave | 0.22mi | 2/1.0 (-1) | 1,008 (-8%) | 2mo | $47,500 | $47 | 69 |
| 723 Mckeighan Ave | 0.35mi | 2/1.0 (-1) | 1,160 (+6%) | 4mo | $29,900 | $26 | 65 |
| 1030 Mckeighan Ave | 0.52mi | 3/1.5 | 1,049 (-4%) | 2mo | $50,000 | $48 | 64 |
| 3508 Fern Ave | 0.68mi | 3/1.0 | 1,060 (-4%) | 0mo | $132,000 | $125 | 62 |
| 630 Buckingham Ave Ave | 0.32mi | 3/1.0 | 936 (-15%) | 1mo | $89,999 | $96 | 60 |
| 4424 Cheyenne Ave | 0.54mi | 3/1.0 | 1,212 (+10%) | 1mo | $76,000 | $63 | 57 |
| 601 Buckingham Ave | 0.29mi | 2/1.0 (-1) | 942 (-14%) | 9mo | $45,000 | $48 | 51 |
| 1465 Norton St | 0.59mi | 3/1.5 | 1,260 (+15%) | 5mo | $119,999 | $95 | 42 |
| 3491 Laurel Ave | 0.69mi | 3/2.0 | 1,200 (+9%) | 10mo | $160,000 | $133 | 40 |
Match score weights: distance 35% · size 25% · config 20% · recency 20%. Top-matched comps best support the ARV.
Projected returns pro-forma
-3.0% appreciation · 0.0% rent growth · sell at horizon
- IRR
- 1.4%
- Equity multiple
- 1.05×
- Total profit
- $1,199
- Equity at exit
- $12,510
- IRR
- 7.5%
- Equity multiple
- 1.49×
- Total profit
- $11,434
- Equity at exit
- $7,254
Cash invested: $23,492 (down + closing). Projections, not guarantees.
Landlord ↔ Tenant lean methodology
- Overall (STATE)
- 62 Landlord-Friendly
- State Michigan
- 62 Landlord-Friendly · EVEN
- County
- — inherits STATE
- City
- — inherits STATE
ZIP-level market 48507
- Rents YoY
- -1.0%
- Active inventory
- 206
- Price-to-rent
- 6.0×
Monthly cashflow live
- Estimated rent
- $1,166 high interval (Pro) →
- Mortgage (P&I)
- −$440
- Tax from tax record
- −$161 /mo · $1,932/yr
- Insurance
- −$35
- HOA
- −$0
- Vacancy / Maint / Mgmt
- −$245
- Net cashflow
- $285
Break-even live
UW: 25.0% down · 7.5% · 30yr · 1.5% tax · 5.0% vac · 8.0% maint · 8.0% mgmt
Financing live
Cash to close
- Down payment
- $20,975
- Closing costs
- $2,517
- Reserves months
- —
- Total cash needed
- —
Loan-product check · same deal, 3 products live
Conventional
25% down · 7.5% · 30yr
- Down + closing
- —
- Monthly P&I
- —
- Monthly cashflow
- —
- DSCR
- —
- Eligible?
- —
Personal DTI + credit; lowest rate.
DSCR
20% down · 8.5% · 30yr
- Down + closing
- —
- Monthly P&I
- —
- Monthly cashflow
- —
- DSCR
- —
- Eligible?
- —
No personal income docs; deal must DSCR.
Hard money
10% down · 12.0% · 12mo
- Down + closing
- —
- Monthly P&I
- —
- Monthly cashflow
- —
- DSCR
- —
- Eligible?
- —
Short-term bridge; refi at stabilization.
Rent comps 12 comps
| Address | Beds | Baths | Sqft | Rent | $/sqft | DOM | Units | Dist |
|---|---|---|---|---|---|---|---|---|
| 4411 Red Arrow Rd Flint, MI | 3.0 | 1.5 | 1200 | $1,400 | $1.17 | 13d | 1 | 0.08mi |
| 4428 Pengelly Rd Flint, MI | 4.0 | 2.0 | 1275 | $900 | $0.71 | 43d | 1 | 0.16mi |
| 3291 Glengary St Burton, MI | 2.0 | 1.0 | 972 | $1,075 | $1.11 | 43d | 1 | 0.35mi |
| 805 E Hemphill Rd Flint, MI | 3.0 | 1.5 | 1200 | $1,000 | $0.83 | 13d | 1 | 0.39mi |
| 1034 McKeighan Ave Flint, MI | 3.0 | 1.0 | 1040 | $1,250 | $1.20 | 21d | 1 | 0.49mi |
| 4509 Cheyenne Ave Flint, MI | 3.0 | 1.5 | 1200 | $1,400 | $1.17 | 13d | 1 | 0.56mi |
| 2266 Donovan St Burton, MI | 2.0 | 1.0 | 700 | $800 | $1.14 | 13d | 1 | 0.58mi |
| 813 Alvord Ave Flint, MI | 2.0 | 1.0 | 724 | $850 | $1.17 | 13d | 1 | 1.15mi |
| 132 Pine Blf Flint, MI | 3.0 | 2.0 | 960 | $953 | $0.99 | 43d | 1 | 1.17mi |
| 4400 Kings Ln Burton, MI | 1.0–2.0 | 1.0–2.0 | 666 | $960 | $1.44 | 13d | 19 | 1.22mi |
| 410 Lippincott Blvd Flint, MI | 2.0 | 1.0 | 800 | $695 | $0.87 | 13d | 1 | 1.31mi |
| 912 Waldman Ave Flint, MI | 3.0 | 2.0 | 1223 | $675 | $0.55 | 13d | 1 | 1.32mi |
Listing history 8 events
-
2026-06-18days on market $83,900 Active 7 DOM
-
2026-06-17days on market $83,900 Active 6 DOM
-
2026-06-16days on market $83,900 Active 5 DOM
-
2026-06-15remarks 695-char remark
-
2026-06-15days on market $83,900 Active 4 DOM
-
2026-06-14days on market $83,900 Active 2 DOM
-
2026-06-13remarks 490-char remark
-
2026-06-13$83,900 Active 1 DOM
ⓘ Source: listings_history table (triggers on properties + properties_extension) + one-shot
backfill from property_details.listing_events for pre-trigger history.
Tax reassessment forecast MI · Partial reset (capped growth)
- Current annual tax
- $1,932 · $161/mo
- Projected year-2 tax
- $1,932 · $161/mo
- Expected delta
- $0/yr ($0/mo · 0.0%)
ⓘ Screening estimate from a state-policy table — verify with the county assessor before closing.
Climate risk First Street
- Flood 1/10 Low FEMA zone X (unshaded) · 0% chance over 30 yrs
- Wildfire 1/10 Low
- Heat 2/10 Low 7 d/yr ≥97°F today · 15 d/yr by 30 yrs out
- Wind 2/10 Low
- Air quality 3/10 Moderate 3 unhealthy d/yr today · 4 by 30 yrs out
Nearby sold comps map
Loading sold comps map…
Walkable amenities ~0.75 mi
Loading nearby amenities…
Taxation est. · year 1
- Rental income
- $13,991
- − Mortgage interest
- −$4,700
- − Property taxes
- −$1,932
- − Insurance
- −$420
- − Repairs & maintenance
- −$1,119
- − Management
- −$1,119
- − Depreciation
- −$2,441
- Taxable income
- $2,260
- Est. tax owed @ 24.0%
- −$542
- After-tax cash flow
- $2,879/yr
For passive investors: Depreciation is non-cash, so a rental often shows a tax loss while cash-flowing — sheltering income. Rental losses are passive: they offset passive income freely, and up to $25,000/yr can offset ordinary (W-2) income if you actively participate and your MAGI is under $100k (phasing out to $0 by $150k); unused losses carry forward. On sale, claimed depreciation is recaptured at up to 25%, and gains may owe capital-gains tax (a 1031 exchange can defer both). Figures are a year-1 estimate at your 24.0% rate — not tax advice; consult a CPA.
Schools (NCES district)
- District
- Flint School District
- NCES district ID
- 2614520
- Math proficiency
- 7% ▬ 0.00%
- Reading proficiency
- 13% ▲ 3.00%
- Median HH income
- $25,954
- Composite
- 10.97/100
- National rank
- #14642
- State rank
- #714 of 760 in MI
Livability — Flint
- Score
- 74/100
- State rank
- #196
- US rank
- #4946
Category grades
Schools grade is shown separately in the Schools card above.
Census & demographics
- Census place
- Flint, MI
- County
- Genesee County · 221,329 people
- City population
- 93,814
- Metro
- Flint, MI
- Population (ZIP)
- 28,723
- Household income
- $46,554
- Rent vs Own
- Severe rent burden
- 1534.0
Population outlook (Genesee County) Hauer SSP2
- Today (2025)
- 381,312 people
- By 2030
- 362,731 · -4.9%
- By 2040
- 321,550 · -15.7%
- By 2050
- 279,212 · -26.8%
- By 2075
- 193,336 · -49.3%
- By 2100
- 128,118 · -66.4%
Race, ethnicity, and origin ACS 2023
- Neighborhood character
- Diverse neighborhood (Simpson 0.57)
- Race & ethnicity
- White 59% Black 28% Two or more races 10% Hispanic / Latino 5%
- Common ancestry
- Lithuanian 4% Romanian 3% Slovak 2%
- Foreign-born
- 1% · Canada
- Languages at home
- 97% English-only · Spanish 1% Other Asian/Pacific 1%
Political lean MEDSL · Genesee
- 2024 margin
- Toss-up / Even · D 51.4% · R 47.2% · Other 1.4%
- 2008→2024 swing
- -28.3pp toward R · 2008: 32.5pp · 2024: 4.2pp
- All cycles
- 2024: D+4.2 2020: D+9.3 2016: D+9.5 2012: D+28.2 2008: D+32.5
Not yet ingested
- Civics
- —
Market trends
- HPI YoY
- ▼ -154.90%
- Current HPI
- 132.3632
- Rent YoY
- ▼ -1.04%
- Metro
- Flint, MI
- State GDP YoY
- ▲ 1.37%
- F500 in state
- 28
Industry mix (Fortune 500 HQ in MI)
| Industry | F500 HQs | Revenue |
|---|---|---|
| Automotive Parts | 3 | $48B |
|
||
| Automotive | 2 | $372B |
|
||
| Chemicals | 1 | $45B |
|
||
| Automotive Retail | 1 | $29B |
|
||
| Healthcare / Medical Devices | 1 | $23B |
|
||
| Automotive Technology | 1 | $20B |
|
||
Price history
+47.5% since first listed23 events — show timeline
- 2026-06-12 Listed $83,900 MiRealSource-MiMLS
- 2026-06-12 Listed $83,900 REALCOMP
- 2026-06-10 Coming Soon $83,900 MiRealSource-MiMLS
- 2024-08-13 Sold (Public Records) $74,900 Public Records
- 2023-11-13 Pending — REALCOMP
- 2023-11-13 Sold (MLS) $74,900 MiRealSource-MiMLS
- 2023-11-13 Sold (MLS) $74,900 REALCOMP
- 2023-09-28 Contingent — MiRealSource-MiMLS
- 2023-09-28 Contingent — REALCOMP
- 2023-09-21 Listed $74,900 MiRealSource-MiMLS
- 2023-09-21 Listed $74,900 REALCOMP
- 2012-06-20 Sold (MLS) $17,000 REALCOMP
- 2012-06-20 Sold (MLS) $17,000 MiRealSource-MiMLS
- 2012-05-19 Listing Removed — MiRealSource-MiMLS
- 2011-12-15 Listed $19,500 REALCOMP
- 2011-12-15 Listed $19,500 MiRealSource-MiMLS
- 2009-03-20 Sold (MLS) $13,000 MiRealSource-MiMLS
- 2009-03-20 Sold (MLS) $13,000 REALCOMP
- 2009-03-05 Listing Removed — MiRealSource-MiMLS
- 2009-02-27 Listed $12,900 MiRealSource-MiMLS
- 2009-02-27 Listed $12,900 REALCOMP
- 1998-07-08 Sold (MLS) $52,250 MiRealSource-MiMLS
- 1998-05-08 Listed $56,900 MiRealSource-MiMLS
Property tax history
+8.7%/yrLatest (2025): $1,932 · +30.1% YoY. Source: county tax records.
Cash-flow waterfall
monthlySold comps — $/sqft
last 12 mo · ≤1 miLoading sold comps…