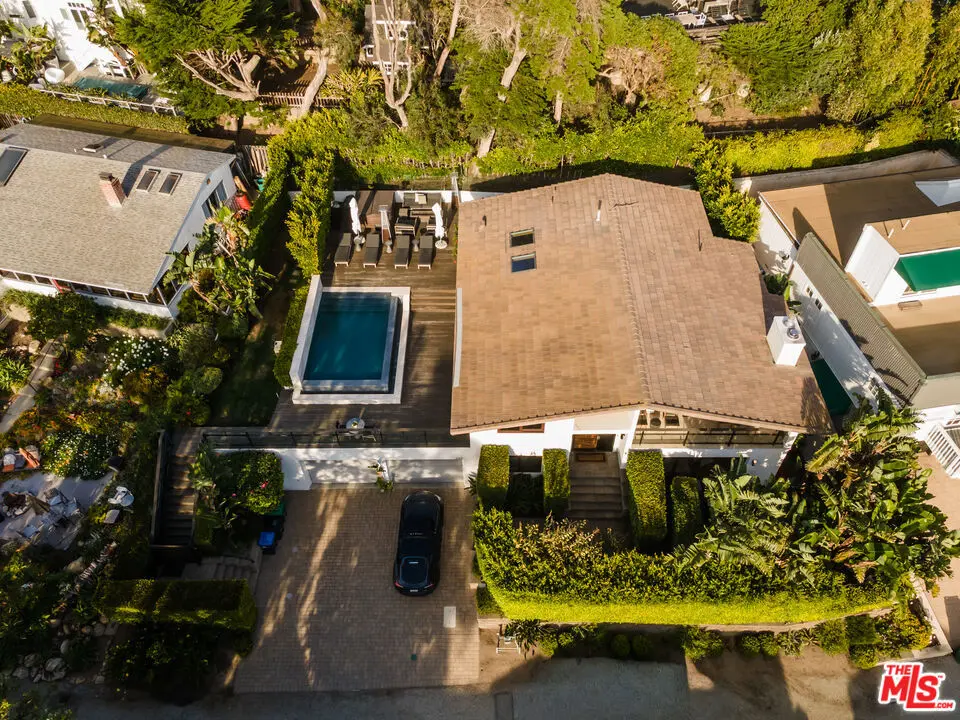
31851 Sea Level Dr · Malibu, CA
Flood risk 7/10 · Major
- FEMA flood zone
- X (unshaded)
- Chance of flooding over 30 yrs
- 0.76%
- Est. flood insurance / yr
- $507 – $1,088
Fire risk 4/10 · Minor
- Est. fire insurance / yr
- $659 – $1,223
Heat risk 3/10 · Minor
- Hot days now (above 85°F)
- 7 days/yr
- Hot days in 30 yrs
- 19 days/yr
Wind risk 1/10 · Minimal
- Chance of severe wind over 30 yrs
- —
Air-quality risk 4/10 · Minor
- Unhealthy air days now
- 4 days/yr
- Unhealthy air days in 30 yrs
- 4 days/yr
Risk factors via First Street. Map © Google.
Why this score? — see what drove the B- grade
The composite is a weighted blend of 9 inputs, each scored 0–100. Each bar is that input's sub-score; the figure is the points it added to the 100-point composite (weight × sub-score).
- Cash flow +26.2/30.0
- DSCR +8.9/10.0
- ARV discount +7.5/15.0
- 1% rule +7.0/10.0
- Schools +6.2/10.0
- Appreciation +5.3/10.0
- Livability +2.7/5.0
- Condition / age +2.5/5.0
- Rent growth +1.7/5.0
$950,000
🖨 Deal sheet 📄 Offer letter ✓ Due diligence
Listing remarks MLS
New Co-Ownership Opportunity: Own one-eighth of this professionally managed, turnkey coastal retreat. This property engages every sense, from its striking modern architecture to the refined textures and finishes within, all complemented by the sound and scent of nearby ocean breezes. Just steps from the beach, the home offers ocean views, an infinity pool, and seamless indoor-outdoor living throughout. The living room features a gas fireplace, beamed ceilings, and sliding glass pocket doors that open wide to frame the coastal views. The gourmet kitchen is equipped with high-end appliances, a generous island with breakfast bar, and direct access to a grilling deck. In the formal dining room, glass doors lead to an inviting outdoor setting complete with pool, spa, and fire pit. The primary suite is a private sanctuary with its own fireplace, walk-in closet, and pocket doors opening to a tranquil garden. The spa-like en suite bath includes a dual-sink vanity and steam shower. Downstairs, enjoy a state-of-the-art home theater with projection screen, along with two guest suites, each with en suite baths, and a versatile office or flex space. Offered fully furnished and professionally designed, this home delivers effortless luxury and turnkey ownership in an exceptional beachside setting.
Key facts
- 7,389 sq ft lot
- 2 parking spots
- Pool
Neighborhood map
What this means for you Summary
Snapshot
- This is a 3-bed/4.0-bath single-family listed at $950k.
Deal economics
- At list price, monthly cash flow is $2k ($28k/yr) — positive.
- The deal already cash-flows at list — no discount required.
- Meets the 1% rule at list price ($11k rent vs $950k).
- Recommended offer: $893k (6.0% below list) — sets the bar for market timing.
- Cap rate 9.4% vs local median 0.7% in Malibu — top-decile yield for the area; either an underpriced asset or a hidden risk that comps aren't pricing in. Stress-test before assuming the spread holds.
Location & tenants
- Location reads 53/100 on livability (#979 in CA) — a working-class tenant base; expect higher turnover. Strengths: employment A+, schools B; Watch: housing C-, crime F, amenities F.
- Santa Monica-Malibu Unified (urban): math 61% / reading 74% proficiency, ranked #123 of 1,400 in CA (top 9%) — acceptable for families but not a draw, mixed tenant base, ~2y average lease.
- Market conditions: Rents falling (-3.4%/yr); 627 active listings in the ZIP; 9 comparable units currently listed for rent nearby; rentals lingering (median 44d on market — plan ~5-8 weeks vacancy on turnover, expect pricing pressure); 67% of comp listings sitting > 30 days — soft ceiling on asking rent; high-income renter base; 19,697 units permitted in Los Angeles County in 2024 (9,426 in 5+ unit buildings).
- At $11,380/mo this rent would consume 69% of the median local household income ($197k/yr) (locally 420% of renters already pay >50% of income on rent) — very limited rent-growth headroom before tenants either downsize or default.
Forward outlook
- In year one you build about $12k of equity ($7k loan paydown + $6k appreciation (0.6% local appreciation)).
- Los Angeles County population projected at +9% by 2050 — modest demand growth; plan on rents tracking national, not racing it.
- At projected returns (0.6% appreciation + 0.0% rent growth), your $266k cash investment doubles in ~7 years — after that, you're playing with house money.
- By year 5, paydown + projected appreciation supports a ~$61k cash-out refi (75% LTV) — recoverable capital for the next deal without selling this one.
Negotiation context
- It's been on market 80 days — a 6% lower offer ($893k) is reasonable based on typical stale-listing flexibility.
- 17 sale attempts since 21y ago with the ask held roughly flat each time — persistent listings suggest the price (not the market) is what's stuck; bring a comps-based counter.
Risks & watch-outs
- Watch-outs: flood insurance adds $66/mo.
- Climate carrying-cost: major flood risk — expect insurance premiums to compound above CPI over the hold.
Questions for the listing agent
- It's been on market 80 days. Have you received any prior offers? Is the seller open to a 6% concession, seller financing, or rate buy-down credit?
- Built in 1974 — when were the roof, HVAC, electrical panel, plumbing, and water heater last replaced?
- What's the actual annual flood-insurance premium (NFIP or private), and is the property in a SFHA with mandatory coverage?
- Why hasn't it sold? Are there any deal-killer items the seller is aware of (foundation, flood, title, zoning, code violations)?
- Is there a deadline driving the sale (1031 exchange, divorce, estate, relocation)? That informs how much negotiation room exists.
- Schools are B-rated — typically a magnet for longer-tenancy family renters. What's the average tenant stay here, and is there a school-zone premium baked into asking?
- Crime grade is F in this area — have there been break-ins, vandalism, or insurance claims at this property in the last 3 years? What carrier currently insures it and at what premium?
- What's the average days-on-market for RENTAL listings here right now (not sales)? A rising rental-DOM trend means longer vacancies and softer asking-rent achievability than the comps imply.
- What's the recent tenant-quality profile in this submarket — average credit score on applications, eviction rate, late-payment / NSF rate, and stable-employment percentage? A property-management company in the area should have these aggregated.
- How much new for-sale + rental construction is in the pipeline within 1–3 miles? Heavy new supply typically softens prices + rents 12–24 months out; constrained supply supports both.
Investment metrics
- 1% rule
- 1.20% ✓
- Cap rate
- 9.36%
- Cash-on-cash
- 10.94%
- DSCR
- 1.49
- GRM
- 7.0
CMA / ARV
- ARV (median comp)
- $4,807,681
- List price
- $950,000
- Delta
- -80.24%
- Verdict
- UNDERPRICED
- Comps
- 10 within 1.0 mi
Show comp detail 2 sales within ~0.75 mi
| Address | Dist | Beds/Ba | Sqft | Sold | Price | $/sf | Match |
|---|---|---|---|---|---|---|---|
| 31974 Pacific Coast Hwy | 0.12mi | 4/5.0 (+1) | 2,861 (-2%) | 22mo | $7,350,000 | $2,569 | 65 |
| 31666 Broad Beach Rd | 0.25mi | 4/5.0 (+1) | 2,902 (-0%) | 18mo | $8,825,000 | $3,041 | 64 |
Match score weights: distance 35% · size 25% · config 20% · recency 20%. Top-matched comps best support the ARV.
Projected returns pro-forma
0.62% appreciation · 0.0% rent growth · sell at horizon
- IRR
- 9.1%
- Equity multiple
- 1.44×
- Total profit
- $117,240
- Equity at exit
- $305,566
- IRR
- 11.4%
- Equity multiple
- 2.22×
- Total profit
- $324,562
- Equity at exit
- $391,946
Cash invested: $266,000 (down + closing). Projections, not guarantees.
Landlord ↔ Tenant lean methodology
- Overall (STATE)
- 18 Strongly Tenant-Friendly
- State California
- 18 Strongly Tenant-Friendly · D+13
- County
- — inherits STATE
- City
- — inherits STATE
ZIP-level market 90265
- Home prices YoY
- 0.1%
- Rents YoY
- -3.4%
- Active inventory
- 627
- Price-to-rent
- 7.0×
Monthly cashflow live
- Estimated rent
- $11,380 medium interval (Pro) →
- Mortgage (P&I)
- −$4,982
- Tax est. 1.5%
- −$1,188 /mo · $14,250/yr
- Insurance
- −$396
- Flood insurance flood zone
- −$66 /mo · $798/yr
- HOA
- −$0
- Vacancy / Maint / Mgmt
- −$2,390
- Net cashflow
- $2,359
Break-even live
UW: 25.0% down · 7.5% · 30yr · 1.5% tax · 5.0% vac · 8.0% maint · 8.0% mgmt
Financing live
Cash to close
- Down payment
- $237,500
- Closing costs
- $28,500
- Reserves months
- —
- Total cash needed
- —
Loan-product check · same deal, 3 products live
Conventional
25% down · 7.5% · 30yr
- Down + closing
- —
- Monthly P&I
- —
- Monthly cashflow
- —
- DSCR
- —
- Eligible?
- —
Personal DTI + credit; lowest rate.
DSCR
20% down · 8.5% · 30yr
- Down + closing
- —
- Monthly P&I
- —
- Monthly cashflow
- —
- DSCR
- —
- Eligible?
- —
No personal income docs; deal must DSCR.
Hard money
10% down · 12.0% · 12mo
- Down + closing
- —
- Monthly P&I
- —
- Monthly cashflow
- —
- DSCR
- —
- Eligible?
- —
Short-term bridge; refi at stabilization.
Rent comps 9 comps
| Address | Beds | Baths | Sqft | Rent | $/sqft | DOM | Units | Dist |
|---|---|---|---|---|---|---|---|---|
| 31844 Seafield Dr Malibu, CA | 3.0 | 2.5 | 3425 | $16,500 | $4.82 | 43d | 1 | 0.01mi |
| 31833 Sea Level Dr Malibu, CA | 3.0 | 3.0 | 2200 | $30,000 | $13.64 | 18d | 1 | 0.05mi |
| 31952 Pacific Coast Hwy Malibu, CA | 4.0 | 2.5 | 2413 | $45,000 | $18.65 | 43d | 1 | 0.13mi |
| 31648 Broad Beach Rd Malibu, CA | 4.0 | 4.0 | 2922 | $21,500 | $7.36 | 43d | 1 | 0.28mi |
| 31626 Sea Level Dr Malibu, CA | 4.0 | 5.0 | 3501 | $25,000 | $7.14 | 43d | 1 | 0.40mi |
| 31518 Broad Beach Rd Malibu, CA | 3.0 | 3.0 | 2368 | $18,000 | $7.60 | 24d | 1 | 0.47mi |
| 31500 Victoria Point Rd Malibu, CA | 4.0 | 4.5 | 3284 | $35,000 | $10.66 | 43d | 1 | 0.55mi |
| 4244 Avenida de la Encinal Malibu, CA | 3.0 | 3.0 | 3100 | $10,000 | $3.23 | 16d | 1 | 1.10mi |
| 6326 Trancas Canyon Rd Malibu, CA | 4.0 | 5.0 | 2791 | $22,500 | $8.06 | 43d | 1 | 1.48mi |
Listing history 50 events
-
2026-06-18days on market $950,000 Active 80 DOM
-
2026-06-17days on market $950,000 Active 79 DOM
-
2026-06-16days on market $950,000 Active 78 DOM
-
2026-06-15price $950,000 Active 77 DOM
-
2026-06-15days on market $999,000 Active 77 DOM
-
2026-06-13days on market $999,000 Active 75 DOM
-
2026-06-13days on market $999,000 Active 74 DOM
-
2026-06-09days on market $999,000 Active 71 DOM
-
2026-06-08days on market $999,000 Active 70 DOM
-
2026-06-07days on market $999,000 Active 69 DOM
-
2026-06-04days on market $999,000 Active 66 DOM
-
2026-06-03days on market $999,000 Active 65 DOM
-
2026-06-02days on market $999,000 Active 64 DOM
-
2026-06-01days on market $999,000 Active 63 DOM
-
2026-05-31days on market $999,000 Active 62 DOM
-
2026-03-30$999,000 Active 1303-char remark
Show marketing remark (1303 chars)
New Co-Ownership Opportunity: Own one-eighth of this professionally managed, turnkey coastal retreat. This property engages every sense, from its striking modern architecture to the refined textures and finishes within, all complemented by the sound and scent of nearby ocean breezes. Just steps from the beach, the home offers ocean views, an infinity pool, and seamless indoor-outdoor living throughout. The living room features a gas fireplace, beamed ceilings, and sliding glass pocket doors that open wide to frame the coastal views. The gourmet kitchen is equipped with high-end appliances, a generous island with breakfast bar, and direct access to a grilling deck. In the formal dining room, glass doors lead to an inviting outdoor setting complete with pool, spa, and fire pit. The primary suite is a private sanctuary with its own fireplace, walk-in closet, and pocket doors opening to a tranquil garden. The spa-like en suite bath includes a dual-sink vanity and steam shower. Downstairs, enjoy a state-of-the-art home theater with projection screen, along with two guest suites, each with en suite baths, and a versatile office or flex space. Offered fully furnished and professionally designed, this home delivers effortless luxury and turnkey ownership in an exceptional beachside setting.
-
2024-04-30price
-
2023-11-27Active
-
2023-06-20status Pending
-
2023-05-16Active
-
2023-01-24status Active
-
2023-01-24price
-
2022-05-26Active
-
2022-05-24status Pending
-
2022-05-23soldstatus $7,475,000 Sold
-
2022-05-23soldstatus $7,475,000
-
2022-04-28historical Backup Offers Accepted
-
2022-04-14$7,500,000
-
2022-03-23$7,500,000 Active
-
2018-06-19soldstatus $5,050,000 Closed
-
2018-06-19soldstatus $5,050,000
-
2018-06-14status Pending
-
2018-06-14status Active
-
2018-06-14status Pending
-
2018-05-22status Backup Offers Accepted
-
2018-03-23$5,250,000 Active
-
2016-10-11status Backup Offers Accepted
-
2016-10-11Active
-
2016-10-11historical Withdrawn
-
2016-09-08status Backup Offers Accepted
-
2016-09-08historical Withdrawn
-
2016-06-23Active
-
2016-03-13historical Expired
-
2015-11-03price
-
2015-07-27price
-
2015-07-20price
-
2015-06-23price
-
2015-06-08price
-
2015-05-22price
-
2015-04-24Active
ⓘ Source: listings_history table (triggers on properties + properties_extension) + one-shot
backfill from property_details.listing_events for pre-trigger history.
Climate risk First Street
- Flood 7/10 Severe FEMA zone X (unshaded) · 76% chance over 30 yrs
- Wildfire 4/10 Moderate
- Heat 3/10 Moderate 7 d/yr ≥85°F today · 19 d/yr by 30 yrs out
- Wind 1/10 Low
- Air quality 4/10 Moderate 4 unhealthy d/yr today · 4 by 30 yrs out
Nearby sold comps map
Loading sold comps map…
Walkable amenities ~0.75 mi
Loading nearby amenities…
Taxation est. · year 1
- Rental income
- $136,565
- − Mortgage interest
- −$53,215
- − Property taxes
- −$14,250
- − Insurance
- −$5,548
- − Repairs & maintenance
- −$10,925
- − Management
- −$10,925
- − Depreciation
- −$27,636
- Taxable income
- $14,066
- Est. tax owed @ 24.0%
- −$3,376
- After-tax cash flow
- $24,930/yr
For passive investors: Depreciation is non-cash, so a rental often shows a tax loss while cash-flowing — sheltering income. Rental losses are passive: they offset passive income freely, and up to $25,000/yr can offset ordinary (W-2) income if you actively participate and your MAGI is under $100k (phasing out to $0 by $150k); unused losses carry forward. On sale, claimed depreciation is recaptured at up to 25%, and gains may owe capital-gains tax (a 1031 exchange can defer both). Figures are a year-1 estimate at your 24.0% rate — not tax advice; consult a CPA.
Schools (NCES district)
- District
- Santa Monica-Malibu Unified
- NCES district ID
- 0635700
- Math proficiency
- 61% ▬ 0.00%
- Reading proficiency
- 74% ▬ 0.00%
- Median HH income
- $81,489
- Composite
- 61.58/100
- National rank
- #1535
- State rank
- #123 of 1400 in CA
Livability — Malibu
- Score
- 53/100
- State rank
- #979
- US rank
- #24630
Category grades
Schools grade is shown separately in the Schools card above.
Census & demographics
- Census place
- Malibu, CA
- County
- Los Angeles County · 9,444,647 people
- City population
- 15,918
- Metro
- Los Angeles-Long Beach-Anaheim, CA
- Population (ZIP)
- 15,918
- Household income
- $196,742
- Rent vs Own
- Severe rent burden
- 420.0
Population outlook (Los Angeles County) Hauer SSP2
- Today (2025)
- 10,940,515 people
- By 2030
- 11,256,481 · +2.9%
- By 2040
- 11,729,929 · +7.2%
- By 2050
- 11,948,407 · +9.2%
- By 2075
- 11,818,114 · +8.0%
- By 2100
- 10,842,928 · -0.9%
Race, ethnicity, and origin ACS 2023
- Neighborhood character
- Predominantly White (77%)
- Race & ethnicity
- White 77% Two or more races 10% Hispanic / Latino 9% Asian 5% Black 1%
- Hispanic origin (detail)
- Mexican 6%
- Common ancestry
- Italian 8% Scotch-Irish 3% Romanian 3%
- Foreign-born
- 16% · Canada, South Korea, China
- Languages at home
- 82% English-only · Spanish 6% Other Indo-European 6% French/Haitian/Cajun 2%
Political lean MEDSL · Los Angeles
- 2024 margin
- Solid D (+32.9) · D 64.8% · R 31.9% · Other 3.3%
- 2008→2024 swing
- -7.4pp toward R · 2008: 40.4pp · 2024: 32.9pp
- All cycles
- 2024: D+32.9 2020: D+44.2 2016: D+48.0 2012: D+40.0 2008: D+40.4
Not yet ingested
- Civics
- —
Market trends
- HPI YoY
- ▲ 0.62%
- Current HPI
- 498.5117
- Rent YoY
- ▼ -3.39%
- Metro
- Los Angeles-Long Beach-Anaheim, CA
- State GDP YoY
- ▲ 3.21%
- F500 in state
- 116
Industry mix (Fortune 500 HQ in CA)
| Industry | F500 HQs | Revenue |
|---|---|---|
| Technology | 27 | $1,492B |
|
||
| Financial Services | 3 | $174B |
|
||
| Retail | 3 | $44B |
|
||
| Insurance | 3 | $26B |
|
||
| Media / Entertainment | 2 | $115B |
|
||
| Pharmaceuticals / Biotech | 2 | $62B |
|
||
Price history
+640.0% since first listed50 events — show timeline
- 2026-03-30 Listed $999,000 TheMLS
- 2024-04-30 Price Changed — TheMLS
- 2023-11-27 Listed — TheMLS
- 2023-06-20 Pending — TheMLS
- 2023-05-16 Listed — TheMLS
- 2023-01-24 Relisted — TheMLS
- 2023-01-24 Price Changed — TheMLS
- 2022-05-26 Listed — TheMLS
- 2022-05-24 Pending — TheMLS
- 2022-05-23 Sold (Public Records) $7,475,000 Public Records
- 2022-05-23 Sold (MLS) $7,475,000 TheMLS
- 2022-04-28 Contingent — TheMLS
- 2022-04-14 Listed $7,500,000 SDMLS
- 2022-03-23 Listed $7,500,000 TheMLS
- 2018-06-19 Sold (Public Records) $5,050,000 Public Records
- 2018-06-19 Sold (MLS) $5,050,000 TheMLS
- 2018-06-14 Pending — TheMLS
- 2018-06-14 Relisted — TheMLS
- 2018-06-14 Pending — TheMLS
- 2018-05-22 Pending — TheMLS
- 2018-03-23 Listed $5,250,000 TheMLS
- 2016-10-11 Pending — TheMLS
- 2016-10-11 Listed — TheMLS
- 2016-10-11 Delisted — TheMLS
- 2016-09-08 Pending — TheMLS
- 2016-09-08 Delisted — TheMLS
- 2016-06-23 Listed — TheMLS
- 2016-03-13 Delisted — TheMLS
- 2015-11-03 Price Changed — TheMLS
- 2015-07-27 Price Changed — TheMLS
- 2015-07-20 Price Changed — TheMLS
- 2015-06-23 Price Changed — TheMLS
- 2015-06-08 Price Changed — TheMLS
- 2015-05-22 Price Changed — TheMLS
- 2015-04-24 Listed — TheMLS
- 2013-11-20 Listing Removed — CRMLS
- 2013-08-29 Relisted — CRMLS
- 2013-08-29 Listing Removed — CRMLS
- 2013-08-27 Price Changed $4,899,000 CRMLS
- 2013-08-05 Price Changed $5,495,000 CRMLS
- 2013-08-03 Listed $5,950,000 CRMLS
- 2006-08-25 Sold (MLS) $2,900,000 TheMLS
- 2006-08-23 Sold (Public Records) $2,900,000 Public Records
- 2006-08-15 Delisted — TheMLS
- 2006-04-04 Listed $2,995,000 TheMLS
- 2005-12-10 Delisted — TheMLS
- 2005-11-17 Listed — TheMLS
- 2005-11-09 Delisted — TheMLS
- 2005-02-02 Listed — TheMLS
- 1977-01-03 Sold (Public Records) $135,000 Public Records
Property tax history
+7.5%/yrLatest (2025): $96,958 · +7.9% YoY. Source: county tax records.
Cash-flow waterfall
monthlySold comps — $/sqft
last 12 mo · ≤1 miLoading sold comps…