218 Apple Valley Dr · Princeton, TX
Flood risk 1/10 · Minimal
- FEMA flood zone
- X
- Chance of flooding over 30 yrs
- 0.0%
- Est. flood insurance / yr
- $435 – $905
Fire risk 2/10 · Minimal
- Est. fire insurance / yr
- $1,222 – $2,270
Heat risk 8/10 · Major
- Hot days now (above threshold)
- 8 days/yr
- Hot days in 30 yrs
- 27 days/yr
Wind risk No data
- Chance of severe wind over 30 yrs
- —
Air-quality risk 3/10 · Minor
- Unhealthy air days now
- 3 days/yr
- Unhealthy air days in 30 yrs
- 3 days/yr
Risk factors via First Street. Map © Google.
Why this score? — see what drove the B- grade
The composite is a weighted blend of 9 inputs, each scored 0–100. Each bar is that input's sub-score; the figure is the points it added to the 100-point composite (weight × sub-score).
- Cash flow +30.0/30.0
- 1% rule +10.0/10.0
- DSCR +10.0/10.0
- ARV discount +7.5/15.0
- Schools +4.2/10.0
- Livability +3.1/5.0
- Rent growth +2.2/5.0
- Condition / age +1.0/5.0
- Appreciation +0.0/10.0
$100,000
🖨 Deal sheet 📄 Offer letter ✓ Due diligence
Listing remarks
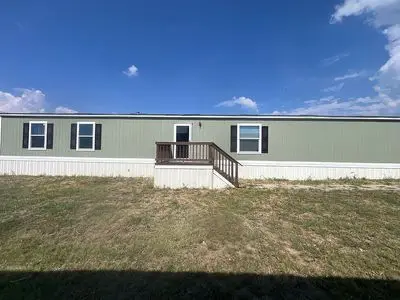
Brand new single wide manufactured home built by Clayton in 2022, 18& apos; X76& apos; . 3 beds, 2 baths. Situated in a quite small manufactured home community in Princeton, TX. Close to McKinney, Lucas, Allen, Wylie. 5 minutes to Lake Lavon. Brand new Clayton Home ready for you to see. Land lot is for rent, only home is for sale. Also if interested in an assumed mortgage is available through an application process, soft credit check, bank statements then a 15 year note picks up where we left off at a 12 year note. Come take a look. Comes with a 16x14 shed, a John Deere mower, all appliances.
Key facts
- Close to lake lavon
- All appliances
- 16x14 shed
Tags
Neighborhood map
What this means for you Summary
Snapshot
- This is a 3-bed/2.0-bath other listed at $100k. Condition is rated poor.
Deal economics
- At list price, monthly cash flow is $904 ($11k/yr) — positive.
- The deal already cash-flows at list — no discount required.
- Meets the 1% rule at list price ($2k rent vs $100k).
- Cap rate 17.1% vs local median 4.5% in Princeton — top-decile yield for the area; either an underpriced asset or a hidden risk that comps aren't pricing in. Stress-test before assuming the spread holds.
Location & tenants
- Location reads 62/100 on livability (#969 in TX) — a middle-class / working-renter tenant base. Strengths: employment A+, housing A+, cost of living A; Watch: schools C-, amenities F, commute F.
- Princeton ISD (suburban): math 51% / reading 47% proficiency, ranked #188 of 826 in TX (top 23%) — families likely to look elsewhere, expect single-tenant / working-renter base with shorter leases.
- Market conditions: Rents soft (-1.0%/yr); 1404 active listings in the ZIP; 40 comparable units currently listed for rent nearby; rentals at typical pace (median 21d on market — plan ~3-4 weeks tenant-placement turnaround); solid renter incomes; 19,194 units permitted in Collin County in 2024 (3,988 in 5+ unit buildings).
Forward outlook
- Local home prices are declining (-3.0%/yr); year-one equity from $691 of loan paydown is wiped out by about $3k of value loss. Plan a longer hold.
- Collin County population projected at +60% by 2050 — long-run rental-demand tailwind backs the buy-and-hold thesis.
- At projected returns (-3.0% appreciation + 0.0% rent growth), your $28k cash investment doubles in ~4 years — after that, you're playing with house money.
Negotiation context
- Only 12 days on market — expect competitive offers; lowballing is unlikely to land.
Risks & watch-outs
- Climate carrying-cost: extreme-heat days projected 8→27/yr by 2055 (HVAC capex compounding) — expect insurance premiums to compound above CPI over the hold.
Questions for the listing agent
- Have any recent inspections been done? Can we get a copy of the seller's disclosures and any deferred-maintenance estimates?
- Is there a deadline driving the sale (1031 exchange, divorce, estate, relocation)? That informs how much negotiation room exists.
- What's the average days-on-market for RENTAL listings here right now (not sales)? A rising rental-DOM trend means longer vacancies and softer asking-rent achievability than the comps imply.
- What's the recent tenant-quality profile in this submarket — average credit score on applications, eviction rate, late-payment / NSF rate, and stable-employment percentage? A property-management company in the area should have these aggregated.
- How much new for-sale + rental construction is in the pipeline within 1–3 miles? Heavy new supply typically softens prices + rents 12–24 months out; constrained supply supports both.
Investment metrics
- 1% rule
- 2.02% ✓
- Cap rate
- 17.14%
- Cash-on-cash
- 38.74%
- DSCR
- 2.72
- GRM
- 4.1
CMA / ARV
No comps found within radius.
Projected returns pro-forma
-3.0% appreciation · 0.0% rent growth · sell at horizon
- IRR
- 31.5%
- Equity multiple
- 2.27×
- Total profit
- $35,475
- Equity at exit
- $14,910
- IRR
- 36.9%
- Equity multiple
- 3.94×
- Total profit
- $82,273
- Equity at exit
- $8,646
Cash invested: $28,000 (down + closing). Projections, not guarantees.
Landlord ↔ Tenant lean methodology
- Overall (STATE)
- 87 Strongly Landlord-Friendly
- State Texas
- 87 Strongly Landlord-Friendly · R+5
- County
- — inherits STATE
- City
- — inherits STATE
ZIP-level market 75407
- Home prices YoY
- -30.3%
- Rents YoY
- -1.0%
- Active inventory
- 1404
- Price-to-rent
- 4.1×
Monthly cashflow live
- Estimated rent
- $2,019 high interval (Pro) →
- Mortgage (P&I)
- −$524
- Tax est. 1.5%
- −$125 /mo · $1,500/yr
- Insurance
- −$42
- HOA
- −$0
- Vacancy / Maint / Mgmt
- −$424
- Net cashflow
- $904
Break-even live
UW: 25.0% down · 7.5% · 30yr · 1.5% tax · 5.0% vac · 8.0% maint · 8.0% mgmt
Financing live
Cash to close
- Down payment
- $25,000
- Closing costs
- $3,000
- Reserves months
- —
- Total cash needed
- —
Loan-product check · same deal, 3 products live
Conventional
25% down · 7.5% · 30yr
- Down + closing
- —
- Monthly P&I
- —
- Monthly cashflow
- —
- DSCR
- —
- Eligible?
- —
Personal DTI + credit; lowest rate.
DSCR
20% down · 8.5% · 30yr
- Down + closing
- —
- Monthly P&I
- —
- Monthly cashflow
- —
- DSCR
- —
- Eligible?
- —
No personal income docs; deal must DSCR.
Hard money
10% down · 12.0% · 12mo
- Down + closing
- —
- Monthly P&I
- —
- Monthly cashflow
- —
- DSCR
- —
- Eligible?
- —
Short-term bridge; refi at stabilization.
Rent comps 40 comps
| Address | Beds | Baths | Sqft | Rent | $/sqft | DOM | Units | Dist |
|---|---|---|---|---|---|---|---|---|
| 122 Lemongrass Dr Princeton, TX | 4.0 | 2.0 | 1674 | $1,955 | $1.17 | 5d | 1 | 0.14mi |
| 5504 Rockrose Ln Princeton, TX | 3.0 | 2.0 | 1479 | $1,999 | $1.35 | 4d | 1 | 0.14mi |
| 128 Honeysuckle St Princeton, TX | 4.0 | 2.0 | 1675 | $2,200 | $1.31 | 18d | 1 | 0.14mi |
| 136 Honeysuckle St Princeton, TX | 3.0 | 2.0 | 1267 | $1,700 | $1.34 | 43d | 1 | 0.16mi |
| 5217 Rockrose Ln Princeton, TX | 4.0 | 2.0 | 1627 | $2,186 | $1.34 | 21d | 1 | 0.20mi |
| 5217 Rockrose Ln Princeton, TX | 4.0 | 2.0 | 1627 | $1,700 | $1.04 | 7d | 1 | 0.20mi |
| 119 Cypress Ln Princeton, TX | 3.0 | 2.0 | 1260 | $1,750 | $1.39 | 43d | 1 | 0.21mi |
| 5644 Rockrose Ln Princeton, TX | 3.0 | 2.0 | 1262 | $1,800 | $1.43 | 43d | 1 | 0.26mi |
| 108 Wyndemere Ln Princeton, TX | 3.0 | 2.0 | 1438 | $2,100 | $1.46 | 43d | 1 | 0.26mi |
| 5708 Rockrose Ln Princeton, TX | 3.0 | 2.0 | 1440 | $1,925 | $1.34 | 43d | 1 | 0.30mi |
| 5720 Rockrose Ln Princeton, TX | 4.0 | 3.0 | 1500 | $2,205 | $1.47 | 5d | 1 | 0.32mi |
| 5724 Rockrose Ln Princeton, TX | 3.0 | 2.0 | 1266 | $2,050 | $1.62 | 24d | 1 | 0.33mi |
| 5733 Rockrose Ln Princeton, TX | 3.0 | 2.0 | 1266 | $1,720 | $1.36 | 43d | 1 | 0.34mi |
| 5817 Rockrose Ln Princeton, TX | 3.0 | 2.0 | 1411 | $1,624 | $1.15 | 20d | 1 | 0.37mi |
| 5825 Rockrose Ln Princeton, TX | 3.0 | 2.0 | 1440 | $1,780 | $1.24 | 43d | 1 | 0.39mi |
| 5836 Timber Point Dr Princeton, TX | 3.0 | 2.0 | 1440 | $1,875 | $1.30 | 18d | 1 | 0.42mi |
| 320 Dewberry St Princeton, TX | 3.0 | 2.0 | 1481 | $1,745 | $1.18 | 12d | 1 | 0.42mi |
| 330 Ashbrook Way Princeton, TX | 3.0 | 2.0 | 1479 | $1,800 | $1.22 | 18d | 1 | 0.45mi |
| 228 Rubylace Dr Princeton, TX | 3.0 | 2.0 | 1436 | $1,700 | $1.18 | 43d | 1 | 0.46mi |
| 404 Dewberry St Princeton, TX | 4.0 | 2.0 | 1674 | $1,850 | $1.11 | 43d | 1 | 0.46mi |
| 403 Ashbrook Way Princeton, TX | 3.0 | 2.0 | 1485 | $1,749 | $1.18 | 5d | 1 | 0.48mi |
| 403 Ashbrook Way Princeton, TX | 3.0 | 2.0 | 1485 | $1,849 | $1.25 | 24d | 1 | 0.48mi |
| 318 Mahogany Ln Princeton, TX | 3.0 | 2.0 | 1479 | $1,800 | $1.22 | 24d | 1 | 0.49mi |
| 411 Ashbrook Way Princeton, TX | 4.0 | 2.0 | 1675 | $1,995 | $1.19 | 43d | 1 | 0.49mi |
| 5119 Winterberry Dr Princeton, TX | 4.0 | 2.0 | 1838 | $2,135 | $1.16 | 43d | 1 | 0.50mi |
| 5405 Lavender Dr Princeton, TX | 3.0 | 2.0 | 1675 | $1,900 | $1.13 | 43d | 1 | 0.51mi |
| 5405 Lavender Dr Princeton, TX | 3.0 | 2.0 | 1675 | $1,900 | $1.13 | 24d | 1 | 0.51mi |
| 427 Ashbrook Way Princeton, TX | 3.0 | 2.0 | 1482 | $1,800 | $1.21 | 3d | 1 | 0.52mi |
| 5836 Crystal Water Way Princeton, TX | 3.0 | 2.0 | 1481 | $1,799 | $1.21 | 5d | 1 | 0.54mi |
| 5105 Greywing Dr Princeton, TX | 3.0 | 2.0 | 1438 | $1,895 | $1.32 | 17d | 1 | 0.56mi |
| 510 Olmstead Dr Princeton, TX | 3.0 | 2.0 | 1260 | $2,395 | $1.90 | 5d | 1 | 0.57mi |
| 5847 Rock Maple Dr Princeton, TX | 3.0 | 2.0 | 1481 | $1,785 | $1.21 | 7d | 1 | 0.57mi |
| 5847 Rock Maple Dr Princeton, TX | 3.0 | 2.0 | 1481 | $1,785 | $1.21 | 16d | 1 | 0.57mi |
| 252 Ardsley Ln Princeton, TX | 4.0 | 2.0 | 1838 | $2,000 | $1.09 | 2d | 1 | 0.58mi |
| 252 Ardsley Ln Princeton, TX | 4.0 | 2.0 | 1838 | $2,000 | $1.09 | 16d | 1 | 0.58mi |
| 5808 Cherry Hollow Way Princeton, TX | 3.0 | 2.0 | 1260 | $1,749 | $1.39 | 17d | 1 | 0.59mi |
| 143 Plumcove Dr Princeton, TX | 3.0 | 3.0 | 1376 | $2,150 | $1.56 | 43d | 1 | 0.61mi |
| 617 Dashwood Dr Princeton, TX | 3.0 | 2.0 | 1440 | $1,619 | $1.12 | 2d | 1 | 0.64mi |
| 241 Boxberry Way Princeton, TX | 3.0 | 2.0 | 1411 | $1,725 | $1.22 | 43d | 1 | 0.72mi |
| 5213 Longshadow Dr Princeton, TX | 3.0 | 2.0 | 1260 | $2,035 | $1.62 | 5d | 1 | 0.76mi |
Listing history 10 events
-
2026-06-18days on market $100,000 Active 12 DOM
-
2026-06-17days on market $100,000 Active 11 DOM
-
2026-06-16days on market $100,000 Active 10 DOM
-
2026-06-15days on market $100,000 Active 9 DOM
-
2026-06-13days on market $100,000 Active 7 DOM
-
2026-06-13days on market $100,000 Active 6 DOM
-
2026-06-09days on market $100,000 Active 3 DOM
-
2026-06-08days on market $100,000 Active 2 DOM
-
2026-06-07remarks 599-char remark
-
2026-06-07$100,000 Active 1 DOM
ⓘ Source: listings_history table (triggers on properties + properties_extension) + one-shot
backfill from property_details.listing_events for pre-trigger history.
Climate risk First Street
- Flood 1/10 Low FEMA zone X · 0% chance over 30 yrs
- Wildfire 2/10 Low
- Heat 8/10 Severe
- Air quality 3/10 Moderate 3 unhealthy d/yr today · 3 by 30 yrs out
Nearby sold comps map
Loading sold comps map…
Walkable amenities ~0.75 mi
Loading nearby amenities…
Taxation est. · year 1
- Rental income
- $24,226
- − Mortgage interest
- −$5,602
- − Property taxes
- −$1,500
- − Insurance
- −$500
- − Repairs & maintenance
- −$1,938
- − Management
- −$1,938
- − Depreciation
- −$2,909
- Taxable income
- $9,839
- Est. tax owed @ 24.0%
- −$2,361
- After-tax cash flow
- $8,484/yr
For passive investors: Depreciation is non-cash, so a rental often shows a tax loss while cash-flowing — sheltering income. Rental losses are passive: they offset passive income freely, and up to $25,000/yr can offset ordinary (W-2) income if you actively participate and your MAGI is under $100k (phasing out to $0 by $150k); unused losses carry forward. On sale, claimed depreciation is recaptured at up to 25%, and gains may owe capital-gains tax (a 1031 exchange can defer both). Figures are a year-1 estimate at your 24.0% rate — not tax advice; consult a CPA.
Condition & rehab AI · 1 photo
This property is in a poor condition with no visible structure, landscaping, or fencing. Extensive repairs and improvements are needed to make it move-in ready and increase its value.
Repairs flagged
- Major Landscaping — The lot is barren and lacks any visible landscaping.
- Major Structural improvements — No visible structure or foundation is shown.
- Major Landscaping and fencing — The lot is open and unsecured, requiring landscaping and fencing to improve curb appeal and security.
Value-add opportunities
- Both Landscaping and fencing — Both improve the property's appearance and increase its value for both resale and rental.
- Both Structural improvements — These would make the property move-in ready and significantly increase its value for both resale and rental.
Renovation cost estimate screening
| Repair item | Severity | Est. cost |
|---|---|---|
| Landscaping · The lot is barren and lacks any visible landscaping. | Major | $15,000–50,000 |
| Structural improvements · No visible structure or foundation is shown. | Major | $15,000–50,000 |
| Landscaping and fencing · The lot is open and unsecured, requiring landscaping and fencing to improve curb appeal and security. | Major | $15,000–50,000 |
| Total estimated repair cost · 3 items | $45,000–150,000 |
Value-add ROI direction
- Both Landscaping and fencing — Both improve the property's appearance and increase its value for both resale and rental. ↑
- Both Structural improvements — These would make the property move-in ready and significantly increase its value for both resale and rental. ↑
ⓘ Cost ranges are severity-bucket heuristics (US national rule-of-thumb). Get contractor quotes + a written scope before underwriting a rehab budget.
Schools (NCES district)
- District
- Princeton ISD
- NCES district ID
- 4835850
- Math proficiency
- 51% ▼ -8.00%
- Reading proficiency
- 47% ▬ 0.00%
- Median HH income
- $54,827
- Composite
- 42.44/100
- National rank
- #3226
- State rank
- #188 of 826 in TX
Livability — Princeton
- Score
- 62/100
- State rank
- #969
- US rank
- #17215
Category grades
Schools grade is shown separately in the Schools card above.
Census & demographics
- County
- Collin County · 1,159,394 people
- City population
- 34,171
- Metro
- Dallas-Fort Worth-Arlington, TX
- Population (ZIP)
- 34,171
- Household income
- $100,037
- Rent vs Own
- Severe rent burden
- 368.0
Population outlook (Collin County) Hauer SSP2
- Today (2025)
- 1,210,074 people
- By 2030
- 1,358,201 · +12.2%
- By 2040
- 1,654,061 · +36.7%
- By 2050
- 1,937,359 · +60.1%
- By 2075
- 2,567,039 · +112.1%
- By 2100
- 2,952,048 · +144.0%
Race, ethnicity, and origin ACS 2023
- Neighborhood character
- Diverse neighborhood (Simpson 0.66)
- Race & ethnicity
- White 47% Hispanic / Latino 30% Black 17% Two or more races 10% Asian 4% Native American 1%
- Hispanic origin (detail)
- Mexican 26%
- Common ancestry
- Lithuanian 2% Romanian 1% Russian 1%
- Foreign-born
- 15% · Canada, China, Mexico
- Languages at home
- 70% English-only · Spanish 22% Other Indo-European 2% Other Asian/Pacific 1%
Political lean MEDSL · Collin
- 2024 margin
- R (+11.1) · D 43.1% · R 54.3% · Other 2.6%
- 2008→2024 swing
- +14.4pp toward D · 2008: -25.6pp · 2024: -11.1pp
- All cycles
- 2024: R+11.1 2020: R+4.3 2016: R+17.0 2012: R+31.6 2008: R+25.6
Not yet ingested
- Civics
- —
Market trends
- HPI YoY
- ▼ -103.99%
- Current HPI
- 238.9373
- Rent YoY
- ▼ -1.02%
- Metro
- Dallas-Fort Worth-Arlington, TX
- State GDP YoY
- ▲ 3.95%
- F500 in state
- 110
Industry mix (Fortune 500 HQ in TX)
| Industry | F500 HQs | Revenue |
|---|---|---|
| Energy | 16 | $1,198B |
|
||
| Technology | 5 | $198B |
|
||
| Engineering / Construction | 4 | $72B |
|
||
| Energy Services | 3 | $60B |
|
||
| Utilities | 3 | $41B |
|
||
| Healthcare | 2 | $330B |
|
||
Price history
1 event — show timeline
- 2026-06-07 Listed $100,000 FSBO.com
Cash-flow waterfall
monthlySold comps — $/sqft
last 12 mo · ≤1 miLoading sold comps…