 Duplex
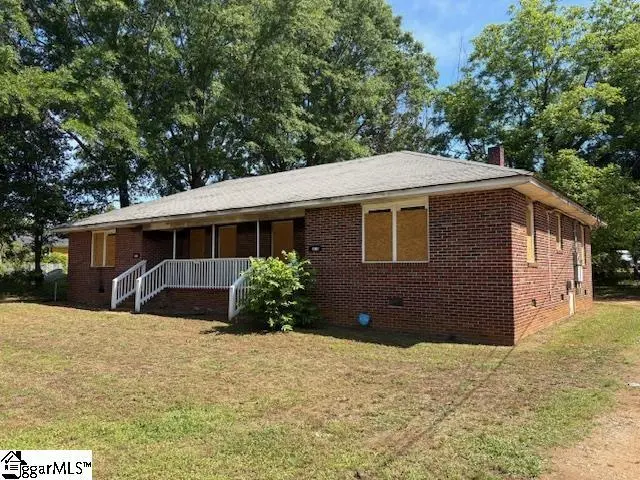
3311 Berry Ln · Homeland Park, SC
Flood risk 7/10 · Major
- FEMA flood zone
- X (unshaded)
- Chance of flooding over 30 yrs
- 0.96%
- Est. flood insurance / yr
- $507 – $1,088
Fire risk 3/10 · Minor
- Est. fire insurance / yr
- $783 – $1,453
Heat risk 6/10 · Moderate
- Hot days now (above 105°F)
- 7 days/yr
- Hot days in 30 yrs
- 17 days/yr
Wind risk 4/10 · Minor
- Chance of severe wind over 30 yrs
- 9.0%
Air-quality risk 3/10 · Minor
- Unhealthy air days now
- 3 days/yr
- Unhealthy air days in 30 yrs
- 3 days/yr
Risk factors via First Street. Map © Google.
Why this score? — see what drove the B grade
The composite is a weighted blend of 9 inputs, each scored 0–100. Each bar is that input's sub-score; the figure is the points it added to the 100-point composite (weight × sub-score).
- Cash flow +30.0/30.0
- 1% rule +10.0/10.0
- DSCR +10.0/10.0
- ARV discount +7.5/15.0
- Appreciation +4.0/10.0
- Schools +3.9/10.0
- Livability +2.8/5.0
- Rent growth +2.5/5.0
- Condition / age +1.0/5.0
$69,900
🖨 Deal sheet 📄 Offer letter ✓ Due diligence
Multi-family units
County records classify this as Multi-Family (5+ Unit). Listing-text estimate: 2 units. estimate disagrees with records
5+ unit building — per-unit beds/baths from public records are typically unavailable; the breakdown below (if shown) is an estimate from the listing text.
Listing remarks
Calling all contractors, flippers, and investors. This FIRE DAMAGED Duplex provides a great opportunity to restore this 2/1 each side duplex and pocket the profits. Unit A is the more the more damaged side, Unit B has smoke damage. The buyer is responsible for determining any restoration costs associated. Agent will arrange to meet on site to remove board up protection so potential purchasers can access. Bring your flash light ! Proof of funds required before showing.
Key facts
- 9,583 sq ft lot
- 2 parking spots
- Built 1960
Property features AI
Exterior
- Parking: Paved driveway
- Utilities: Public water; Public sewer; Water heater: Other (see remarks); Private garbage pickup
- Home design: Single-story building; Built in 1960; Crawl space foundation
- Construction: Brick veneer construction; Composition shingle roof; Crawl space foundation; Approximately 1960 construction (50+ years old)
- Exterior features: Brick veneer exterior; Composition shingle roof
Interior
- Bedrooms: Each unit has 2 bedrooms
- Bathrooms: Each unit has 1 full bathroom
- Heating & cooling: No heating system; No cooling system
- Interior features: Two-unit building
Neighborhood map
What this means for you Summary
Snapshot
- This is a 2 × 2-bed/1.0-bath units multifamily listed at $70k. Condition is rated poor.
Deal economics
- At list price, monthly cash flow is $1k ($17k/yr) — positive. Per door: $708/mo.
- The deal already cash-flows at list — no discount required.
- Meets the 1% rule at list price ($2k rent vs $70k).
- Cap rate 31.7% vs local median 4.5% in Homeland Park — top-decile yield for the area; either an underpriced asset or a hidden risk that comps aren't pricing in. Stress-test before assuming the spread holds.
Location & tenants
- Location reads 56/100 on livability (#299 in SC) — a working-class tenant base; expect higher turnover. Strengths: cost of living A+, housing A-; Watch: health & safety C-, crime F, amenities F.
- Anderson 05 (suburban): math 44% / reading 49% proficiency, ranked #20 of 80 in SC (top 25%) — families likely to look elsewhere, expect single-tenant / working-renter base with shorter leases.
- Zoned schools: Varennes Elementary (math 18% / reading 18%, grade F, #508 of 597 statewide, top 86%, 370 students, 100% FRL) — zoned schools average 100% FRL vs 52% district-wide (48 pts higher); higher-poverty schools than district average — tighter screening recommended.
- Zoned-school proficiency averages 18% at this address vs 46% district-wide (-28 pts) — the specific schools serving this property underperform the Anderson 05 average; the district grade overstates school quality for this exact location.
- Market conditions: 114 active listings in the ZIP; 1 comparable units currently listed for rent nearby; lower-income renter base — watch delinquency; 1,255 units permitted in Anderson County in 2024 (0 in 5+ unit buildings).
- At $2,488/mo this rent would consume 98% of the median local household income ($31k/yr) (locally 843% of renters already pay >50% of income on rent) — very limited rent-growth headroom before tenants either downsize or default.
Forward outlook
- Local home prices are declining (-2.1%/yr); year-one equity from $483 of loan paydown is wiped out by about $1k of value loss. Plan a longer hold.
- Anderson County population projected at +14% by 2050 — modest demand growth; plan on rents tracking national, not racing it.
- At projected returns (-2.1% appreciation + 3.0% rent growth), your $20k cash investment doubles in ~2 years — after that, you're playing with house money.
Negotiation context
- Only 13 days on market — expect competitive offers; lowballing is unlikely to land.
- 2 sale attempts since 2y ago with the ask held roughly flat each time — persistent listings suggest the price (not the market) is what's stuck; bring a comps-based counter.
Risks & watch-outs
- Watch-outs: flood insurance adds $66/mo.
- Climate carrying-cost: major flood risk; extreme-heat days projected 7→17/yr by 2055 (HVAC capex compounding) — expect insurance premiums to compound above CPI over the hold.
Questions for the listing agent
- Can we see the unit-by-unit rent roll, current vacancy, and any below-market leases? What's the average tenancy length?
- What capital expenditures (roof, boiler, parking lot, exteriors) have been made in the last 5 years, and what's planned in the next 2?
- Have any recent inspections been done? Can we get a copy of the seller's disclosures and any deferred-maintenance estimates?
- Built in 1960 — when were the roof, HVAC, electrical panel, plumbing, and water heater last replaced?
- What's the actual annual flood-insurance premium (NFIP or private), and is the property in a SFHA with mandatory coverage?
- Is there a deadline driving the sale (1031 exchange, divorce, estate, relocation)? That informs how much negotiation room exists.
- Schools are F-rated, which usually means shorter tenancies and higher turnover. Who's the typical renter profile here, and what's been the actual vacancy rate?
- Crime grade is F in this area — have there been break-ins, vandalism, or insurance claims at this property in the last 3 years? What carrier currently insures it and at what premium?
- What's the average days-on-market for RENTAL listings here right now (not sales)? A rising rental-DOM trend means longer vacancies and softer asking-rent achievability than the comps imply.
- What's the recent tenant-quality profile in this submarket — average credit score on applications, eviction rate, late-payment / NSF rate, and stable-employment percentage? A property-management company in the area should have these aggregated.
- How much new apartment / multifamily construction is in the pipeline within 1–3 miles? Heavy new supply (>2% of stock underway) typically softens rents 12–24 months out; light construction supports rent growth.
Investment metrics
- 1% rule
- 3.56% ✓
- Cap rate
- 31.74%
- Cash-on-cash
- 90.89%
- DSCR
- 5.04
- GRM
- 2.3
CMA / ARV
No comps found within radius.
Show comp detail 7 sales within ~0.75 mi
| Address | Dist | Beds/Ba | Sqft | Sold | Price | $/sf | Match |
|---|---|---|---|---|---|---|---|
| 3311 Berry Ln | 0.00mi | 4/2.0 | 1,800 | 0mo | $69,900 | $39 | 87 |
| 123 Rubin Ave Unit Units A B | 0.20mi | 4/3.0 | 2,084 | 2mo | $299,000 | $143 | 73 |
| 203 Cromer Rd Unit A & B | 0.16mi | 4/3.0 | 2,060 | 5mo | $285,000 | $138 | 72 |
| 125 Rubin Ave Unit A & B | 0.21mi | 4/3.0 | 2,060 | 6mo | $275,000 | $133 | 69 |
| 209 Cromer Rd Unit Units A and B | 0.17mi | 4/3.0 | 2,060 | 16mo | $290,000 | $141 | 62 |
| 205 Cromer Rd Unit UNITS A and B | 0.17mi | 4/3.0 | 2,060 | 16mo | $290,000 | $141 | 62 |
| 123 Rubin Ave Unit A & B | 0.20mi | 4/3.0 | 2,048 | 21mo | $290,000 | $142 | 57 |
Match score weights: distance 35% · size 25% · config 20% · recency 20%. Top-matched comps best support the ARV.
Projected returns pro-forma
-2.06% appreciation · 3.0% rent growth · sell at horizon
- IRR
- 87.9%
- Equity multiple
- 5.18×
- Total profit
- $81,722
- Equity at exit
- $13,385
- IRR
- 90.5%
- Equity multiple
- 10.71×
- Total profit
- $190,085
- Equity at exit
- $11,257
Cash invested: $19,572 (down + closing). Projections, not guarantees.
Landlord ↔ Tenant lean methodology
- Overall (STATE)
- 90 Strongly Landlord-Friendly
- State South Carolina
- 90 Strongly Landlord-Friendly · R+6
- County
- — inherits STATE
- City
- — inherits STATE
ZIP-level market 29624
- Home prices YoY
- -0.5%
- Active inventory
- 114
- Price-to-rent
- 4.7×
Monthly cashflow live
- Estimated rent
- $2,488 high interval (Pro) →
- Mortgage (P&I)
- −$367
- Tax est. 1.5%
- −$87 /mo · $1,048/yr
- Insurance
- −$29
- Flood insurance flood zone
- −$66 /mo · $798/yr
- HOA
- −$0
- Vacancy / Maint / Mgmt
- −$522
- Net cashflow
- $1,416
Break-even live
2-unit breakdown (identical units grouped — click to expand)
| Units | Beds | Baths | Est. rent |
|---|---|---|---|
| 2× units | 2 | 1 | $2,488 |
| #1 | 2 | 1 | $1,244 |
| #2 | 2 | 1 | $1,244 |
| Total (2 units) | $2,488 | ||
UW: 25.0% down · 7.5% · 30yr · 1.5% tax · 5.0% vac · 8.0% maint · 8.0% mgmt
Financing live
Cash to close
- Down payment
- $17,475
- Closing costs
- $2,097
- Reserves months
- —
- Total cash needed
- —
Loan-product check · same deal, 3 products live
Conventional
25% down · 7.5% · 30yr
- Down + closing
- —
- Monthly P&I
- —
- Monthly cashflow
- —
- DSCR
- —
- Eligible?
- —
Personal DTI + credit; lowest rate.
DSCR
20% down · 8.5% · 30yr
- Down + closing
- —
- Monthly P&I
- —
- Monthly cashflow
- —
- DSCR
- —
- Eligible?
- —
No personal income docs; deal must DSCR.
Hard money
10% down · 12.0% · 12mo
- Down + closing
- —
- Monthly P&I
- —
- Monthly cashflow
- —
- DSCR
- —
- Eligible?
- —
Short-term bridge; refi at stabilization.
Rent comps 1 comps
| Address | Beds | Baths | Sqft | Rent | $/sqft | DOM | Units | Dist |
|---|---|---|---|---|---|---|---|---|
| 108 Poplar Ln Unit 1 Anderson, SC | 3.0 | 3.5 | 1068 | $1,000 | $0.94 | 23d | 1 | 1.43mi |
Listing history 7 events
-
2026-05-18status Pending
-
2026-05-05$69,900 Active
-
2025-04-28historical $925
-
2025-04-10price $925
-
2025-02-06price $950
-
2024-09-26price $1,000
-
2024-06-12$1,050
ⓘ Source: listings_history table (triggers on properties + properties_extension) + one-shot
backfill from property_details.listing_events for pre-trigger history.
Climate risk First Street
- Flood 7/10 Severe FEMA zone X (unshaded) · 96% chance over 30 yrs
- Wildfire 3/10 Moderate
- Heat 6/10 Major 7 d/yr ≥105°F today · 17 d/yr by 30 yrs out
- Wind 4/10 Moderate 9% chance of damaging wind over 30 yrs
- Air quality 3/10 Moderate 3 unhealthy d/yr today · 3 by 30 yrs out
Nearby sold comps map
Loading sold comps map…
Walkable amenities ~0.75 mi
Loading nearby amenities…
Taxation est. · year 1
- Rental income
- $29,856
- − Mortgage interest
- −$3,915
- − Property taxes
- −$1,048
- − Insurance
- −$1,147
- − Repairs & maintenance
- −$2,388
- − Management
- −$2,388
- − Depreciation
- −$2,033
- Taxable income
- $16,935
- Est. tax owed @ 24.0%
- −$4,064
- After-tax cash flow
- $12,928/yr
For passive investors: Depreciation is non-cash, so a rental often shows a tax loss while cash-flowing — sheltering income. Rental losses are passive: they offset passive income freely, and up to $25,000/yr can offset ordinary (W-2) income if you actively participate and your MAGI is under $100k (phasing out to $0 by $150k); unused losses carry forward. On sale, claimed depreciation is recaptured at up to 25%, and gains may owe capital-gains tax (a 1031 exchange can defer both). Figures are a year-1 estimate at your 24.0% rate — not tax advice; consult a CPA.
Condition & rehab AI · 4 photos
This fire-damaged duplex requires extensive repairs and rebuilding to restore its structural integrity and appearance, significantly increasing its resale and rental value.
Repairs flagged
- Major Boarded up windows — Structural damage
- Major Exposed roof structure — Structural damage
- Major Exposed subflooring — Structural damage
- Major Exposed interior walls — Structural damage
- Major Exposed HVAC and electrical systems — Structural damage
Value-add opportunities
- Both Rebuild and repair all exterior and interior structures — Structural integrity and appearance
- Both Replace roof and siding — Safety and curb appeal
- Both Rebuild HVAC and electrical systems — Safety and functionality
Renovation cost estimate screening
| Repair item | Severity | Est. cost |
|---|---|---|
| Boarded up windows · Structural damage | Major | $15,000–50,000 |
| Exposed roof structure · Structural damage | Major | $15,000–50,000 |
| Exposed subflooring · Structural damage | Major | $15,000–50,000 |
| Exposed interior walls · Structural damage | Major | $15,000–50,000 |
| Exposed HVAC and electrical systems · Structural damage | Major | $15,000–50,000 |
| Total estimated repair cost · 5 items | $75,000–250,000 |
Value-add ROI direction
- Both Rebuild and repair all exterior and interior structures — Structural integrity and appearance ↑
- Both Replace roof and siding — Safety and curb appeal ↑
- Both Rebuild HVAC and electrical systems — Safety and functionality ↑
ⓘ Cost ranges are severity-bucket heuristics (US national rule-of-thumb). Get contractor quotes + a written scope before underwriting a rehab budget.
Schools (NCES district)
- District
- Anderson 05
- NCES district ID
- 4500900
- Math proficiency
- 44% ▼ -4.00%
- Reading proficiency
- 49% ▲ 2.00%
- Median HH income
- $39,718
- Composite
- 38.89/100
- National rank
- #4098
- State rank
- #20 of 80 in SC
Livability — Homeland Park
- Score
- 56/100
- State rank
- #299
- US rank
- #23092
Category grades
Schools grade is shown separately in the Schools card above.
Census & demographics
- Census place
- Homeland Park, SC
- County
- Anderson County · 99,076 people
- Metro
- Greenville-Anderson, SC
- Population (ZIP)
- 13,498
- Household income
- $30,549
- Rent vs Own
- Severe rent burden
- 843.0
Population outlook (Anderson County) Hauer SSP2
- Today (2025)
- 210,546 people
- By 2030
- 217,791 · +3.4%
- By 2040
- 230,643 · +9.5%
- By 2050
- 240,220 · +14.1%
- By 2075
- 259,518 · +23.3%
- By 2100
- 258,696 · +22.9%
Race, ethnicity, and origin ACS 2023
- Neighborhood character
- Diverse neighborhood (Simpson 0.63)
- Race & ethnicity
- White 44% Black 41% Hispanic / Latino 10% Two or more races 7%
- Hispanic origin (detail)
- Mexican 6%
- Common ancestry
- Serbian 1% Lithuanian 1% Italian 1%
- Foreign-born
- 3% · Canada
- Languages at home
- 95% English-only · Spanish 4%
Political lean MEDSL · Anderson
- 2024 margin
- Solid R (+47.4) · D 25.7% · R 73.1% · Other 1.2%
- 2008→2024 swing
- -14.1pp toward R · 2008: -33.3pp · 2024: -47.4pp
- All cycles
- 2024: R+47.4 2020: R+42.0 2016: R+43.7 2012: R+36.4 2008: R+33.3
Not yet ingested
- Civics
- —
Market trends
- HPI YoY
- ▼ -2.06%
- Current HPI
- 406.0533
- Rent YoY
- —
- Metro
- Greenville-Anderson, SC
- State GDP YoY
- ▲ 4.51%
- F500 in state
- 2
Industry mix (Fortune 500 HQ in SC)
| Industry | F500 HQs | Revenue |
|---|---|---|
| Packaging | 1 | $7B |
|
||
Price history
+6557.1% since first listed7 events — show timeline
- 2026-05-18 Pending — Greater Greenville MLS
- 2026-05-05 Listed $69,900 Greater Greenville MLS
- 2025-04-28 Rental Removed $925 BUILDIUM
- 2025-04-10 Price Changed $925 BUILDIUM
- 2025-02-06 Price Changed $950 BUILDIUM
- 2024-09-26 Price Changed $1,000 BUILDIUM
- 2024-06-12 Listed for Rent $1,050 BUILDIUM
Cash-flow waterfall
monthlySold comps — $/sqft
last 12 mo · ≤1 miLoading sold comps…