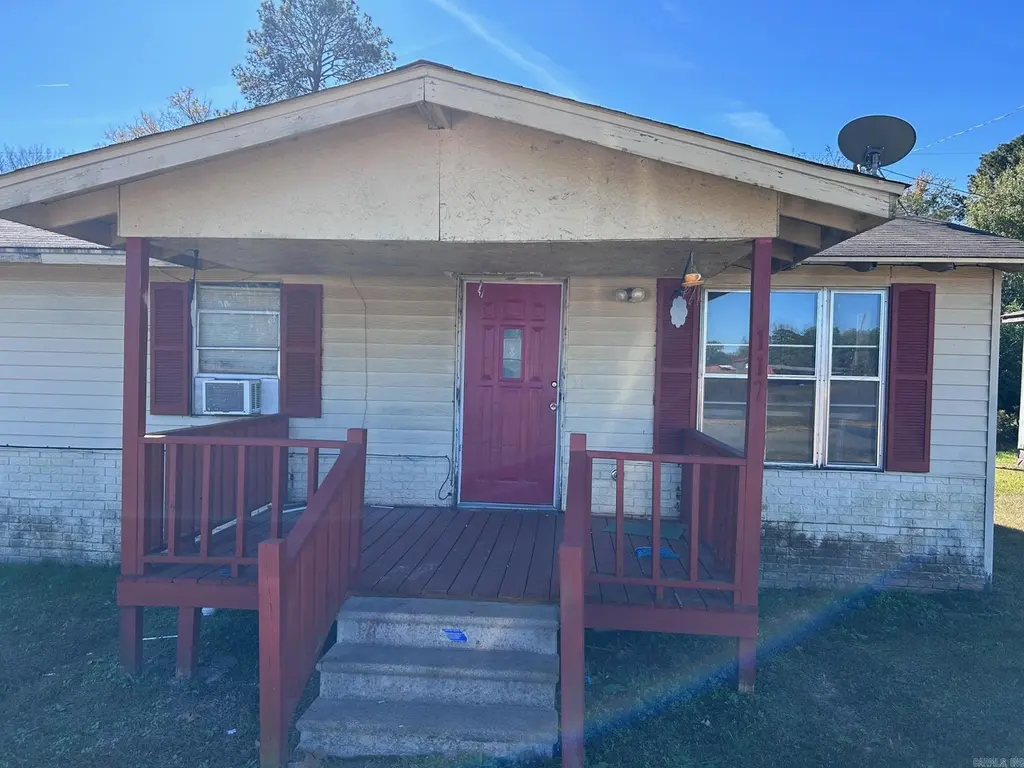
117 N Loop · Mineral Springs, AR
Flood risk 1/10 · Minimal
- FEMA flood zone
- X (unshaded)
- Chance of flooding over 30 yrs
- 0.0%
- Est. flood insurance / yr
- $507 – $1,088
Fire risk 6/10 · Moderate
- Est. fire insurance / yr
- $1,499 – $2,785
Heat risk 6/10 · Moderate
- Hot days now (above 111°F)
- 7 days/yr
- Hot days in 30 yrs
- 21 days/yr
Wind risk 4/10 · Minor
- Chance of severe wind over 30 yrs
- 14.0%
Air-quality risk 2/10 · Minimal
- Unhealthy air days now
- 0 days/yr
- Unhealthy air days in 30 yrs
- 1 days/yr
Risk factors via First Street. Map © Google.
Why this score? — see what drove the D+ grade
The composite is a weighted blend of 9 inputs, each scored 0–100. Each bar is that input's sub-score; the figure is the points it added to the 100-point composite (weight × sub-score).
- Cash flow +15.0/30.0
- ARV discount +7.5/15.0
- Appreciation +5.6/10.0
- 1% rule +5.0/10.0
- DSCR +5.0/10.0
- Livability +3.2/5.0
- Rent growth +2.5/5.0
- Condition / age +2.5/5.0
- Schools +1.2/10.0
$19,900
🖨 Deal sheet 📄 Offer letter ✓ Due diligence
Listing remarks
Great investment potential! This 3-bedroom, 1-bath home, built in 1973, is located on the outskirts of town—offering privacy while still being close to local amenities. The property needs some TLC, making it an ideal project for investors or anyone looking to add value. With its convenient location and solid structure, it could serve as a dependable rental property or a long-term addition to your portfolio. The property is sold As-Is, Where-Is. Seller has no knowledge, buyer should perform their due diligence and make their own assessments.
Key facts
- 6,098 sq ft lot
- Built 1973
- Listed 187 days
Neighborhood map
What this means for you Summary
Snapshot
- This is a 3-bed/1.0-bath single-family listed at $20k.
Deal economics
- At list price, monthly cash flow is $621 ($7k/yr) — positive.
- The deal already cash-flows at list — no discount required.
- Meets the 1% rule at list price ($941 rent vs $20k).
- Recommended offer: $18k (12.0% below list) — sets the bar for market timing.
Location & tenants
- Location reads 64/100 on livability (#185 in AR) — a middle-class / working-renter tenant base. Strengths: cost of living A+, housing A, crime A-; Watch: schools F, amenities F, commute F.
- Mineral Springs School District (rural): math 15% / reading 15% proficiency, ranked #222 of 238 in AR (top 93%) — low school quality limits family demand, transient renter base, plan for 1-2y turnover; 78% free/reduced lunch — lower-income household profile, screen leases tightly.
- Market conditions: 9 active listings in the ZIP; 1 units permitted in Howard County in 2024 (0 in 5+ unit buildings).
Forward outlook
- In year one you build about $361 of equity ($138 loan paydown + $223 appreciation (1.1% local appreciation)).
- Howard County population projected at -14% by 2050 — secular population decline; favor cash flow + early exit over multi-decade hold.
- At projected returns (1.1% appreciation + 3.0% rent growth), your $6k cash investment doubles in ~1 year — after that, you're playing with house money.
Negotiation context
- It's been on market 187 days — a 12% lower offer ($18k) is reasonable based on typical stale-listing flexibility.
- 4 sale attempts; this cycle's ask has dropped $15k (43%) from the opening price — seller is motivated, your offer sets the floor, not the list.
- Current owner paid $11k; list at $20k implies a 81% gain — meaningful room to come down on a strong offer.
Risks & watch-outs
- Climate carrying-cost: major wildfire risk; extreme-heat days projected 7→21/yr by 2055 (HVAC capex compounding) — expect insurance premiums to compound above CPI over the hold.
Questions for the listing agent
- It's been on market 187 days. Have you received any prior offers? Is the seller open to a 12% concession, seller financing, or rate buy-down credit?
- Built in 1973 — when were the roof, HVAC, electrical panel, plumbing, and water heater last replaced?
- Why hasn't it sold? Are there any deal-killer items the seller is aware of (foundation, flood, title, zoning, code violations)?
- Is there a deadline driving the sale (1031 exchange, divorce, estate, relocation)? That informs how much negotiation room exists.
- Schools are F-rated, which usually means shorter tenancies and higher turnover. Who's the typical renter profile here, and what's been the actual vacancy rate?
- The area grade is low — what's the realistic commute time and amenity access for the typical tenant pool here? Any planned neighborhood developments (good or bad) we should know about?
- What's the average days-on-market for RENTAL listings here right now (not sales)? A rising rental-DOM trend means longer vacancies and softer asking-rent achievability than the comps imply.
- What's the recent tenant-quality profile in this submarket — average credit score on applications, eviction rate, late-payment / NSF rate, and stable-employment percentage? A property-management company in the area should have these aggregated.
- How much new for-sale + rental construction is in the pipeline within 1–3 miles? Heavy new supply typically softens prices + rents 12–24 months out; constrained supply supports both.
Investment metrics
- 1% rule
- 4.73% ✓
- Cap rate
- 43.77%
- Cash-on-cash
- 133.84%
- DSCR
- 6.96
- GRM
- 1.8
CMA / ARV
- ARV (median comp)
- $107,099
- List price
- $19,900
- Delta
- -81.42%
- Verdict
- UNDERPRICED
- Comps
- 2 within 1.0 mi
Show comp detail 1 sale within ~0.75 mi
| Address | Dist | Beds/Ba | Sqft | Sold | Price | $/sf | Match |
|---|---|---|---|---|---|---|---|
| 302 N Pne | 0.29mi | 2/1.0 (-1) | 912 (0%) | 14mo | $65,000 | $71 | 69 |
Match score weights: distance 35% · size 25% · config 20% · recency 20%. Top-matched comps best support the ARV.
Projected returns pro-forma
1.12% appreciation · 3.0% rent growth · sell at horizon
- IRR
- —
- Equity multiple
- 8.19×
- Total profit
- $40,074
- Equity at exit
- $6,917
- IRR
- —
- Equity multiple
- 17.11×
- Total profit
- $89,762
- Equity at exit
- $9,288
Cash invested: $5,572 (down + closing). Projections, not guarantees.
Landlord ↔ Tenant lean methodology
- Overall (STATE)
- 92 Strongly Landlord-Friendly
- State Arkansas
- 92 Strongly Landlord-Friendly · R+14
- County
- — inherits STATE
- City
- — inherits STATE
ZIP-level market 71851
- Home prices YoY
- 1.1%
- Active inventory
- 9
- Price-to-rent
- 1.8×
Monthly cashflow live
- Estimated rent
- $941 medium interval (Pro) →
- Mortgage (P&I)
- −$104
- Tax from tax record
- −$9 /mo · $113/yr
- Insurance
- −$8
- HOA
- −$0
- Vacancy / Maint / Mgmt
- −$198
- Net cashflow
- $621
Break-even live
UW: 25.0% down · 7.5% · 30yr · 1.5% tax · 5.0% vac · 8.0% maint · 8.0% mgmt
Financing live
Cash to close
- Down payment
- $4,975
- Closing costs
- $597
- Reserves months
- —
- Total cash needed
- —
Loan-product check · same deal, 3 products live
Conventional
25% down · 7.5% · 30yr
- Down + closing
- —
- Monthly P&I
- —
- Monthly cashflow
- —
- DSCR
- —
- Eligible?
- —
Personal DTI + credit; lowest rate.
DSCR
20% down · 8.5% · 30yr
- Down + closing
- —
- Monthly P&I
- —
- Monthly cashflow
- —
- DSCR
- —
- Eligible?
- —
No personal income docs; deal must DSCR.
Hard money
10% down · 12.0% · 12mo
- Down + closing
- —
- Monthly P&I
- —
- Monthly cashflow
- —
- DSCR
- —
- Eligible?
- —
Short-term bridge; refi at stabilization.
Listing history 20 events
-
2026-06-07statusdays on market $19,900 Under Contract 187 DOM
-
2026-06-04statusdays on market $19,900 Active 185 DOM
-
2026-06-02days on market $19,900 Back on Market 184 DOM
-
2026-06-01days on market $19,900 Back on Market 183 DOM
-
2026-05-31days on market $19,900 Back on Market 182 DOM
-
2026-05-31days on market $19,900 Back on Market 181 DOM
-
2026-05-17historical
-
2026-04-26status Back on Market
-
2026-03-14historical Take Backups
-
2026-02-03price $19,900
-
2026-01-02price $25,000
-
2025-11-18$35,000 New Listing
-
2025-09-23historical
-
2025-05-29status Back on Market
-
2025-05-19historical
-
2025-05-07price $41,800
-
2025-04-18price $45,800
-
2025-04-02price $57,400
-
2025-03-18$76,900 New Listing
-
1997-06-11soldstatus $11,000
ⓘ Source: listings_history table (triggers on properties + properties_extension) + one-shot
backfill from property_details.listing_events for pre-trigger history.
Tax reassessment forecast AR · Resets to sale price
- Current annual tax
- $113 · $9/mo
- Projected year-2 tax
- $127 · $11/mo
- Expected delta
- +$14/yr (+$1/mo · 12.7%)
ⓘ Screening estimate from a state-policy table — verify with the county assessor before closing.
Climate risk First Street
- Flood 1/10 Low FEMA zone X (unshaded) · 0% chance over 30 yrs
- Wildfire 6/10 Major
- Heat 6/10 Major 7 d/yr ≥111°F today · 21 d/yr by 30 yrs out
- Wind 4/10 Moderate 14% chance of damaging wind over 30 yrs
- Air quality 2/10 Low 0 unhealthy d/yr today · 1 by 30 yrs out
Nearby sold comps map
Loading sold comps map…
Walkable amenities ~0.75 mi
Loading nearby amenities…
Taxation est. · year 1
- Rental income
- $11,294
- − Mortgage interest
- −$1,115
- − Property taxes
- −$113
- − Insurance
- −$100
- − Repairs & maintenance
- −$904
- − Management
- −$904
- − Depreciation
- −$579
- Taxable income
- $7,581
- Est. tax owed @ 24.0%
- −$1,819
- After-tax cash flow
- $5,638/yr
For passive investors: Depreciation is non-cash, so a rental often shows a tax loss while cash-flowing — sheltering income. Rental losses are passive: they offset passive income freely, and up to $25,000/yr can offset ordinary (W-2) income if you actively participate and your MAGI is under $100k (phasing out to $0 by $150k); unused losses carry forward. On sale, claimed depreciation is recaptured at up to 25%, and gains may owe capital-gains tax (a 1031 exchange can defer both). Figures are a year-1 estimate at your 24.0% rate — not tax advice; consult a CPA.
Schools (NCES district)
- District
- Mineral Springs School District
- NCES district ID
- 0509780
- Math proficiency
- 15% ▼ -12.00%
- Reading proficiency
- 15% ▼ -7.00%
- Median HH income
- $35,351
- Composite
- 12.37/100
- National rank
- #9635
- State rank
- #222 of 238 in AR
Livability — Mineral Springs
- Score
- 64/100
- State rank
- #185
- US rank
- #14819
Category grades
Schools grade is shown separately in the Schools card above.
Census & demographics
- Census place
- Mineral Springs, AR
- Population (ZIP)
- 1,822
Population outlook (Howard County) Hauer SSP2
- Today (2025)
- 12,642 people
- By 2030
- 12,218 · -3.4%
- By 2040
- 11,470 · -9.3%
- By 2050
- 10,874 · -14.0%
- By 2075
- 10,517 · -16.8%
- By 2100
- 10,929 · -13.6%
Race, ethnicity, and origin ACS 2023
- Neighborhood character
- Diverse neighborhood (Simpson 0.63)
- Race & ethnicity
- Black 46% White 37% Hispanic / Latino 14% Two or more races 13%
- Hispanic origin (detail)
- Mexican 13%
- Common ancestry
- Iranian 1% Serbian 1% French 1%
- Foreign-born
- 11% · Canada, Jamaica
- Languages at home
- 84% English-only · Spanish 12% German/W. Germanic 4%
Political lean MEDSL · Howard
- 2024 margin
- Solid R (+46.7) · D 25.9% · R 72.6% · Other 1.5%
- 2008→2024 swing
- -21.7pp toward R · 2008: -25.0pp · 2024: -46.7pp
- All cycles
- 2024: R+46.7 2020: R+41.9 2016: R+39.0 2012: R+31.7 2008: R+25.0
Not yet ingested
- Civics
- —
Market trends
- HPI YoY
- ▲ 1.12%
- Current HPI
- 102.3152
- Rent YoY
- —
- Metro
- —
- State GDP YoY
- ▲ 3.80%
- F500 in state
- 10
Industry mix (Fortune 500 HQ in AR)
| Industry | F500 HQs | Revenue |
|---|---|---|
| Retail | 1 | $681B |
|
||
| Food / Agriculture | 1 | $53B |
|
||
| Retail / Energy | 1 | $22B |
|
||
| Transportation / Logistics | 1 | $12B |
|
||
| Energy | 1 | $4B |
|
||
Price history
+80.9% since first listed14 events — show timeline
- 2026-05-17 Listing Removed — CARMLS
- 2026-04-26 Relisted — CARMLS
- 2026-03-14 Contingent — CARMLS
- 2026-02-03 Price Changed $19,900 CARMLS
- 2026-01-02 Price Changed $25,000 CARMLS
- 2025-11-18 Listed $35,000 CARMLS
- 2025-09-23 Listing Removed — CARMLS
- 2025-05-29 Relisted — CARMLS
- 2025-05-19 Listing Removed — CARMLS
- 2025-05-07 Price Changed $41,800 CARMLS
- 2025-04-18 Price Changed $45,800 CARMLS
- 2025-04-02 Price Changed $57,400 CARMLS
- 2025-03-18 Listed $76,900 CARMLS
- 1997-06-11 Sold (Public Records) $11,000 Public Records
Cash-flow waterfall
monthlySold comps — $/sqft
last 12 mo · ≤1 miLoading sold comps…