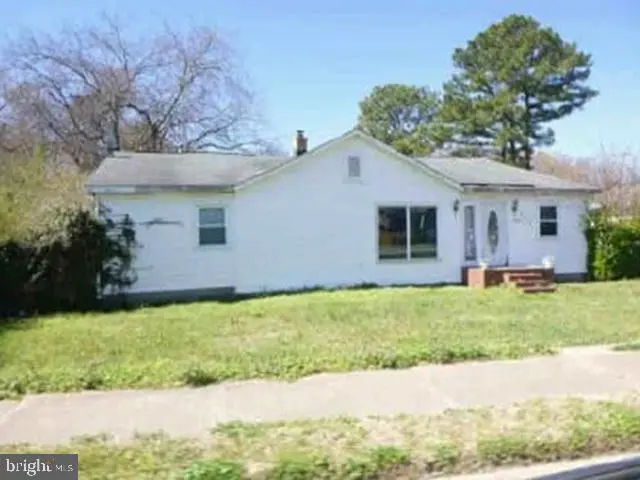
2713 N Armistead Ave · Hampton, VA
Flood risk 6/10 · Moderate
- FEMA flood zone
- X (unshaded)
- Chance of flooding over 30 yrs
- 0.73%
- Est. flood insurance / yr
- $473 – $860
Fire risk 3/10 · Minor
- Est. fire insurance / yr
- $666 – $1,236
Heat risk 9/10 · Severe
- Hot days now (above 105°F)
- 7 days/yr
- Hot days in 30 yrs
- 17 days/yr
Wind risk 8/10 · Major
- Chance of severe wind over 30 yrs
- 80.0%
Air-quality risk 2/10 · Minimal
- Unhealthy air days now
- 2 days/yr
- Unhealthy air days in 30 yrs
- 2 days/yr
Risk factors via First Street. Map © Google.
Why this score? — see what drove the B+ grade
The composite is a weighted blend of 9 inputs, each scored 0–100. Each bar is that input's sub-score; the figure is the points it added to the 100-point composite (weight × sub-score).
- Cash flow +29.1/30.0
- ARV discount +15.0/15.0
- DSCR +10.0/10.0
- 1% rule +7.7/10.0
- Schools +5.5/10.0
- Livability +3.8/5.0
- Rent growth +3.5/5.0
- Condition / age +2.5/5.0
- Appreciation +0.0/10.0
$185,800
🖨 Deal sheet 📄 Offer letter ✓ Due diligence
Listing remarks MLS
NO ACCESS OR VIEWINGS of this property. Please DO NOT DISTURB the occupant. Take a drive by this three bedroom, one bath home and see if it may be your next investment. "As is" cash only sale with no contingencies or inspections. Buyer will be responsible for obtaining possession of the property upon closing.
Key facts
- 0.99 acre lot
- Pool
- Built 1933
Neighborhood map
What this means for you Summary
Snapshot
- This is a 3-bed/1.0-bath single-family listed at $186k.
Deal economics
- At list price, monthly cash flow is $640 ($8k/yr) — positive.
- The deal already cash-flows at list — no discount required.
- Meets the 1% rule at list price ($2k rent vs $186k).
- Recommended offer: $175k (6.0% below list) — sets the bar for market timing.
- Cap rate 10.4% vs local median 4.5% in Hampton — top-decile yield for the area; either an underpriced asset or a hidden risk that comps aren't pricing in. Stress-test before assuming the spread holds.
Location & tenants
- Location reads 75/100 on livability (#133 in VA, #4,302 nationally) — a middle-class / working-renter tenant base. Strengths: housing A+, health & safety A+, cost of living A; Watch: crime C-, amenities D+, commute F.
- Hampton City Public School District (urban): math 60% / reading 70% proficiency, ranked #40 of 131 in VA (top 30%) — acceptable for families but not a draw, mixed tenant base, ~2y average lease.
- Market conditions: Rents rising fast (+4.0%/yr); 231 active listings in the ZIP; 3 comparable units currently listed for rent nearby; rentals at typical pace (median 15d on market — plan ~3-4 weeks tenant-placement turnaround); 68 units permitted in Hampton city in 2024 (0 in 5+ unit buildings).
- This rent runs 39% of the median local income ($73k/yr) — at the standard rent-burdened threshold; future hikes will face affordability resistance.
Forward outlook
- Local home prices are declining (-3.0%/yr); year-one equity from $1k of loan paydown is wiped out by about $6k of value loss. Plan a longer hold.
- Hampton County population projected at -13% by 2050 — secular population decline; favor cash flow + early exit over multi-decade hold.
- At projected returns (-3.0% appreciation + 4.0% rent growth), your $52k cash investment doubles in ~8 years — after that, you're playing with house money.
Negotiation context
- It's been on market 85 days — a 6% lower offer ($175k) is reasonable based on typical stale-listing flexibility.
- Current owner paid $35k; list at $186k implies a 436% gain — meaningful room to come down on a strong offer.
Risks & watch-outs
- Watch-outs: built in 1933 — expect roof / HVAC / electrical / plumbing capex.
- Climate carrying-cost: major flood risk; severe wind risk, 80% chance of damaging wind over 30y; extreme-heat days projected 7→17/yr by 2055 (HVAC capex compounding) — expect insurance premiums to compound above CPI over the hold.
Questions for the listing agent
- It's been on market 85 days. Have you received any prior offers? Is the seller open to a 6% concession, seller financing, or rate buy-down credit?
- Built in 1933 — when were the roof, HVAC, electrical panel, plumbing, and water heater last replaced?
- Why hasn't it sold? Are there any deal-killer items the seller is aware of (foundation, flood, title, zoning, code violations)?
- Is there a deadline driving the sale (1031 exchange, divorce, estate, relocation)? That informs how much negotiation room exists.
- Schools are B-rated — typically a magnet for longer-tenancy family renters. What's the average tenant stay here, and is there a school-zone premium baked into asking?
- What's the average days-on-market for RENTAL listings here right now (not sales)? A rising rental-DOM trend means longer vacancies and softer asking-rent achievability than the comps imply.
- What's the recent tenant-quality profile in this submarket — average credit score on applications, eviction rate, late-payment / NSF rate, and stable-employment percentage? A property-management company in the area should have these aggregated.
- How much new for-sale + rental construction is in the pipeline within 1–3 miles? Heavy new supply typically softens prices + rents 12–24 months out; constrained supply supports both.
Investment metrics
- 1% rule
- 1.27% ✓
- Cap rate
- 10.42%
- Cash-on-cash
- 14.75%
- DSCR
- 1.66
- GRM
- 6.6
CMA / ARV
- ARV (median comp)
- $329,638
- List price
- $185,800
- Delta
- -43.64%
- Verdict
- UNDERPRICED
- Comps
- 20 within 1.0 mi
Show comp detail 6 sales within ~0.75 mi
| Address | Dist | Beds/Ba | Sqft | Sold | Price | $/sf | Match |
|---|---|---|---|---|---|---|---|
| 5 Toledo Ct | 0.32mi | 4/2.5 (+1) | 2,324 (-4%) | 3mo | $345,500 | $149 | 65 |
| 109 Deerfield Blvd | 0.40mi | 4/2.0 (+1) | 2,491 (+3%) | 5mo | $290,000 | $116 | 64 |
| 16 Diggs Dr | 0.53mi | 4/2.5 (+1) | 2,414 (-0%) | 10mo | $340,000 | $141 | 56 |
| 41 Santa Barbara Dr | 0.45mi | 4/2.5 (+1) | 2,233 (-8%) | 5mo | $345,500 | $155 | 51 |
| 11 Butler Farm Rd | 0.15mi | 4/3.5 (+1) | 2,748 (+14%) | 8mo | $530,000 | $193 | 49 |
| 1521 Peabody Dr | 0.64mi | 4/2.0 (+1) | 2,094 (-13%) | 11mo | $350,000 | $167 | 29 |
Match score weights: distance 35% · size 25% · config 20% · recency 20%. Top-matched comps best support the ARV.
Projected returns pro-forma
-3.0% appreciation · 4.05% rent growth · sell at horizon
- IRR
- 6.4%
- Equity multiple
- 1.25×
- Total profit
- $13,135
- Equity at exit
- $27,703
- IRR
- 16.7%
- Equity multiple
- 2.43×
- Total profit
- $74,397
- Equity at exit
- $16,065
Cash invested: $52,024 (down + closing). Projections, not guarantees.
Landlord ↔ Tenant lean methodology
- Overall (STATE)
- 55 Moderately Landlord-Leaning
- State Virginia
- 55 Moderately Landlord-Leaning · D+2
- County
- — inherits STATE
- City
- — inherits STATE
ZIP-level market 23666
- Home prices YoY
- -15.7%
- Rents YoY
- 4.0%
- Active inventory
- 231
- Price-to-rent
- 6.6×
Monthly cashflow live
- Estimated rent
- $2,351 medium interval (Pro) →
- Mortgage (P&I)
- −$974
- Tax from tax record
- −$166 /mo · $1,995/yr
- Insurance
- −$77
- HOA
- −$0
- Vacancy / Maint / Mgmt
- −$494
- Net cashflow
- $640
Break-even live
UW: 25.0% down · 7.5% · 30yr · 1.5% tax · 5.0% vac · 8.0% maint · 8.0% mgmt
Financing live
Cash to close
- Down payment
- $46,450
- Closing costs
- $5,574
- Reserves months
- —
- Total cash needed
- —
Loan-product check · same deal, 3 products live
Conventional
25% down · 7.5% · 30yr
- Down + closing
- —
- Monthly P&I
- —
- Monthly cashflow
- —
- DSCR
- —
- Eligible?
- —
Personal DTI + credit; lowest rate.
DSCR
20% down · 8.5% · 30yr
- Down + closing
- —
- Monthly P&I
- —
- Monthly cashflow
- —
- DSCR
- —
- Eligible?
- —
No personal income docs; deal must DSCR.
Hard money
10% down · 12.0% · 12mo
- Down + closing
- —
- Monthly P&I
- —
- Monthly cashflow
- —
- DSCR
- —
- Eligible?
- —
Short-term bridge; refi at stabilization.
Rent comps 3 comps
| Address | Beds | Baths | Sqft | Rent | $/sqft | DOM | Units | Dist |
|---|---|---|---|---|---|---|---|---|
| 608 Charlton Dr Hampton, VA | 3.0 | 2.5 | 1800 | $2,500 | $1.39 | 14d | 1 | 1.08mi |
| 10 Rutland Dr Hampton, VA | 3.0 | 2.5 | 1817 | $2,600 | $1.43 | 23d | 1 | 1.18mi |
| 110 Marvin Dr Hampton, VA | 4.0 | 2.5 | 2300 | $2,400 | $1.04 | 14d | 1 | 1.18mi |
Listing history 18 events
-
2026-06-18days on market $185,800 Active 85 DOM
-
2026-06-17days on market $185,800 Active 84 DOM
-
2026-06-16days on market $185,800 Active 83 DOM
-
2026-06-15days on market $185,800 Active 82 DOM
-
2026-06-13days on market $185,800 Active 80 DOM
-
2026-06-13days on market $185,800 Active 79 DOM
-
2026-06-09days on market $185,800 Active 76 DOM
-
2026-06-08days on market $185,800 Active 75 DOM
-
2026-06-07days on market $185,800 Active 74 DOM
-
2026-06-03days on market $185,800 Active 70 DOM
-
2026-06-02days on market $185,800 Active 69 DOM
-
2026-06-01days on market $185,800 Active 68 DOM
-
2026-05-31days on market $185,800 Active 67 DOM
-
2026-05-13price $228,800 320-char remark
Show marketing remark (320 chars)
NO ACCESS OR VIEWINGS of this property. Please DO NOT DISTURB the occupant. Take a drive by this three bedroom, one bath home and see if it may be your next investment. "As is" cash only sale with no contingencies or inspections. Buyer will be responsible for obtaining possession of the property upon closing.
-
2026-04-28price $249,000 320-char remark
Show marketing remark (320 chars)
NO ACCESS OR VIEWINGS of this property. Please DO NOT DISTURB the occupant. Take a drive by this three bedroom, one bath home and see if it may be your next investment. "As is" cash only sale with no contingencies or inspections. Buyer will be responsible for obtaining possession of the property upon closing.
-
2026-04-10price $274,800 320-char remark
Show marketing remark (320 chars)
NO ACCESS OR VIEWINGS of this property. Please DO NOT DISTURB the occupant. Take a drive by this three bedroom, one bath home and see if it may be your next investment. "As is" cash only sale with no contingencies or inspections. Buyer will be responsible for obtaining possession of the property upon closing.
-
2026-03-25$302,100 Active 320-char remark
Show marketing remark (320 chars)
NO ACCESS OR VIEWINGS of this property. Please DO NOT DISTURB the occupant. Take a drive by this three bedroom, one bath home and see if it may be your next investment. "As is" cash only sale with no contingencies or inspections. Buyer will be responsible for obtaining possession of the property upon closing.
-
1993-08-01soldstatus $34,656
ⓘ Source: listings_history table (triggers on properties + properties_extension) + one-shot
backfill from property_details.listing_events for pre-trigger history.
Tax reassessment forecast VA · Resets to sale price
- Current annual tax
- $1,995 · $166/mo
- Projected year-2 tax
- $1,995 · $166/mo
- Expected delta
- $0/yr ($0/mo · 0.0%)
ⓘ Screening estimate from a state-policy table — verify with the county assessor before closing.
Climate risk First Street
- Flood 6/10 Major FEMA zone X (unshaded) · 73% chance over 30 yrs
- Wildfire 3/10 Moderate
- Heat 9/10 Extreme 7 d/yr ≥105°F today · 17 d/yr by 30 yrs out
- Wind 8/10 Severe 80% chance of damaging wind over 30 yrs
- Air quality 2/10 Low 2 unhealthy d/yr today · 2 by 30 yrs out
Nearby sold comps map
Loading sold comps map…
Walkable amenities ~0.75 mi
Loading nearby amenities…
Taxation est. · year 1
- Rental income
- $28,217
- − Mortgage interest
- −$10,408
- − Property taxes
- −$1,995
- − Insurance
- −$929
- − Repairs & maintenance
- −$2,257
- − Management
- −$2,257
- − Depreciation
- −$5,405
- Taxable income
- $4,966
- Est. tax owed @ 24.0%
- −$1,192
- After-tax cash flow
- $6,484/yr
For passive investors: Depreciation is non-cash, so a rental often shows a tax loss while cash-flowing — sheltering income. Rental losses are passive: they offset passive income freely, and up to $25,000/yr can offset ordinary (W-2) income if you actively participate and your MAGI is under $100k (phasing out to $0 by $150k); unused losses carry forward. On sale, claimed depreciation is recaptured at up to 25%, and gains may owe capital-gains tax (a 1031 exchange can defer both). Figures are a year-1 estimate at your 24.0% rate — not tax advice; consult a CPA.
Schools (NCES district)
- District
- Hampton City Public School District
- NCES district ID
- 5101800
- Math proficiency
- 60% ▼ -21.00%
- Reading proficiency
- 70% ▼ -4.00%
- Median HH income
- $50,089
- Composite
- 55.19/100
- National rank
- #1272
- State rank
- #40 of 131 in VA
Livability — Hampton
- Score
- 75/100
- State rank
- #133
- US rank
- #4302
Category grades
Schools grade is shown separately in the Schools card above.
Census & demographics
- Census place
- Hampton, VA
- County
- Hampton City · 132,421 people
- City population
- 132,421
- Metro
- Virginia Beach-Norfolk-Newport News, VA-NC
- Population (ZIP)
- 54,233
- Household income
- $72,568
- Rent vs Own
- Severe rent burden
- 2951.0
Population outlook (Hampton County) Hauer SSP2
- Today (2025)
- 134,055 people
- By 2030
- 131,753 · -1.7%
- By 2040
- 125,017 · -6.7%
- By 2050
- 116,825 · -12.9%
- By 2075
- 97,033 · -27.6%
- By 2100
- 76,188 · -43.2%
Race, ethnicity, and origin ACS 2023
- Neighborhood character
- Diverse neighborhood (Simpson 0.65)
- Race & ethnicity
- Black 51% White 29% Two or more races 10% Hispanic / Latino 9% Asian 4%
- Hispanic origin (detail)
- Mexican 3% Puerto Rican 3%
- Common ancestry
- Italian 1% Lithuanian 1% Romanian 1%
- Foreign-born
- 7% · Canada, Vietnam
- Languages at home
- 90% English-only · Spanish 5% Vietnamese 1% Arabic 1%
Political lean MEDSL · Hampton
- 2024 margin
- Solid D (+39.9) · D 69.2% · R 29.4% · Other 1.4%
- 2008→2024 swing
- +1.0pp no change · 2008: 38.9pp · 2024: 39.9pp
- All cycles
- 2024: D+39.9 2020: D+42.2 2016: D+37.8 2012: D+45.4 2008: D+38.9
Not yet ingested
- Civics
- —
Market trends
- HPI YoY
- ▼ -49.01%
- Current HPI
- 262.821
- Rent YoY
- ▲ 4.05%
- Metro
- Virginia Beach-Norfolk-Newport News, VA-NC
- State GDP YoY
- ▲ 2.40%
- F500 in state
- 50
Industry mix (Fortune 500 HQ in VA)
| Industry | F500 HQs | Revenue |
|---|---|---|
| Aerospace / Defense | 4 | $236B |
|
||
| Technology / Defense | 3 | $32B |
|
||
| Financial Services | 2 | $176B |
|
||
| Utilities | 2 | $27B |
|
||
| Insurance | 2 | $25B |
|
||
| Technology | 2 | $15B |
|
||
Price history
+560.2% since first listed5 events — show timeline
- 2026-05-13 Price Changed $228,800 BRIGHT MLS
- 2026-04-28 Price Changed $249,000 BRIGHT MLS
- 2026-04-10 Price Changed $274,800 BRIGHT MLS
- 2026-03-25 Listed $302,100 BRIGHT MLS
- 1993-08-01 Sold (Public Records) $34,656 Public Records
Property tax history
+6.4%/yrLatest (2025): $1,995 · -0.5% YoY. Source: county tax records.
Cash-flow waterfall
monthlySold comps — $/sqft
last 12 mo · ≤1 miLoading sold comps…