734 S Drexel Ave · Indianapolis city (balance), IN
Flood risk 1/10 · Minimal
- FEMA flood zone
- X (unshaded)
- Chance of flooding over 30 yrs
- 0.0%
- Est. flood insurance / yr
- $507 – $1,088
Fire risk 1/10 · Minimal
- Est. fire insurance / yr
- $717 – $1,331
Heat risk 3/10 · Minor
- Hot days now (above 102°F)
- 7 days/yr
- Hot days in 30 yrs
- 18 days/yr
Wind risk 2/10 · Minimal
- Chance of severe wind over 30 yrs
- 1.0%
Air-quality risk 4/10 · Minor
- Unhealthy air days now
- 5 days/yr
- Unhealthy air days in 30 yrs
- 7 days/yr
Risk factors via First Street. Map © Google.
Why this score? — see what drove the B- grade
The composite is a weighted blend of 9 inputs, each scored 0–100. Each bar is that input's sub-score; the figure is the points it added to the 100-point composite (weight × sub-score).
- Cash flow +28.2/30.0
- ARV discount +15.0/15.0
- DSCR +10.0/10.0
- 1% rule +6.7/10.0
- Rent growth +3.2/5.0
- Livability +2.5/5.0
- Condition / age +2.5/5.0
- Schools +1.4/10.0
- Appreciation +0.0/10.0
$120,400
🖨 Deal sheet 📄 Offer letter ✓ Due diligence
Listing remarks
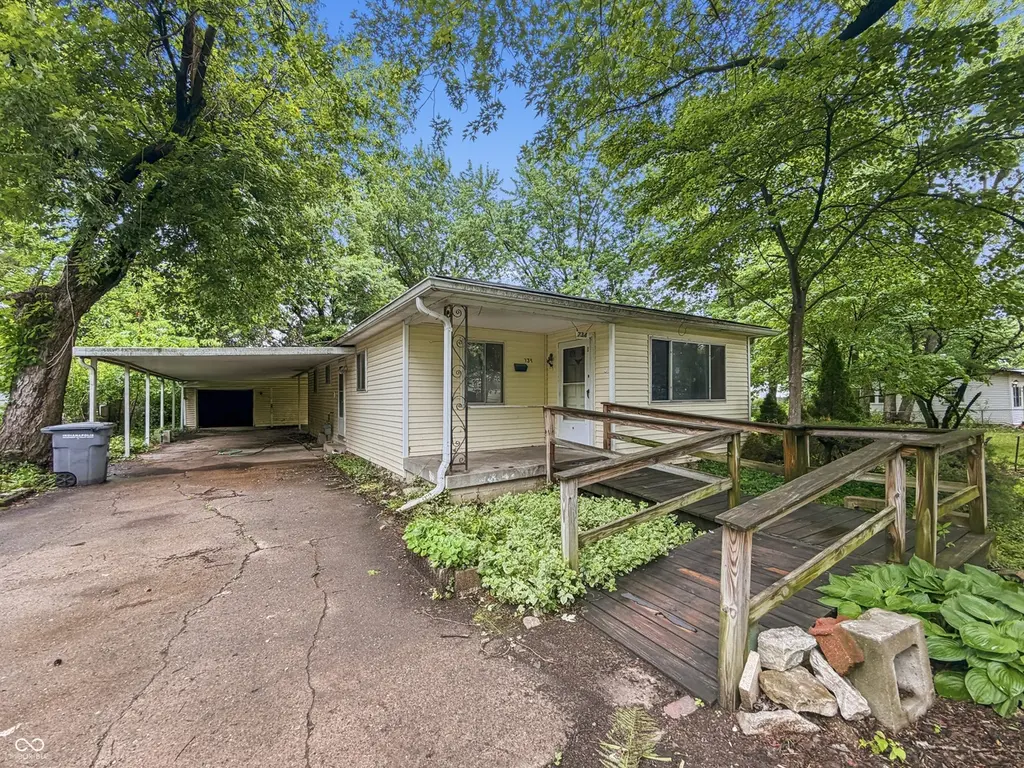
This ranch-style home offers a comfortable layout and the kind of potential that's easy to appreciate. From the moment you arrive, you'll notice the simplicity of single-level living paired with a functional floor plan that makes everyday life easy. Whether you're searching for a starter home, downsizing opportunity, or investment property, this one is worth a closer look. Built in 1961, this home offers 1,038 square feet of living space with low-maintenance vinyl siding and metal windows. Inside, you'll find 3 bedrooms and 1 full bathroom, with a layout designed to make the most of the space. A 1-car detached garage adds extra storage and convenience, making this property a solid opportuni
Key facts
- 0.36 acre lot
- Garage
- Built 1961
Property features AI
Exterior
- Parking: Detached garage (1 car)
- Utilities: Public water; Municipal sewer; Solid waste service available
- Home design: Single-family residence; One story
- Construction: Vinyl siding; Block foundation
- Exterior features: Approximately 0.36-acre lot
Interior
- Kitchen: Refrigerator; Electric oven
- Bedrooms: 3 bedrooms, all on the main level (sizes include 13x10, 11x10, 10x10)
- Flooring: Hardwood floors
- Bathrooms: 1 full bathroom on the main level
- Heating & cooling: Forced air heating (natural gas); Central air conditioning
- Interior features: Hardwood floors; Woodwork stained/painted
- Laundry & utility: Washer; Dryer; Main-level laundry (5x6)
Neighborhood map
What this means for you Summary
Snapshot
- This is a 3-bed/1.0-bath single-family listed at $120k.
Deal economics
- At list price, monthly cash flow is $381 ($5k/yr) — positive.
- The deal already cash-flows at list — no discount required.
- Meets the 1% rule at list price ($1k rent vs $120k).
- Recommended offer: $119k (1.5% below list) — sets the bar for market timing.
- Cap rate 10.1% vs local median 4.4% in Indianapolis city (balance) — top-decile yield for the area; either an underpriced asset or a hidden risk that comps aren't pricing in. Stress-test before assuming the spread holds.
Location & tenants
- Location reads: area grade B — affects rentability + tenant quality, not the cash-flow math above.
- Indianapolis Public Schools (urban): math 14% / reading 20% proficiency, ranked #286 of 301 in IN (top 95%) — low school quality limits family demand, transient renter base, plan for 1-2y turnover; 77% free/reduced lunch — lower-income household profile, screen leases tightly.
- Market conditions: Rents rising (+2.9%/yr); 493 active listings in the ZIP; 40 comparable units currently listed for rent nearby; rentals at typical pace (median 24d on market — plan ~3-4 weeks tenant-placement turnaround); 42% of comp listings sitting > 30 days — soft ceiling on asking rent; 1,906 units permitted in Marion County in 2024 (621 in 5+ unit buildings).
Forward outlook
- Local home prices are declining (-3.0%/yr); year-one equity from $832 of loan paydown is wiped out by about $4k of value loss. Plan a longer hold.
- Marion County population projected at +18% by 2050 — long-run rental-demand tailwind backs the buy-and-hold thesis.
- At projected returns (-3.0% appreciation + 2.9% rent growth), your $34k cash investment doubles in ~9 years — after that, you're playing with house money.
Negotiation context
- It's been on market 20 days — a 2% lower offer ($119k) is reasonable based on typical stale-listing flexibility.
Questions for the listing agent
- Built in 1961 — when were the roof, HVAC, electrical panel, plumbing, and water heater last replaced?
- Is there a deadline driving the sale (1031 exchange, divorce, estate, relocation)? That informs how much negotiation room exists.
- What's the average days-on-market for RENTAL listings here right now (not sales)? A rising rental-DOM trend means longer vacancies and softer asking-rent achievability than the comps imply.
- What's the recent tenant-quality profile in this submarket — average credit score on applications, eviction rate, late-payment / NSF rate, and stable-employment percentage? A property-management company in the area should have these aggregated.
- How much new for-sale + rental construction is in the pipeline within 1–3 miles? Heavy new supply typically softens prices + rents 12–24 months out; constrained supply supports both.
Investment metrics
- 1% rule
- 1.17% ✓
- Cap rate
- 10.09%
- Cash-on-cash
- 13.56%
- DSCR
- 1.60
- GRM
- 7.1
CMA / ARV
- ARV (on-the-fly)
- $150,510
- Comps found
- 12
Show comp detail 12 sales within ~0.75 mi
| Address | Dist | Beds/Ba | Sqft | Sold | Price | $/sf | Match |
|---|---|---|---|---|---|---|---|
| 4425 Hoyt Ave | 0.05mi | 3/1.0 | 1,128 (+9%) | 2mo | $160,000 | $142 | 82 |
| 4514 Rowney St | 0.63mi | 3/1.0 | 1,043 (+0%) | 3mo | $185,000 | $177 | 68 |
| 729 Auvergne Ave | 0.33mi | 3/1.0 | 1,152 (+11%) | 1mo | $149,900 | $130 | 66 |
| 1214 S Grant Ave | 0.59mi | 3/1.0 | 971 (-6%) | 1mo | $215,000 | $221 | 61 |
| 3710 Hoyt Ave | 0.61mi | 3/1.0 | 960 (-8%) | 1mo | $121,000 | $126 | 58 |
| 4648 Brookville Rd | 0.46mi | 3/2.0 | 936 (-10%) | 3mo | $189,900 | $203 | 56 |
| 1423 S Grant Ave | 0.68mi | 3/1.0 | 1,104 (+6%) | 3mo | $159,900 | $145 | 55 |
| 1159 S Bradley Ave | 0.64mi | 3/1.0 | 936 (-10%) | 1mo | $86,000 | $92 | 53 |
| 4307 Terrace Ave | 0.62mi | 3/1.0 | 936 (-10%) | 3mo | $150,000 | $160 | 52 |
| 4624 Terrace Ave | 0.51mi | 2/2.0 (-1) | 1,130 (+9%) | 2mo | $108,990 | $96 | 51 |
| 1400 Temperance Ave | 0.57mi | 3/1.0 | 1,176 (+13%) | 1mo | $190,000 | $162 | 50 |
| 3847 Hoyt Ave | 0.45mi | 2/1.0 (-1) | 912 (-12%) | 6mo | $75,000 | $82 | 48 |
Match score weights: distance 35% · size 25% · config 20% · recency 20%. Top-matched comps best support the ARV.
Projected returns pro-forma
-3.0% appreciation · 2.88% rent growth · sell at horizon
- IRR
- 3.5%
- Equity multiple
- 1.13×
- Total profit
- $4,546
- Equity at exit
- $17,952
- IRR
- 12.9%
- Equity multiple
- 2.02×
- Total profit
- $34,342
- Equity at exit
- $10,410
Cash invested: $33,712 (down + closing). Projections, not guarantees.
Landlord ↔ Tenant lean methodology
- Overall (STATE)
- 90 Strongly Landlord-Friendly
- State Indiana
- 90 Strongly Landlord-Friendly · R+11
- County
- — inherits STATE
- City
- — inherits STATE
ZIP-level market 46203
- Home prices YoY
- -26.7%
- Rents YoY
- 2.9%
- Active inventory
- 493
- Price-to-rent
- 7.1×
Monthly cashflow live
- Estimated rent
- $1,406 high interval (Pro) →
- Mortgage (P&I)
- −$631
- Tax from tax record
- −$48 /mo · $576/yr
- Insurance
- −$50
- HOA
- −$0
- Vacancy / Maint / Mgmt
- −$295
- Net cashflow
- $381
Break-even live
UW: 25.0% down · 7.5% · 30yr · 1.5% tax · 5.0% vac · 8.0% maint · 8.0% mgmt
Financing live
Cash to close
- Down payment
- $30,100
- Closing costs
- $3,612
- Reserves months
- —
- Total cash needed
- —
Loan-product check · same deal, 3 products live
Conventional
25% down · 7.5% · 30yr
- Down + closing
- —
- Monthly P&I
- —
- Monthly cashflow
- —
- DSCR
- —
- Eligible?
- —
Personal DTI + credit; lowest rate.
DSCR
20% down · 8.5% · 30yr
- Down + closing
- —
- Monthly P&I
- —
- Monthly cashflow
- —
- DSCR
- —
- Eligible?
- —
No personal income docs; deal must DSCR.
Hard money
10% down · 12.0% · 12mo
- Down + closing
- —
- Monthly P&I
- —
- Monthly cashflow
- —
- DSCR
- —
- Eligible?
- —
Short-term bridge; refi at stabilization.
Rent comps 40 comps
| Address | Beds | Baths | Sqft | Rent | $/sqft | DOM | Units | Dist |
|---|---|---|---|---|---|---|---|---|
| 739 Temperance Ave Indianapolis, IN | 3.0 | 1.0 | 1136 | $1,350 | $1.19 | 43d | 1 | 0.00mi |
| 4318 Spann Ave Indianapolis, IN | 3.0 | 1.0 | 1411 | $1,200 | $0.85 | 43d | 1 | 0.20mi |
| 528 S Bosart Ave Indianapolis, IN | 3.0 | 1.0 | 720 | $1,305 | $1.81 | 43d | 1 | 0.22mi |
| 750 S Dequincy St Indianapolis, IN | 3.0 | 1.5 | 936 | $1,500 | $1.60 | 43d | 1 | 0.26mi |
| 3906 Hoyt Ave Indianapolis, IN | 2.0 | 1.0 | 912 | $1,250 | $1.37 | 7d | 1 | 0.40mi |
| 4919 Orion Ave Indianapolis, IN | 2.0 | 1.0 | 766 | $875 | $1.14 | 43d | 1 | 0.60mi |
| 3706 Hoyt Ave Indianapolis, IN | 3.0 | 1.0 | 960 | $1,500 | $1.56 | 14d | 1 | 0.60mi |
| 3702 Hoyt Ave Indianapolis, IN | 3.0 | 2.0 | 960 | $1,500 | $1.56 | 14d | 1 | 0.61mi |
| 4931 Orion Ave Indianapolis, IN | 2.0 | 1.0 | 1200 | $1,450 | $1.21 | 23d | 1 | 0.61mi |
| 5131 E Burgess Ave Indianapolis, IN | 2.0 | 1.0 | 816 | $1,100 | $1.35 | 43d | 1 | 0.69mi |
| 5015 Reeder St Indianapolis, IN | 3.0 | 2.0 | 1482 | $1,950 | $1.32 | 43d | 1 | 0.82mi |
| 4214 E Washington St Indianapolis, IN | 3.0 | 2.0 | 961 | $1,195 | $1.24 | 7d | 1 | 0.90mi |
| 4831 E Washington St Unit 4 Indianapolis, IN | 2.0 | 2.0 | 1000 | $995 | $0.99 | 23d | 1 | 0.90mi |
| 3518 Terrace Ave Indianapolis, IN | 3.0 | 1.0 | 864 | $1,300 | $1.50 | 43d | 1 | 0.92mi |
| 4114 E Washington St Indianapolis, IN | 2.0 | 1.0 | 909 | $1,100 | $1.21 | 44d | 1 | 0.92mi |
| 3441 Prospect St Indianapolis, IN | 2.0 | 1.0 | 1008 | $1,500 | $1.49 | 23d | 1 | 0.93mi |
| 3441 Prospect St Indianapolis, IN | 2.0 | 1.0 | 1008 | $1,700 | $1.69 | 44d | 1 | 0.93mi |
| 25 N Drexel Ave Unit A Indianapolis, IN | 3.0 | 2.0 | 1250 | $1,325 | $1.06 | 43d | 1 | 0.93mi |
| 8 S Bradley Ave Indianapolis, IN | 2.0 | 1.0 | 1300 | $950 | $0.73 | 23d | 1 | 0.95mi |
| 119 N Grant Ave Indianapolis, IN | 3.0 | 1.0 | 1408 | $1,195 | $0.85 | 43d | 1 | 1.04mi |
| 33 N Sherman Dr Unit 33 Indianapolis, IN | 3.0 | 1.5 | 1288 | $1,500 | $1.16 | 7d | 1 | 1.05mi |
| 340 S Dearborn St Indianapolis, IN | 2.0 | 1.0 | 873 | $1,180 | $1.35 | 23d | 1 | 1.06mi |
| 5056 Emerton Pl Unit 5056 Indianapolis, IN | 2.0 | 1.0 | 868 | $1,245 | $1.43 | 23d | 1 | 1.09mi |
| 5056 Emerton Pl Unit 5046 Indianapolis, IN | 2.0 | 1.5 | 1039 | $1,245 | $1.20 | 23d | 1 | 1.09mi |
| 4 N Butler Ave Unit 8 Indianapolis, IN | 2.0 | 1.0 | 850 | $800 | $0.94 | 43d | 1 | 1.12mi |
| 4 N Butler Ave Unit 11 Indianapolis, IN | 2.0 | 1.0 | 850 | $750 | $0.88 | 4d | 1 | 1.12mi |
| 306 N Riley Ave Indianapolis, IN | 3.0 | 1.0 | 1320 | $1,095 | $0.83 | 17d | 1 | 1.12mi |
| 301 S Gray St Indianapolis, IN | 2.0 | 1.0 | 841 | $1,025 | $1.22 | 23d | 1 | 1.13mi |
| 37 S Tuxedo St Indianapolis, IN | 3.0 | 1.0 | 950 | $1,150 | $1.21 | 43d | 1 | 1.14mi |
| 253 S Gray St Indianapolis, IN | 3.0 | 1.5 | 1176 | $1,660 | $1.41 | 2d | 1 | 1.14mi |
| 314 N Denny St Indianapolis, IN | 3.0 | 1.0 | 1184 | $975 | $0.82 | 23d | 1 | 1.15mi |
| 5010 Emerton Pl Indianapolis, IN | 2.0 | 1.5 | 1002 | $1,095 | $1.09 | 43d | 1 | 1.16mi |
| 415 N Dequincy St Indianapolis, IN | 3.0 | 2.0 | 1250 | $1,900 | $1.52 | 14d | 1 | 1.19mi |
| 83 N Ewing St Unit 83 Indianapolis, IN | 3.0 | 1.0 | 1016 | $1,199 | $1.18 | 43d | 1 | 1.21mi |
| 5250 E Market St Unit 5252 Indianapolis, IN | 2.0 | 1.0 | 1000 | $1,350 | $1.35 | 14d | 1 | 1.22mi |
| 3622 E New York St Indianapolis, IN | 2.0 | 1.0 | 805 | $995 | $1.24 | 43d | 1 | 1.24mi |
| 28 S Dearborn St Unit A Indianapolis, IN | 3.0 | 1.0 | 1100 | $1,400 | $1.27 | 10d | 1 | 1.25mi |
| 28 S Dearborn St Unit B Indianapolis, IN | 2.0 | 1.5 | 1166 | $1,150 | $0.99 | 23d | 1 | 1.25mi |
| 412 N Bradley Ave Unit 3 Indianapolis, IN | 2.0 | 1.0 | 700 | $950 | $1.36 | 23d | 1 | 1.25mi |
| 442 N Denny St Indianapolis, IN | 3.0 | 1.0 | 1140 | $1,045 | $0.92 | 23d | 1 | 1.29mi |
Listing history 13 events
-
2026-06-18days on market $120,400 Active 20 DOM
-
2026-06-17days on market $120,400 Active 19 DOM
-
2026-06-16days on market $120,400 Active 18 DOM
-
2026-06-15days on market $120,400 Active 17 DOM
-
2026-06-13days on market $120,400 Active 15 DOM
-
2026-06-13statusdays on market $120,400 Active 14 DOM
-
2026-06-08statusdays on market $120,400 Pending 12 DOM
-
2026-06-07days on market $120,400 Active 11 DOM
-
2026-06-03days on market $120,400 Active 7 DOM
-
2026-06-02days on market $120,400 Active 6 DOM
-
2026-06-01days on market $120,400 Active 5 DOM
-
2026-05-31days on market $120,400 Active 4 DOM
-
2026-05-27$120,400 Active
ⓘ Source: listings_history table (triggers on properties + properties_extension) + one-shot
backfill from property_details.listing_events for pre-trigger history.
Tax reassessment forecast IN · Partial reset (capped growth)
- Current annual tax
- $576 · $48/mo
- Projected year-2 tax
- $799 · $67/mo
- Expected delta
- +$224/yr (+$19/mo · 38.9%)
ⓘ Screening estimate from a state-policy table — verify with the county assessor before closing.
Climate risk First Street
- Flood 1/10 Low FEMA zone X (unshaded) · 0% chance over 30 yrs
- Wildfire 1/10 Low
- Heat 3/10 Moderate 7 d/yr ≥102°F today · 18 d/yr by 30 yrs out
- Wind 2/10 Low 100% chance of damaging wind over 30 yrs
- Air quality 4/10 Moderate 5 unhealthy d/yr today · 7 by 30 yrs out
Nearby sold comps map
Loading sold comps map…
Walkable amenities ~0.75 mi
Loading nearby amenities…
Taxation est. · year 1
- Rental income
- $16,869
- − Mortgage interest
- −$6,744
- − Property taxes
- −$576
- − Insurance
- −$602
- − Repairs & maintenance
- −$1,350
- − Management
- −$1,350
- − Depreciation
- −$3,503
- Taxable income
- $2,745
- Est. tax owed @ 24.0%
- −$659
- After-tax cash flow
- $3,913/yr
For passive investors: Depreciation is non-cash, so a rental often shows a tax loss while cash-flowing — sheltering income. Rental losses are passive: they offset passive income freely, and up to $25,000/yr can offset ordinary (W-2) income if you actively participate and your MAGI is under $100k (phasing out to $0 by $150k); unused losses carry forward. On sale, claimed depreciation is recaptured at up to 25%, and gains may owe capital-gains tax (a 1031 exchange can defer both). Figures are a year-1 estimate at your 24.0% rate — not tax advice; consult a CPA.
Schools (NCES district)
- District
- Indianapolis Public Schools
- NCES district ID
- 1804770
- Math proficiency
- 14% ▼ -7.00%
- Reading proficiency
- 20% ▼ -3.00%
- Median HH income
- $32,034
- Composite
- 13.69/100
- National rank
- #9499
- State rank
- #286 of 301 in IN
Livability — Indianapolis city (balance)
No livability data for this city. (Only ~50 U.S. cities are tracked.)
Census & demographics
- Census place
- Indianapolis city (balance), IN
- County
- Marion County · 998,460 people
- City population
- 881,119
- Metro
- Indianapolis-Carmel-Anderson, IN
- Population (ZIP)
- 37,758
- Household income
- $57,393
- Rent vs Own
- Severe rent burden
- 1499.0
Population outlook (Marion County) Hauer SSP2
- Today (2025)
- 1,025,572 people
- By 2030
- 1,065,727 · +3.9%
- By 2040
- 1,141,577 · +11.3%
- By 2050
- 1,208,920 · +17.9%
- By 2075
- 1,367,288 · +33.3%
- By 2100
- 1,438,201 · +40.2%
Race, ethnicity, and origin ACS 2023
- Neighborhood character
- Predominantly White (69%)
- Race & ethnicity
- White 69% Hispanic / Latino 14% Black 12% Two or more races 8% Asian 2% Native American 1%
- Hispanic origin (detail)
- Mexican 12% Puerto Rican 1%
- Common ancestry
- Slovak 2% Lithuanian 2% Italian 1%
- Foreign-born
- 8% · Canada
- Languages at home
- 88% English-only · Spanish 10% Other Indo-European 1%
Political lean MEDSL · Marion
- 2024 margin
- Strong D (+27.7) · D 63.0% · R 35.3% · Other 1.7%
- 2008→2024 swing
- -0.7pp no change · 2008: 28.4pp · 2024: 27.7pp
- All cycles
- 2024: D+27.7 2020: D+29.1 2016: D+22.8 2012: D+22.2 2008: D+28.4
Not yet ingested
- Civics
- —
Market trends
- HPI YoY
- ▼ -127.37%
- Current HPI
- 349.579
- Rent YoY
- ▲ 2.88%
- Metro
- Indianapolis-Carmel-Anderson, IN
- State GDP YoY
- ▲ 2.90%
- F500 in state
- 18
Industry mix (Fortune 500 HQ in IN)
| Industry | F500 HQs | Revenue |
|---|---|---|
| Industrial Machinery | 2 | $37B |
|
||
| Healthcare | 1 | $177B |
|
||
| Pharmaceuticals | 1 | $45B |
|
||
| Metals / Steel | 1 | $18B |
|
||
| Agriculture | 1 | $17B |
|
||
| Packaging | 1 | $12B |
|
||
Price history
1 event — show timeline
- 2026-05-27 Listed $120,400 MIBOR as Distributed by MLS Grid
Property tax history
+23.0%/yrLatest (2025): $576 · +2.0% YoY. Source: county tax records.
Cash-flow waterfall
monthlySold comps — $/sqft
last 12 mo · ≤1 miLoading sold comps…